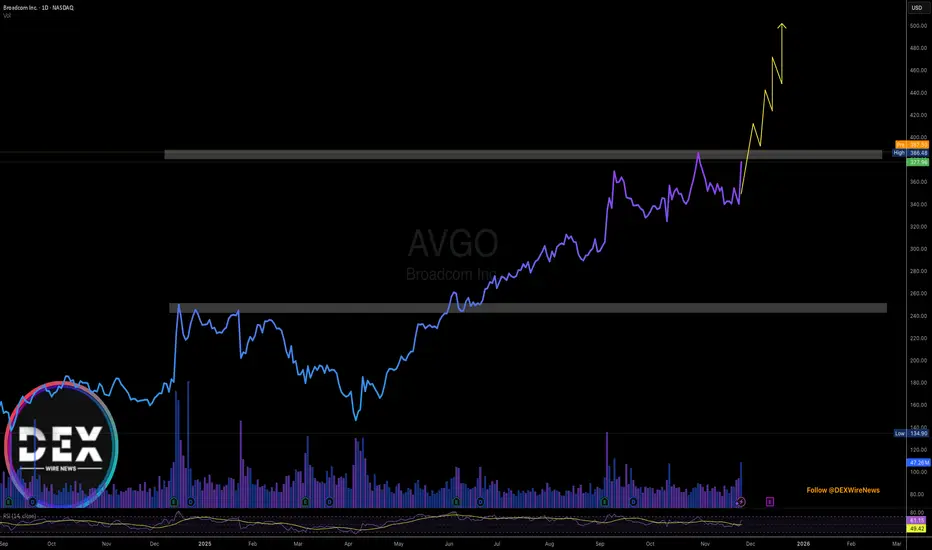
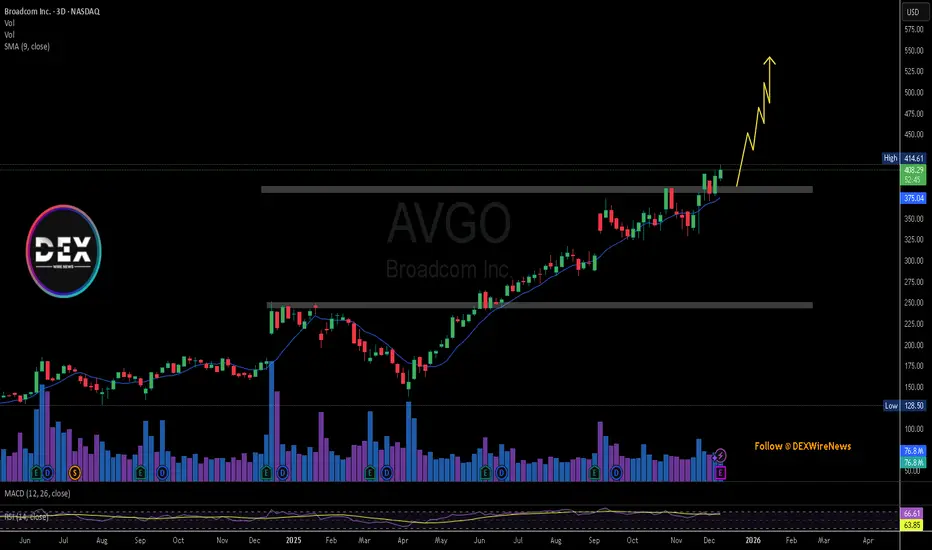
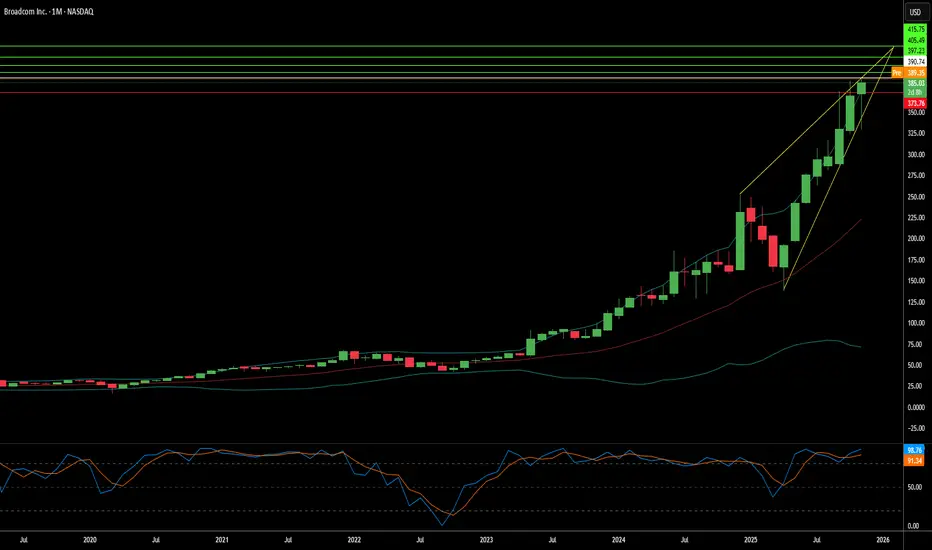
Broadcom - The short of the century!⏰Broadcom ( NASDAQ:AVGO ) is reversing right now:
🔎Analysis summary:
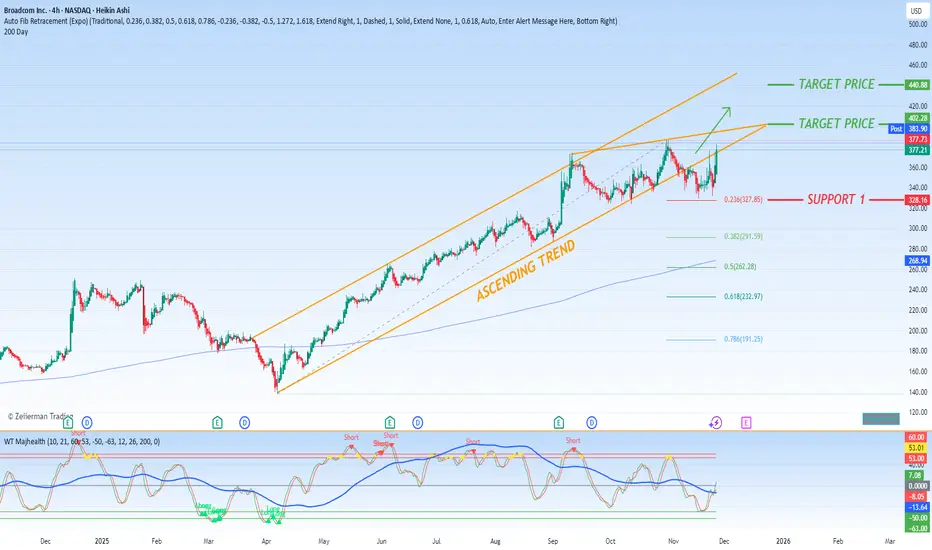
Broadcom is just insane. After another retest of the very steep support trendline, we just witnessed a crazy rally of +200%. But at this exact moment, Broadcom is totally overextended and retesting major resistance. A healthy correction is starting today.
📝Levels to watch:
$400 and $300
SwingTraderPhil
SwingTrading.Simplified. | Investing.Simplified. | #LONGTERMVISION
Broadcom Inc. Deposito Arg Repr 0.025641 Sh
No trades
Trade ideas

Broadcom (AVGO) Shares Hit a Record Ahead of EarningsBroadcom (AVGO) Shares Hit a Record Ahead of Earnings
Broadcom (AVGO) shares reached an all-time high ahead of the company’s quarterly results, due this Thursday, supported by strong fundamental drivers:
→ Partnership with Microsoft: Media reports suggest Broadcom is in talks with Microsoft to develop custom AI chips.
→ Analyst optimism: UBS called Broadcom a “top investment” in the AI sector, citing explosive demand for hardware, and raised its price target to $472.
→ Shift in strategy: Market participants believe the company is refocusing on its own chips to win AI hardware market share from Nvidia.
We highlighted additional bullish drivers in our 14 October analysis.
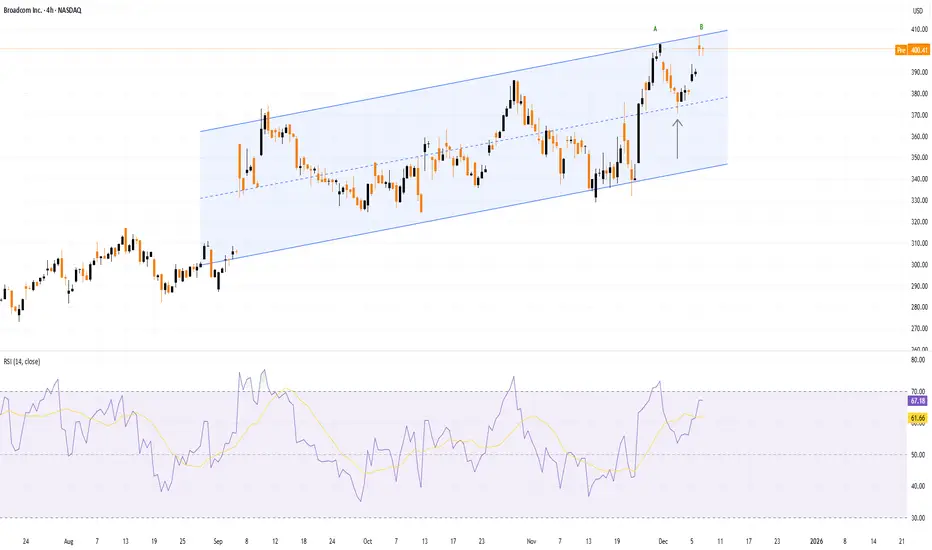
Technical Analysis of AVGO Shares
Following a bullish gap on 4 September, price movements have formed an upward channel (shown in blue).
From a bullish perspective:
→ the channel median is acting as support (indicated by the arrow);
→ the wide bullish candle on 24 November signals strong buying pressure;
→ the share is outperforming equity indices.
From a bearish perspective:
→ the AVGO share price is currently near the upper boundary of the channel;
→ the psychological $400 level is showing signs of resistance;
→ at peak B the price rose only slightly above the previous peak A before pulling back – a sign of a potential bull trap.
It is possible that in the coming days, AVGO may show signs of consolidation near the upper channel boundary, while the earnings release could trigger a volatility spike and a large gap, given the market’s elevated expectations.
This article represents the opinion of the Companies operating under the FXOpen brand only. It is not to be construed as an offer, solicitation, or recommendation with respect to products and services provided by the Companies operating under the FXOpen brand, nor is it to be considered financial advice.
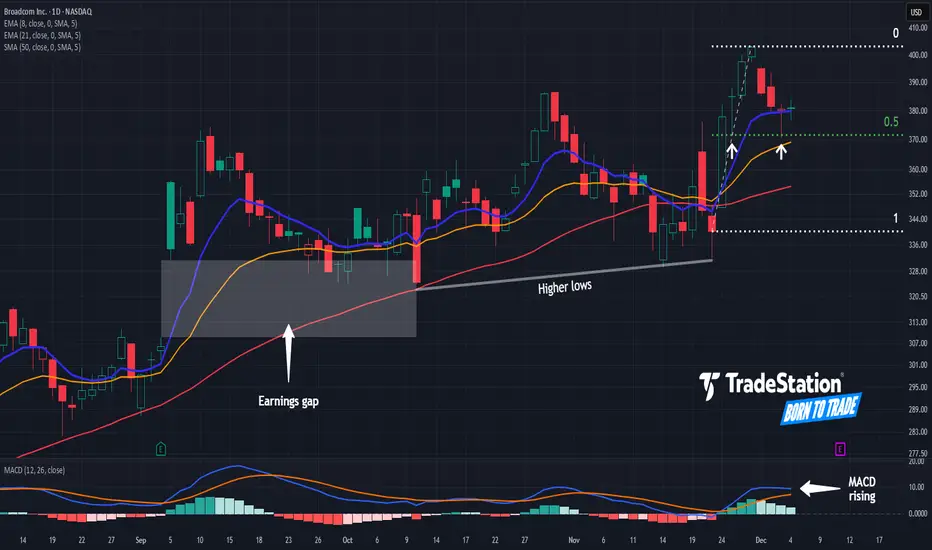
Uptrend in Broadcom? Broadcom hit a new all-time high last week, and some traders may think the chipmaker will continue to advance.
The first pattern on today’s chart is the rally between Friday, November 21, and Friday, November 28. AVGO retraced half the move and bounced, which may suggest its direction remains bullish.
Second, the 8-day exponential moving average (EMA) is above the 21-day EMA. MACD is also rising. Those signals may reflect a positive short-term trend.
Third, strong quarterly results propelled the stock upward on September 5. AVGO never filled the bullish gap, which may suggest buyers outnumber sellers.
Next, you have the series of higher lows in October and November. That could also reveal accumulation of the stock.
Finally, AVGO is an active underlier in the options market. (Its average volume of 260,000 contracts ranks 14th in the S&P 500, according to TradeStation data.) That may help traders take positions with calls and puts.
TradeStation has, for decades, advanced the trading industry, providing access to stocks, options and futures. If you're born to trade, we could be for you. See our Overview for more.
Past performance, whether actual or indicated by historical tests of strategies, is no guarantee of future performance or success. There is a possibility that you may sustain a loss equal to or greater than your entire investment regardless of which asset class you trade (equities, options or futures); therefore, you should not invest or risk money that you cannot afford to lose. Online trading is not suitable for all investors. View the document titled Characteristics and Risks of Standardized Options at www.TradeStation.com . Before trading any asset class, customers must read the relevant risk disclosure statements on www.TradeStation.com . System access and trade placement and execution may be delayed or fail due to market volatility and volume, quote delays, system and software errors, Internet traffic, outages and other factors.
Securities and futures trading is offered to self-directed customers by TradeStation Securities, Inc., a broker-dealer registered with the Securities and Exchange Commission and a futures commission merchant licensed with the Commodity Futures Trading Commission). TradeStation Securities is a member of the Financial Industry Regulatory Authority, the National Futures Association, and a number of exchanges.
Options trading is not suitable for all investors. Your TradeStation Securities’ account application to trade options will be considered and approved or disapproved based on all relevant factors, including your trading experience. See www.TradeStation.com . Visit www.TradeStation.com for full details on the costs and fees associated with options.
Margin trading involves risks, and it is important that you fully understand those risks before trading on margin. The Margin Disclosure Statement outlines many of those risks, including that you can lose more funds than you deposit in your margin account; your brokerage firm can force the sale of securities in your account; your brokerage firm can sell your securities without contacting you; and you are not entitled to an extension of time on a margin call. Review the Margin Disclosure Statement at www.TradeStation.com .
TradeStation Securities, Inc. and TradeStation Technologies, Inc. are each wholly owned subsidiaries of TradeStation Group, Inc., both operating, and providing products and services, under the TradeStation brand and trademark. When applying for, or purchasing, accounts, subscriptions, products and services, it is important that you know which company you will be dealing with. Visit www.TradeStation.com for further important information explaining what this means.
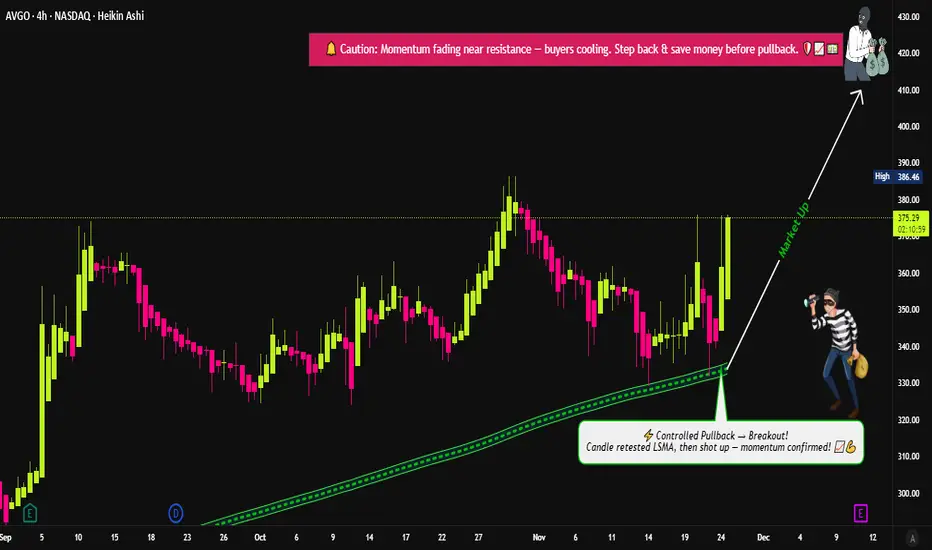
AVGO Cautiously Bullish, but Extended Short-TermAVGO has reclaimed its 50d MA decisively & is riding it upward
After a mild multi-week consolidation, AVGO is breaking out toward prior highs (~$406)
This type of structure (pullback → higher low → reclaim key MA → push toward highs), tends to imply that dip buyers are in control
RSI is rising & sits around the mid-60s, not overbought, but trending strongly
Rising RSI ahead of earnings usually reflects bullish positioning
Stoch is overbought (>90) which often signals short-term exhaustion, not necessarily a reversal, but it does imply that the easy part of the move may already be behind us going into the report
Volume has picked up on green days, suggesting accumulation
No clear signs of distribution into strength
Historically, AVGO tends to run into earnings because it’s seen as a high-quality operator with secular AI-exposure
Breakout attempts near earnings often indicate expectations of a positive guide or at least no negative surprises
Short-term overbought signals could mean the stock is “priced for good news"
If earnings are merely “okay,” the setup allows for a post-earnings shakeout
The stock is sitting near a local resistance shelf, so upside may require a true beat/raise to sustain
Bullish Bias, but vulnerable to sell-the-news
Momentum, structure & accumulation all favor further upside into the event
Because it’s extended on short-term oscillators, any miss or soft commentary could trigger a retrace back toward the 50d (~$370s)
In other words, the trend is up, but the timing (overbought) is tricky
Current options pricing suggests a roughly +/- 6% move in either direction around earnings
In dollar terms (with AVGO near $406), that implies a potential range between ~$382 & ~$430 ($377–$425, depending on exact strike & expiration)
Some more aggressive estimates out of earnings-volatility models go as high as a +/-10% swing (~$365 to $447), though that's more of a “max stress test” than a central expectation
After earnings, the options-market implied volatility (IV) historically drops sharply (the so-called “IV crush”)
For AVGO, average IV contraction post-earnings has been around 19% & that means even if the stock moves in your favor, gains on options may be partially offset by the drop in IV - something to keep in mind if you trade options instead of stock
Implied Move Range) of ~$382-$430 is the “base case” expected range, with more conservative estimates closer to $395-$420
1. Conservative (base-case)
Stock stays near the expected move of $395-$420
In this case it's a likely modest upside or a mild pullback
Risk/reward is relatively balanced with downside maybe slightly larger than upside if market punishes anything less than a strong beat
2. Bullish if earnings impress
Good beat + strong guidance could push toward or exceed the $425-$430
That range would require near-full “realization” of options-market expectations, but is not unrealistic given prior positive earnings reactions & bullish sentiment toward AVGO’s AI/data-center exposure
3. Bearish (“sell-the-news”)
If results disappoint or forward guidance is soft, price could retrace toward $370-$380 (maybe even lower, eventually to 50d MA or support
Because much of the “good news” may already be priced in, downside risk could be nontrivial if expectations aren’t met
Waiting for the first 1-2 days post-earnings may offer a cleaner entry & you might avoid the “volatility junk” to see more “organic” price action
The stock is already fairly “priced for good news”
If the beat is anything less than strong (or forward guidance is conservative), the sell-side could react harshly
Fed interest-rate moves, general market volatility, or weakness in the tech/AI sector could exacerbate downside even if AVGO’s earnings are okay
The “data center/AI infrastructure” theme (a big part of the bullish case) may disappoint if large clients delay orders or macroeconomic headwinds slow demand
NASDAQ:QQQ AMEX:SPY

“AVGO Trading Signal: SHORT | Katy AI Shows Downside MomentumAVGO QuantSignals Katy 1M Prediction 2025-12-08
QuantSignals Katy AI Stock Analysis
Analyzed 1 stock(s): AVGO
AVGO Analysis
Current Price: $401.58
Final Prediction: $397.05 (-1.13%)
30min Target: $397.57 (-1.00%)
Trend: BEARISH
Confidence: 57.5%
Volatility: 16.6%
🎯
TRADE SIGNAL:
Direction: SHORT
Entry: $401.58
Target: $397.96
Stop Loss: $407.60
Expected Move: -1.13%
Summary: Generated 1 trade signals from 1 successful analyses out of 1 symbols.

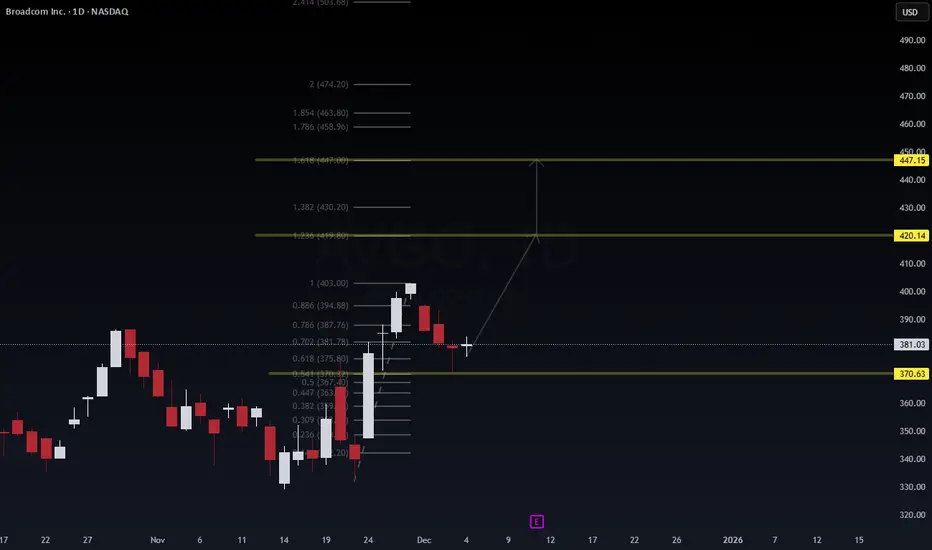
$AVGO — High-Timeframe Liquidity Run Setting UpNASDAQ:AVGO — High-Timeframe Liquidity Run Setting Up 🚀📈
WaverVanir Edge | Quant-Backed View
Price tapped the 0.618 retracement ($375–380 zone) and showed early signs of absorption.
If this level holds, clean imbalance above → magnet at $420.14 (1.236 Fib).
Break + close above $403 triggers the momentum leg.
Ultimate expansion target: $447.15 (1.618 Fib) — the liquidity pocket where HTF algorithms settle.
Risk invalidation: close below $370.63.
Bias: Bullish continuation as long as price respects the golden zone.
📊 VolanX DSS: No trend shift yet — continuation probability intact.
#AVGO #Options #Stocks #Quant #Fibs #WaverVanir
Broadcom Rides the AI Wave, Fueling Nasdaq's AscentSemiconductor titan Broadcom (NASDAQ: AVGO) emerged as a key catalyst driving the Nasdaq Composite significantly higher during a robust trading session for the technology sector. This bullish momentum was fueled by a confluence of positive developments within the artificial intelligence ecosystem, directly benefiting Broadcom's strategic positioning.
The optimism was ignited over the weekend by affirming analyst commentary regarding Alphabet (Google)'s advancements in AI. As a critical supplier of custom networking and AI accelerator chips for Google's data centers, Broadcom stands as a direct beneficiary of the search giant's accelerated investments. This sentiment was further amplified by e-commerce and cloud behemoth Amazon (NASDAQ: AMZN), which unveiled ambitious new plans to commit tens of billions of dollars toward AI infrastructure. Given Broadcom's established role as a supplier for custom silicon solutions, this announcement signals a powerful, forward-looking demand driver for its semiconductor business.
While a segment of the market maintains a prudent long-term perspective, cautiously watching for any potential saturation or deceleration in the torrent of AI capital expenditure, the immediate reaction to concrete, large-scale investment announcements remains overwhelmingly positive. These deals serve as tangible validation of Broadcom's growth trajectory and its entrenched role in the foundational infrastructure of the AI revolution.
Technical Perspective and Price Outlook
From a chart analysis standpoint, Broadcom's technical setup presents a compelling case for continued strength. The stock is demonstrating remarkable resilience, consolidating above a key Fibonacci support level. Specifically, the 0.236 Fibonacci retracement level at approximately $327.85 has acted as a reliable springboard, confirming a strong base of buyer interest at that price point.
This robust foundation, underpinned by powerful fundamental tailwinds, provides a confident outlook for the stock's upward trajectory. Our analysis projects a strong and positive target zone between $400 and $440. Given the potent combination of sector-wide momentum and the company's firm-specific catalysts, we anticipate a high probability that AVGO will challenge and test this target range in the foreseeable future. The confluence of strong fundamentals and a bullish technical structure makes Broadcom a standout contender for continued outperformance.
Is Broadcom Setting Up a Clean LSMA Pullback Entry?📈 Trade Setup: AVGO – Broadcom Inc. (NASDAQ)
Plan: Bullish pullback confirmed with LSMA pullback technique. We're looking for a dip towards an LSMA-supported zone to accumulate in multiple layers — the classic “thief” way.
🎯 Entry Strategy (Layered “Thief” Style)
We’re using a layering strategy — placing multiple limit buy orders to spread risk and optimize the entry:
Entry layers: $340, $350, $360 (you can adjust or add more layers depending on your risk appetite)
This allows you to ladder in as price pulls back, increasing your average position in a disciplined way.
🛑 Stop Loss
Thief SL: $1.11100 — this is your safety net.
⚠️ Note: I strongly recommend using your own stop-loss based on your risk tolerance. Don’t rely solely on mine — it’s your capital, your call.
🎯 Target / Take Profit
Target: $420 — this is where the “police barricade” (strong resistance) sits, plus signs of overbought conditions and a potential trap.
Like with the SL — feel free to scale out, take partial profits, or adjust this target based on your own risk/reward strategy.
🔍 Why This Makes Sense
Price pullback into LSMA can offer a sweet entry for momentum to resume.
Layered entries help you average in slowly rather than committing all at once.
The $420 level is a logical take-profit zone: strong resistance + psychological round number + possible overbought trap.
🌐 Related Instruments / Correlated Pairs to Watch
Keep an eye on these names — they often share semiconductor or tech momentum with Broadcom:
NASDAQ:NVDA (NVIDIA) — major player in GPUs / data center, often drives sentiment in the semiconductor space.
NASDAQ:AMD (Advanced Micro Devices) — competing chipmaker; correlated strength/weakness with Broadcom helps validate sector moves.
NASDAQ:SMH (VanEck Semiconductor ETF) — gives you a broader view of semis; if SMH is bullish, AVGO’s move is more likely to be strong.
NASDAQ:INTC (Intel) — though different business model, macro tech trends sometimes ripple through all major semiconductor names.
Key correlation point: when NVDA or SMH rallies hard, Broadcom often catches a lift (or vice versa), so watching these can help validate the trade or act as confirmation.
⚙️ Risk Management & Execution Tips
Use limit orders for entries — no market buys here, we’re layering smartly.
Adjust your position size on each layer — e.g., more size on the first layer if you're confident, smaller on others.
Consider taking partial profits as price approaches $420 to lock in gains while leaving a portion for a possible breakout.
Disclaimer: This is a thief-style trading strategy just for fun. Use it responsibly, manage your risk, and never trade more than you can afford to lose.
✨ “If you find value in my analysis, a 👍 and 🚀 boost is much appreciated — it helps me share more setups with the community!”
AVGO — [2D] WEEK 49 TREND REPORT | 12/04/2025AVGO — WEEK 49 TREND REPORT | 12/04/2025
Ticker: NASDAQ:AVGO
Timeframe: 2D
This is a reactive structural classification of AVGO based on the weekly chart as of this timestamp. Price conditions are evaluated as they stand — nothing here is predictive or forward-assumptive.
⸻
1) Current Trend Condition [ Numbers to Watch ]
Current Price @ 381
• Trend Duration : +228 Days ( Bullish )
• Weekly Trend Reversal Level ( Bearish ) @ 363.53
• Weekly Trend Reversal Level ( Bearish Confirmation ) @ 322
• Pullback Support @ 320
• Correction Support @ 255
⸻
2) Structure Health
• Retracement Phase:
Uptrend (operating above 78.6%)
• Position Status:
Healthy (price above both structural layers)
⸻
3) Temperature :
Warming Phase
⸻
4) Momentum :
Bullish
⸻
Author’s Note
UPWARD STRUCTURAL ALIGNMENT
This mark reflects a point where market behavior supported the continuation of the existing upward direction. It does not imply forecasting or targets — it simply notes where strength became observable within the current trend. Its meaning holds only while price continues to respect the broader structural levels that define the trend.
⸻
Methodology Overview
This classification framework evaluates directional conditions using internal trend-interpretation logic that references price behavior relative to its structural layers. These relationships are used to identify when price movement aligns with the framework’s criteria for directional phases, transition points, or regime shifts. Visual elements or structural labels reflect these internal interpretations, rather than explicit trading signals or preset indicator crossovers. This framework is observational only and does not imply future outcomes.

Broadcom: The Sleeping Giant Awakens— The New Leader in AIBroadcom is no longer the quiet infrastructure company it used to be.
In 2025, AVGO has transformed into a direct AI compute powerhouse, and the chart is reflecting this shift with powerful clarity.
Chart Reading — AVGO
AVGO has reclaimed its April 7th key angle—the foundational 1-degree / 1-dollar-per-day trendline that defined the entire advance of 2025.
Regaining this angle places the stock back inside places it in a much stronger position especially as it closes into all-time highs and also closing weekly above 400$
The Business Shift Driving the Move
Broadcom is now at the center of the AI boom because:
Google’s TPU/XPU adoption has pushed AVGO into custom AI compute.
Hyperscalers want cheaper, more efficient, in-house AI silicon.
AVGO now controls AI networking + AI compute, not just one layer.
This shift expands Broadcom’s market dramatically and accelerates future earnings. AVGO is no longer just a networking company — it’s now a core AI hardware provider, offering hyperscalers a cheaper, efficient alternative to NVIDIA’s chips. Gemini 3 Pro proved that the world’s most advanced language model doesn’t need to run exclusively on NVDA hardware.
Forecast
AVGO now carries the potential for materially higher prices as the next AI wave unfolds. A clear structural path has unfolded toward $450–$500. Its breakout has already allowed it to outperform both the S&P 500 and the semiconductor sector from the October 28th top to now—a key signal of emerging leadership.
If current momentum holds, Broadcom is positioned not only to participate in the next AI advance, but to lead it, becoming one of the primary drivers of the cycle heading into 2026.

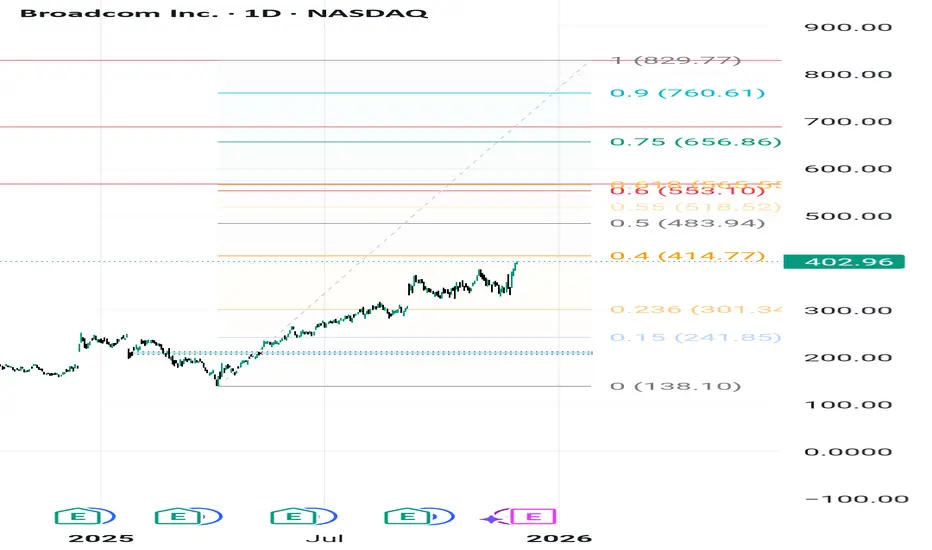
AVGO: Path to $829.77 – Navigating Critical Fibonacci Zones1. Overall Thesis and Price Structure
Broadcom Inc. (AVGO) exhibits a strong underlying bullish trend, fundamentally driven by demand for its AI chips and the successful integration of VMware. The technical objective targets a final high of $829.77. However, the path requires breaking through significant resistance levels defined by the Fibonacci structure. The current price is \mathbf{\$402.96}, maintaining the bullish momentum.
2. Crucial Resistance and Volatility Points
The analysis identifies two critical intermediate targets. The first and most significant hurdle is at $567.10, which aligns closely with the \mathbf{0.618} Fibonacci Golden Ratio. This zone is expected to trigger major volatility, profit-taking, and consolidation. The price action at $567.10 is the key test for trend continuity. Should the price break this level decisively, the next primary resistance target is $688.63, paving the way for the ultimate goal.
3. Key Support and Trend Invalidation
The long-term structural support, or the "Invalidation Point" for the bullish scenario, is the Key Zone at \mathbf{\$206.00}. As long as AVGO trades above this level, the multi-year uptrend remains valid. In the short term, the stock needs to overcome immediate resistance near $414.77 to gather momentum and continue its push towards the intermediate Fibonacci targets.
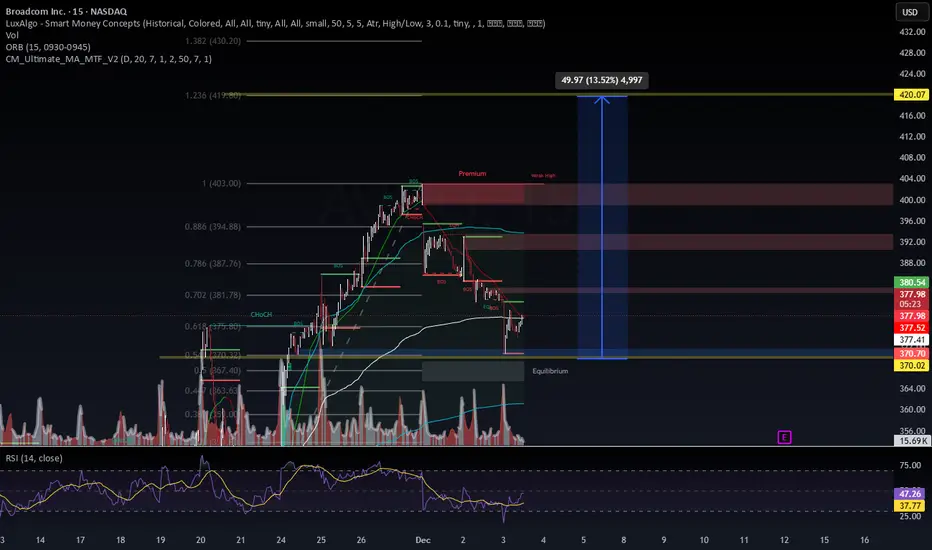
AVGO Earnings Signal Breakdown: High-Risk Binary SetupAVGO Earnings Signal | 2025-12-11
Primary Recommendation: BUY PUTS
Conviction: 55% (Low–Medium)
Reason: Katy AI shows consistent bearish pressure despite composite model suggesting calls.
🧠 Why PUTS? (Key Evidence)
Katy AI Prediction
Predicts 0.5%–1.2% downside into the next session
85% of 420 predictions are below current price
Multiple targets near $400–401
Overbought technicals + bearish intraday momentum
Technical Setup
Current price: $405.5
Daily range: $394–$414 (trading near top)
Stochastics: 95+ (extremely overbought)
Light volume = weak support at highs
Options Flow & IV
PCR: 1.13 → mild put bias
IV: 150–210% → earnings volatility extremely high
OTM puts show unusual activity
💰 Trade Setup
Instrument: AVGO 400 PUT
Expiry: 12/12 (1-day)
Entry: $6.05 – $6.15
Target 1: $9.08
Target 2: $12.10
Stop Loss: $4.84
Position Size: 2% portfolio (high-risk)
Risk Level: 🔴 HIGH
⚠️ Risk Notes
1-day expiry → extreme theta decay
Earnings → binary outcome
Composite model shows CALL, but Katy AI + technicals favor PUT
IV crush will be severe after earnings
📝 Quick Summary
Overbought AVGO + bearish Katy AI + high IV + weak volume → short-term downside probability higher.
PUTS are the asymmetric play, but risk is high.
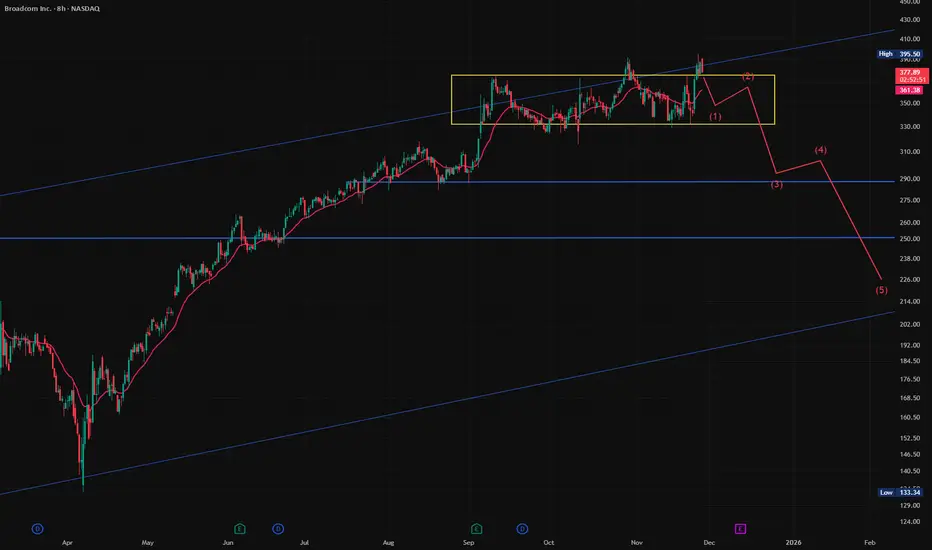
Broadcom (NASDAQ: $AVGO) Rally Faces Earnings TestBroadcom Inc. (NASDAQ: AVGO) enters earnings week after a historic surge, rallying over 180% since April and another 35% following its last earnings beat. Fueled by explosive demand for AI infrastructure, the stock now sits among the top performers in the S&P 500. But with such a steep valuation—42x forward earnings versus its 10-year average of 17x—investors are questioning whether the momentum can continue.
Many analysts remain bullish on Broadcom’s AI exposure. Wall Street expects $1.87 EPS for the fiscal fourth quarter and roughly $17.5 billion in revenue, up sharply from $14.1 billion last year. The AI division remains the crown jewel, projected to generate $6.2 billion this quarter alone, representing a massive 68% YoY increase. Analysts credit Broadcom’s deep involvement in hyperscale computing and its tight integration with Google’s AI ecosystem, especially following the Gemini 3 rollout.
Institutional investors, however, are cautious. Funds like Huntington and Janus Henderson acknowledge Broadcom’s execution but warn that expectations may be excessively high. Last quarter’s rally was driven by Hock Tan’s surprise reveal of a new customer placing $10 billion worth of orders, which pushed the stock to record highs. Without a similar upside catalyst, some analysts fear profit-taking may hit the stock even if earnings meet estimates.
Technical Analysis
On the chart, AVGO recently broke above a major multi-month resistance zone around $385, flipping it into support. The price is trending above the 9-period SMA, showing strong momentum. A sustained hold above $400 opens the path toward the next psychological zone around $450–$500, where the next round of profit-taking may occur.
If sentiment turns risk-off, a retracement back to the $385 demand zone remains likely. For now, structure favors continuation as long as the breakout holds.

AVGO Pre-Earnings Call Setup: High-Conviction Bullish Play Amid AVGO Earnings Signal | 2025-12-10
Trade Setup:
Direction: BUY CALLS (LONG)
Confidence: 65% (Medium)
Expiry: 2025-12-12 (2 days)
Strike: $407.50
Entry Price: $13.40
Target 1: $20.10 (50% gain)
Target 2: $26.80 (100% gain)
Stop Loss: $8.04 (40% loss)
Position Size: 3% of portfolio (reduced due to Katy conflict)
Price & Trend:
Current Price: $406.32
24h Move: +3.98%
Trend: Bullish (Composite score +3.2)
Volatility: 117.5% IV
Overbought Level: Stochastics 96.2
Analysis Summary:
Katy AI Signal: Neutral with slight bearish bias (-0.76% predicted move), 50% confidence
Technical: Strong pre-earnings rally, multi-timeframe bullish confirmation (100%)
News: Positive catalysts – new private cloud tech, AI chip demand momentum
Options Flow: Bearish PCR 1.44 (institutional hedging), retail call activity present
Risk Level: Medium-High – high IV, Katy conflict, overbought conditions
Key Notes:
Monitor earnings release closely
Conservative sizing recommended due to Katy AI conflict
Tight stop loss essential to manage potential pullback

AVGO BEFORE EARNINGS - DIC 2025AVGO near 2.5B dist at 375; support 360/340.
Upside tgt 430, downside gap 300-290.
#AVGO #NASDAQ #SPY #QQQ #SMH #SOXX

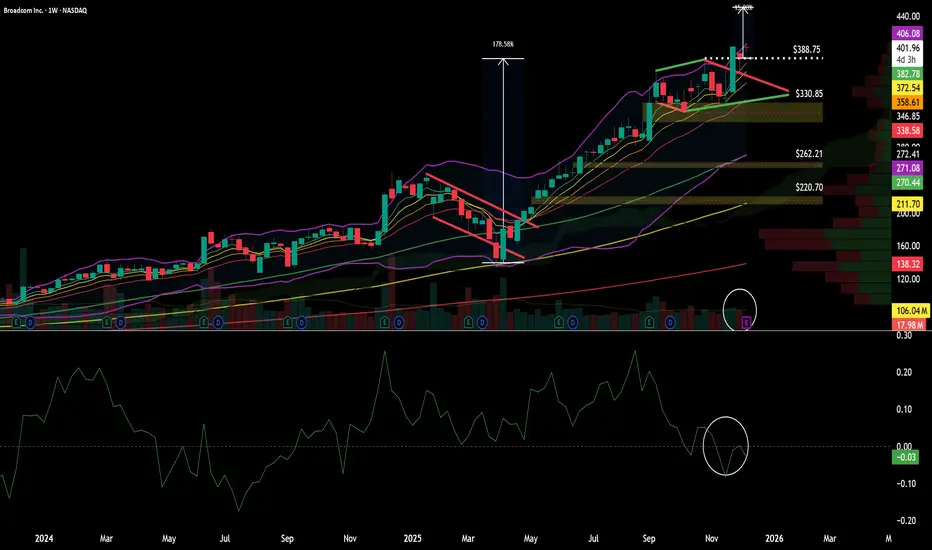
$AVGO Secular Bull Structure, Pennant Breakout & Measured MoveBroadcom continues to trade as one of the strongest structural leaders inside this secular bull market. From the “Liberation Day” inflection point, price is now up roughly +178%, with trend structure remaining firmly intact across the higher timeframes. Throughout this entire advance, NASDAQ:AVGO has displayed classic institutional trend behavior — persistent EMA support, shallow pullbacks, and clean continuation structures.
From a moving average perspective, this rally has been textbook. During the entire impulse phase, price has mostly remained compressed within the 5 and 8-day EMAs, rarely giving up the 13-day EMA, which confirms strong momentum preservation. This type of behavior is typical of sustained institutional accumulation phases rather than late-stage retail blow-offs.
Earlier in the year, price briefly lost the lower boundary of its prior flag structure in April. That breakdown proved to be a bear trap, with price finding clean support at the 100-day MA before resuming trend higher. That reaction confirmed the broader bull structure was never damaged — it was merely being reset.
Fair Value Gaps & Internal Market Structure
This advance has also left behind multiple Fair Value Gaps (FVGs) during its strongest expansion phases, reinforcing the strength and imbalance created by aggressive buying. Two of these FVGs remain unfilled, which keeps the broader trend biased higher, but also reminds us where price could naturally gravitate if a deeper corrective phase eventually develops.
Pennant Formation & Breakout Characteristics
Since early September, NASDAQ:AVGO entered a period of controlled digestion, carving out a 12-week bull pennant. This structure formed after an impulsive upside leg and reflects healthy consolidation rather than distribution.
Two weeks ago, price broke out of this pennant with a Marubozu candle, signalling decisive institutional participation and thrust to fresh all-time highs. The candle that followed performed an important technical validation — it retested the top of the breakout structure and successfully closed above the prior ATH, confirming acceptance at higher prices.
Structurally, this is exactly what you want to see after a continuation breakout: expansion → retest → acceptance.
Momentum & Volume Warning Signals
Despite the clean structural breakout, short-term momentum is now showing early signs of fatigue. The Chaikin Money Flow (CMF) has slipped back below the zero line, and breakout volume failed to expand meaningfully compared with earlier impulse phases. This does not invalidate the bull trend, but it does temper near-term expectations and suggests price may need additional digestion before another strong leg higher can unfold.
This sets up a classic scenario where price can remain elevated while momentum rebuilds, rather than an immediate acceleration higher.
Measured Move Analysis & Targets
A traditional 1:1 projection of the prior flagpole would imply a ~65% upside extension, targeting the $637–$638 zone. However, given the current momentum profile and volume behavior, that projection appears structurally valid but tactically premature in the short term.
A more realistic and technically grounded near-term objective comes from a 1:1 measured move of the bull pennant itself, which projects to approximately $450. This target aligns better with the current rate of expansion and avoids overstretch risk.
Key Technical Zones
Immediate structure remains supported above the prior breakout region near $388–390, with deeper structural supports stepping in around:
$330–332 (trend base / structure)
$262 (prior FVG / higher-timeframe equilibrium)
$220 (major weekly support / regime-level demand)
As long as price holds above these higher supports on a weekly closing basis, the broader secular uptrend remains fully intact.
Fundamental Backdrop
Broadcom continues to reinforce its technical strength with exceptional earnings consistency. The company has not missed an earnings print since 2020, which provides a powerful fundamental tailwind beneath this multi-year technical structure.
Summary
NASDAQ:AVGO remains one of the cleanest examples of a secular bull trend in motion — supported by EMA compression, recurring continuation structures, clean pennant behavior, and strong earnings consistency. While momentum has cooled slightly following the most recent breakout, the higher-timeframe structure remains firmly bullish.
Near-term, the $450 pennant projection serves as the most realistic upside objective, while the larger $630+ flagpole projection remains a longer-cycle potential if momentum fully rebuilds.
AVGO: Going Higherdid a perfect 0.618 retracement. If this level holds, we will see 1.68 extension in this monster of a stock. Already up 100% ytd.

$AVGO — Coiled Setup While Everyone’s “Seeing All Red”NASDAQ:AVGO — Coiled Setup While Everyone’s “Seeing All Red”
Market sentiment is red, but AVGO is quietly forming a compressed reversal structure.
Key Levels & Structure
Demand base: 375–376 (holding clean)
Trendline break zone: 382–385
Major upside magnet: 420.14
Compression wedge + flattening MA = energy build-up.
Why This Matters
The selloff slowed right at a high-confluence Fib/structure cluster.
When everyone sees red, VolanX watches for reversal displacement.
Edge Outlook
Break & hold above 382–385 → momentum shift
First target: 394.88
Main target: 420.14
Failure of 375 → invalidates setup
This is a patience trade — not chasing, just waiting for the snap.
AVGO at a Critical Breakout: AI Boom or Pullback Ahead?Bullish Scenario (Breakout Above Channel)
Entry:
• Valid breakout above $405–410
• Preferably a daily close above the channel top
Targets:
1. Target 1: $430
2. Target 2: $455–460 (main target)
Stop Loss:
• $395
(If price falls back below the broken resistance)
Bearish Scenario (Rejection From Channel Top)
Entry:
• Bearish rejection at the upper channel
• Confirmation through reversal candles
Targets:
1. Target 1: $380 (midline)
2. Target 2: $350–355 (bottom of channel)
Stop Loss:
• $408–412
(Above the channel top and wick of rejection)

$AVGO a multi year channel overshoot is statistically bearishI have re-entered this NASDAQ:AVGO short. Odds are still 75% the yellow box will break to the downside eventually (a multi year channel line overshoot historically only has a 25% of succes)
This week is a seasonal Thanksgiving bullish week with strong news from Google, probably won't happen again next week.
Is Silicon's Silent Giant Rewriting the Rules of AI?Broadcom has emerged as a critical, yet understated, architect of the artificial intelligence revolution. While consumer-facing AI applications dominate headlines, Broadcom operates in the infrastructure layer, designing custom chips, controlling networking technology, and managing enterprise cloud platforms. The company maintains a 75% market share in custom AI accelerators, partnering exclusively with Google on their Tensor Processing Units (TPUs) and recently securing a major deal with OpenAI. This positioning as the "arms dealer" of AI has propelled Broadcom to a $1.78 trillion valuation, making it one of the world's most valuable semiconductor companies.
The company's strategy rests on three pillars: custom silicon dominance through its XPU platform, private cloud control via the VMware acquisition, and aggressive financial engineering. Broadcom's technical expertise in critical areas like SerDes technology and advanced chip packaging creates formidable barriers to competition. Their Ironwood TPU v7, designed for Google, delivers exceptional performance through innovations in liquid cooling, massive HBM3e memory capacity, and high-speed optical interconnects that allow thousands of chips to function as a unified system. This vertical integration from silicon design to enterprise software creates a diversified revenue model resistant to market volatility.
However, Broadcom faces significant risks. The company's dependence on Taiwan Semiconductor Manufacturing Company (TSMC) for production creates geopolitical vulnerability, particularly given rising tensions in the Taiwan Strait. U.S.-China trade restrictions have compressed certain markets, though sanctions have also consolidated demand among compliant vendors. Additionally, Broadcom carries over $70 billion in debt from the VMware acquisition, requiring aggressive deleveraging despite strong cash flows. The company's controversial shift to subscription-based pricing for VMware, while financially successful, has generated customer friction.
Looking ahead, Broadcom appears well-positioned for the continued AI infrastructure buildout through 2030. The shift toward inference workloads and "agentic" AI systems favors application-specific integrated circuits (ASICs) over general-purpose GPUs Broadcom's core strength. The company's patent portfolio provides both offensive licensing revenue and defensive protection for partners. Under CEO Hock Tan's disciplined leadership, Broadcom has demonstrated ruthless operational efficiency, focusing exclusively on the highest-value enterprise customers while divesting non-core assets. As AI deployment accelerates and enterprises embrace private cloud architectures, Broadcom's unique position spanning custom silicon, networking infrastructure, and virtualization software establishes it as an essential, if largely invisible, enabler of the AI era.
Breaking: Broadcom Inc. (AVGO) Surged 11% Yesterday Eyeing $500 Broadcom Inc. (NASDAQ; NASDAQ:AVGO ) shares saw a noteworthy uptick of 11% in extended market trading further extending the gains to todays premarket session up by 2.34%.
Should the stock break the ceiling of the $388 resistant zone, coupled with the RSI at 61, a bullish move to the $500 resistant is feasible and possibly $700 before the year runs out.
Similarly, failure to pull that stunt from NASDAQ:AVGO might resort to a move to the $250 support point.
With earnings slated for December 11th, 2025, In 2024, Broadcom's revenue was $51.57 billion, an increase of 43.99% compared to the previous year's $35.82 billion. Earnings were $5.90 billion, a decrease of -58.14%.
Analyst Summary
According to 28 analysts, the average rating for AVGO stock is "Strong Buy." The 12-month stock price target is $353.86, which is a decrease of -6.38% from the latest price.
About AVGO
Broadcom Inc. designs, develops, and supplies various semiconductor devices and infrastructure software solutions worldwide. The company operates in two segments, Semiconductor Solutions and Infrastructure Software. It provides Ethernet switching and routing custom silicon solutions, optical and copper physical layer devices, and fiber optic transmitter and receiver components; set-top box system-on-chips (SoCs), data over cable service interface specifications cable modem and networking infrastructure.