BABA ending a very clean Wyckoff Acumulation schematic here?As the title says. Appears to be a very clean accumulation schematic. Currently in the SOS area. Consolidation could continue for months here. Timing is hard, let's see what happens over the next weeks and months.
Trade ideas

Alibaba - Here we have the final bottom!🏮Alibaba ( NYSE:BABA ) finally created its bottom:
🔎Analysis summary:
As we are speaking, Alibaba finally managed to create a long term bottom formation. Specifically with the recent bullish break and retest, bulls are picking up momentum. We just have to see a break above the current key resistance level in the foreseeable future!
📝Levels to watch:
$140
SwingTraderPhil
SwingTrading.Simplified. | Investing.Simplified. | #LONGTERMVISION

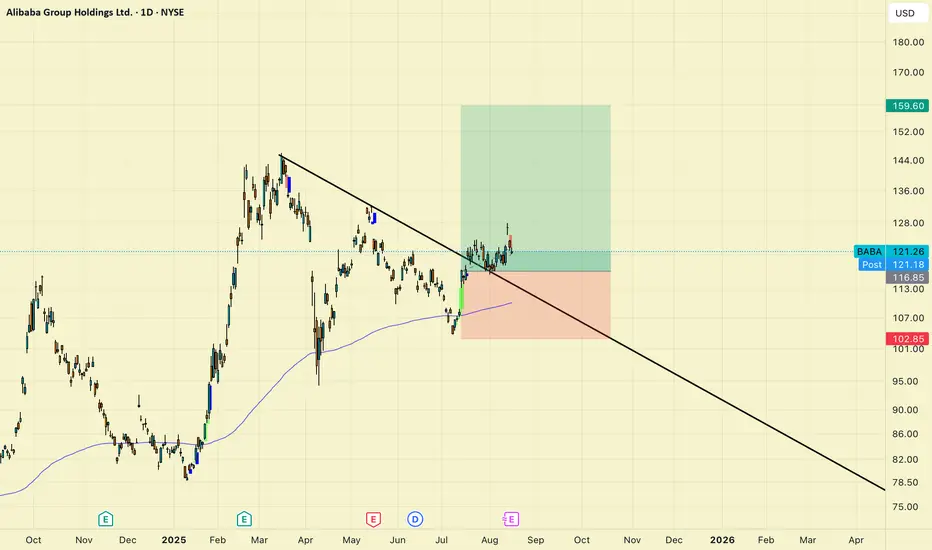
BABA Alibaba Group Holding Limited Options Ahead of EarningsIf you haven`t bought the dip on BABA:
Now analyzing the options chain and the chart patterns of BABA Alibaba Group Holding Limited prior to the earnings report this week,
I would consider purchasing the 135usd strike price Calls with
an expiration date of 2025-9-19,
for a premium of approximately $14.25.
If these options prove to be profitable prior to the earnings release, I would sell at least half of them.

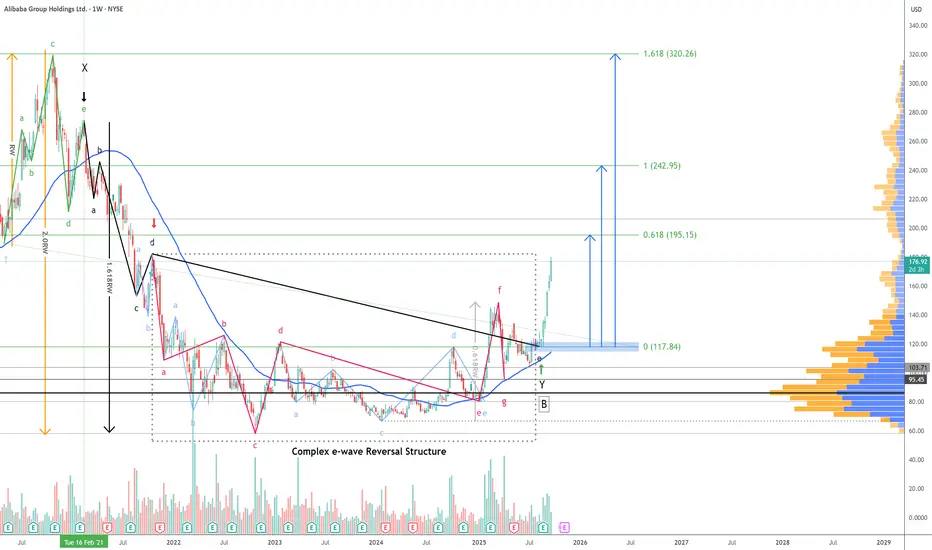
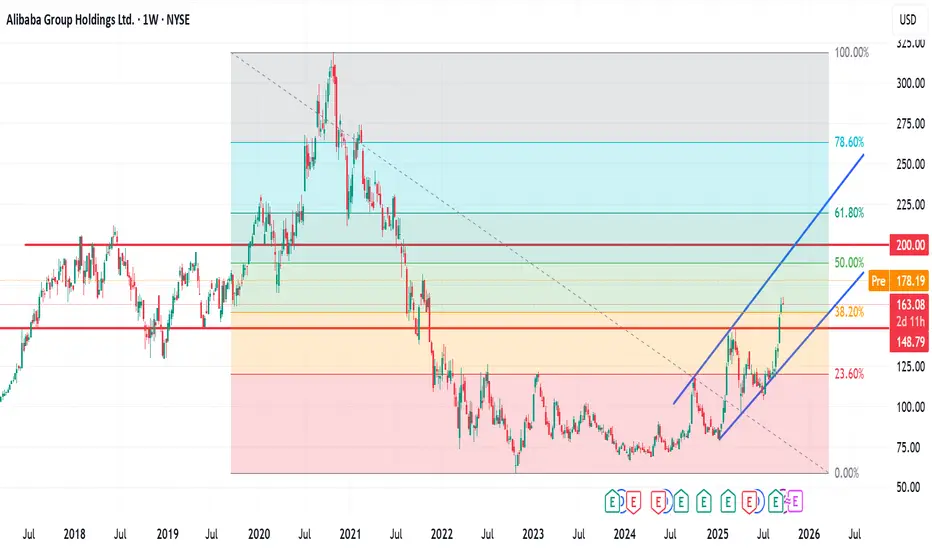
$BABA - Structure Confirmed, Targets In Motion - 9/24/2025Back in February, we discussed how NYSE:BABA was approaching the final stages of a reversal pattern. That call has now been confirmed with the structure concluding at $117. What followed was nothing short of explosive—a 51% upswing rally that’s currently unfolding with strong momentum. 📈
Note: The stock bounced twice off the 50-week moving average, signaling strong support as the correction neared its end.
The chart highlights the projected targets for this new rally, and for transparency and educational value, the internal wave structure and labeling have been intentionally left visible. This is especially insightful for traders exploring Modern Trading Algorithms and their structural variations.
Let the rally do the talking! 📊. 🚀
Happy Trading!
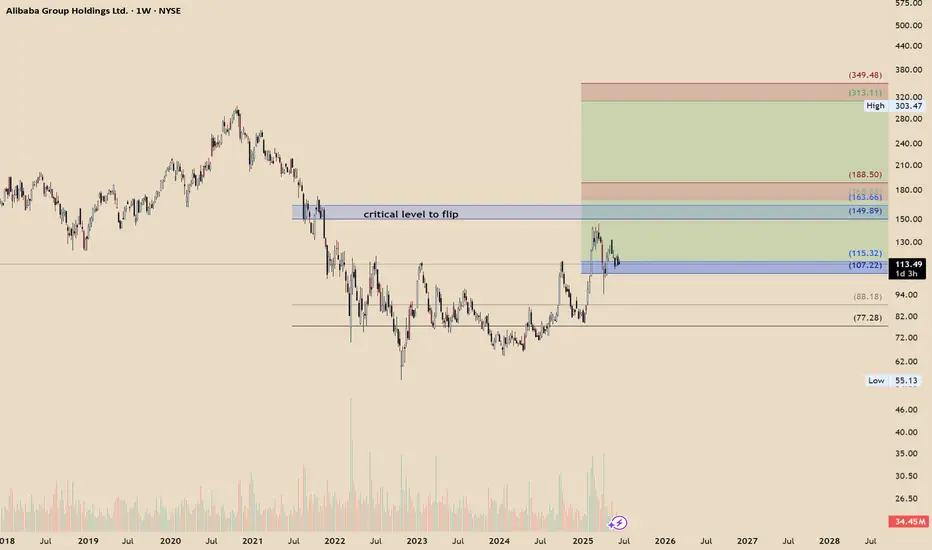
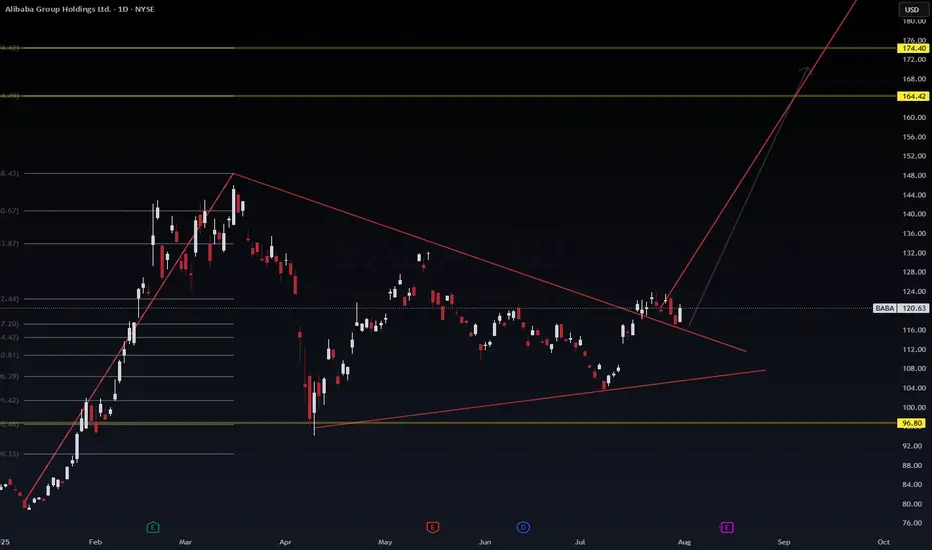
BABA undervaluedHello
BABA has invalidated any corrective attempts due to its price action — a 3-month bullish breaker is in play, and the price has yet to test the first level of algorithmic targets around 163–168.
There’s also a critical level to flip near 149, and I’m fairly confident it will be reclaimed if market conditions permit.
NFA
Short-Term Bear, Long-Term Bull: BABA Short-Term Bearish Case
The short-term outlook carries cautionary signals primarily due to technical factors and current macroeconomic risks:
Overbought Technical Signals: The stock's recent strong rise has pushed the Relative Strength Index (RSI) to high levels (e.g., above 70 in one short-term analysis), which can signal that the stock is overbought and may be due for a short-term pullback or consolidation.
Risk of Pullback: A sell signal has been noted from a recent pivot top, and the stock is trading in the upper part of its strong short-term rising trend, which some short-term traders may view as a selling opportunity before a reaction back towards support levels.
Macroeconomic and Geopolitical Headwinds: The stock remains sensitive to China's consumer cycle, which is in an uneven recovery, and execution risks on new strategic plans could prompt caution from the market. Geopolitical tensions and evolving regulations also continue to be an overhang.
Long-Term Bullish Case
The long-term case is overwhelmingly bullish, supported by strong analyst consensus, strategic investments, and fundamental valuation:
Strong Analyst Confidence and Price Targets: The vast majority of analysts rate BABA a "Strong Buy" or "Buy". The average 12-month price target from multiple Wall Street analysts is approximately $164.64 to $169.32.
Significant Investment in AI and Cloud: Alibaba's strategic priority is shifting toward AI and efficiency.
The company has announced a large investment plan, committing over $53 billion to enhance AI and cloud infrastructure over three years.
Alibaba Cloud is a rapidly growing market, and its division is reportedly turning profitable, which is seen as a major long-term tailwind.
Positive sentiment surrounds its Qwen 2.5-Max AI model and confirmed AI partnership with Apple for iPhones in China.
Compelling Valuation and Free Cash Flow (FCF): The company is characterized as a cash-rich, free-cash-flow compounder. Revenue and free cash flow are forecast to expand significantly through fiscal 2030.
Market Leadership and Diversification: Alibaba is a global e-commerce leader with diversified operations. Its ecosystem integrates e-commerce, cloud computing, digital media, and entertainment, supported by a large user base.
Technical Bottom and Growth Trajectory: Technical analyses suggest the stock has created a long-term bottom formation and is poised to resume its growth trajectory, with some long-term views anticipating a return to previous highs.
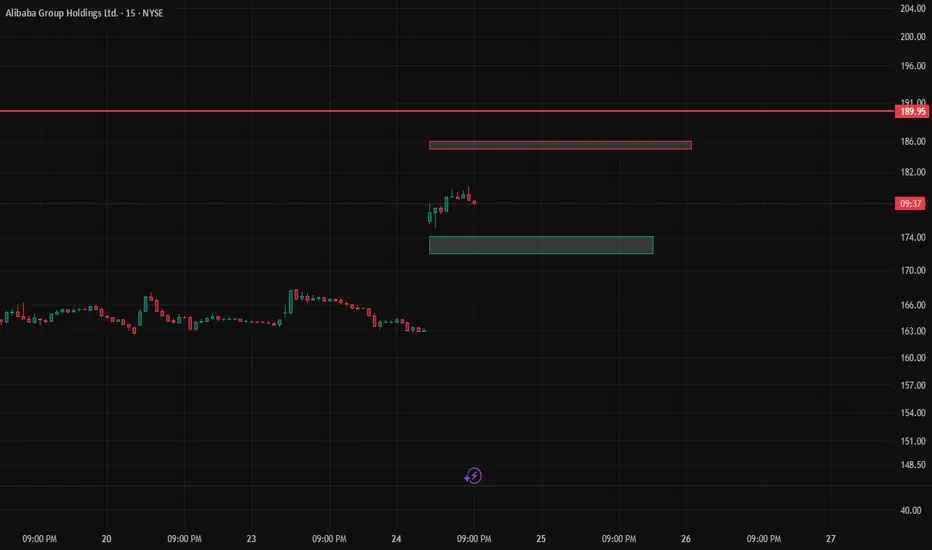
Trade Idea:
Entry Point (Short) At or near $183.90 (Red Arrow) The red arrow indicates a resistance/reversal point near the upper boundary of the channel/trend line.
Exit/Target Price At or near $159.69 (Green Arrow) The green arrow indicates a support level, which would be the target for this short-term pullback.

“BABA’s 10% Surge: Institutional Override or Retail FOMO?”Date: 24th September 2025
Time: 09:00 PM IST
🔹 Fundamental News
Alibaba (BABA) soared +10% intraday after reports of structural reforms and government-backed stimulus supporting Chinese tech giants. Positive earnings whisper + buyback speculation added fuel.
🔹 Public Sentiment & Behavior
Retail: Chasing the gap, heavy FOMO entries near 180.
Institutions: Smart money accumulated in the 160–165 zone last week, distributing partial at resistance.
Social Signal: Headlines scream “Tech Recovery!”, but structure shows override-driven breakout rather than organic rescue.
🔹 Current Structure
Macro :
Resistance: 185–190
Support: 160–162
Micro :
Resistance: 180 barrier zone tested.
Support: 172.5–174.2 micro floor.
Behavior: Controlled pullback already attempted; override path extended momentum.
🔹 Projection
Primary Path (65%): Pullback to 174–175 → continuation toward 185–190.
Alternate Path (25%): Breakdown under 172.5 → collapse back to 165–167.
Low Path (10%): Direct extension above 190 → only with follow-through sentiment surge.
🔹 Pullback Levels
Shallow: 175–176.2
Medium: 172.5–174.2
Deep: 165–167 (rescue-driven)
🔹 Final View
Bias: Bullish Override confirmed. Path remains higher unless 172.5 breaks. Macro structure supports 185–190.
🔹 Essence
“Market isn’t running on retail FOMO, but on institutional override. Pullbacks are reloads, not rescues. Unless 172.5 breaks, bulls hold the throne.”
⚠️ Disclaimer: This analysis is for educational and research purposes only. Not financial advice. Market decisions are your sole responsibility.
BABA: We have a bounce but is it temporary? Too many questions but dss forecasts a price growth near-term on ticker symbol $BABA. We will see where it goes. Another one on the watch is NASDAQ:PDD
$190 -$200 a possible level for BABA$190 -$200 a possible level for BABA.
I woke up to the news of possible collaboration between Alibaba and Nvidia AI collaboration.
With the AI demand and this news, I think the fundamental is great.
Technically, I will be looking at BABA pushing towards $190 zone, or to a psychological level of $200.
Remail positive and trade with care
BABA – Dollar Cost Averaging Opportunityhi Traders,
Let's have a look at BABA.
Alibaba (BABA) appears to be approaching the end of its correction phase within a well-defined ascending channel. Based on the current price action and technical setup, we believe now is a good time to begin dollar cost averaging into this stock.
Our identified buy zone lies between $108 and $100, where price intersects the lower trendline support and key EMAs (20/50/100/200). This area offers a strong risk-reward setup for medium- and long-term investors.
The mid-term target for this trade is $160, which aligns with the upper channel resistance and previous price structure. However, from a long-term perspective, we anticipate that BABA will resume its growth trajectory and eventually surpass its previous all-time highs.
Supporting this idea, the RSI is stabilizing in neutral territory, suggesting that momentum is resetting and may shift bullish as price finds support.
Summary:
🔁 Strategy: Dollar cost averaging
🟩 Buy zone: $108 – $100
🎯 Mid-term target: $160
🚀 Long-term view: Return to growth and new ATH
📉 Correction nearing completion; bullish structure remains intact
This setup offers an attractive entry point for patient investors aiming to ride the next major upside cycle in Alibaba.

Bullish pennant on the hourlyAfter a huge rally on alibaba it is not over yet, hedgefunds are rising price targets and alibaba is currently forming a bullish pennant on the hourly time frame getting close to breakout

BABA BUY OPPORTUNITYBABA has broken out of a bullish triangle, supported by strong growth in AI , cloud business and renewed analyst optimism after earnings. With positive sentiment building around Chinese tech and AI, the breakout has momentum to continue higher.
Fasten Your Seat BeltThe chart indicates a potential "triple bottom" pattern forming, which is a bullish technical pattern in stock analysis. The analyst has marked three key points (labeled 1, 2, and 3) that form this pattern.
The chart includes several notable elements:
A price downtrend from October through December 2024
Three similar low points that could constitute the triple bottom pattern
A bullish projection shown by green dots suggesting potential upward movement
Text saying "Fasten your seat belt!" suggesting the analyst anticipates significant movement
Current price metrics showing the stock at around $84-85 range
The performance metrics shown in the top right indicate:
5.27% gain in 1 week
-1.5% change in 1 month
-17.03% change in 3 months
It's important to note that while technical patterns can be useful indicators, they don't guarantee future price movement. Any investment decisions should be made based on comprehensive research including fundamental analysis and overall market conditions.

Alibaba | BABA | Long at $108.84Like Amazon, I suspect AI and robotics will enhance Alibaba's NYSE:BABA e-commerce, logistics, and cloud computing operations. There is some risk here, like other Chinese stocks, that they could be delisted from the US market if trade/war tensions rise. But I just don't think that is likely (no matter the threats) due to the importance of worldwide trade and investment. I could be way wrong, though...
NYSE:BABA has a current P/E of 14.2x and a forward P/E of 2x, which indicates strong earnings growth ahead. The company is very healthy, with a debt-to-equity of 0.2x, Altmans Z Score of 3.3, and a Quick Ratio of 1.5. If this were a US stock, investors would have piled in long ago at the current price.
From a technical analysis perspective, the historical simple moving average (SMA) band has started to reverse trend (now upward), indicating a high potential for continued (overall) price movement up. It is possible, however, that the price may reenter the SMA band in the near-term - the $80s aren't out of the question - as tariff threats arise. But that area is another personal entry zone if fundamentals hold.
Thus, while it could be a bumpy ride and the risk is there for delisting, NYSE:BABA is in a personal buy zone at $108.84 (with known risk of drop to the $80s in the near-term).
Targets into 2028:
$125.00 (+14.8%)
$160.00 (+47.0%)

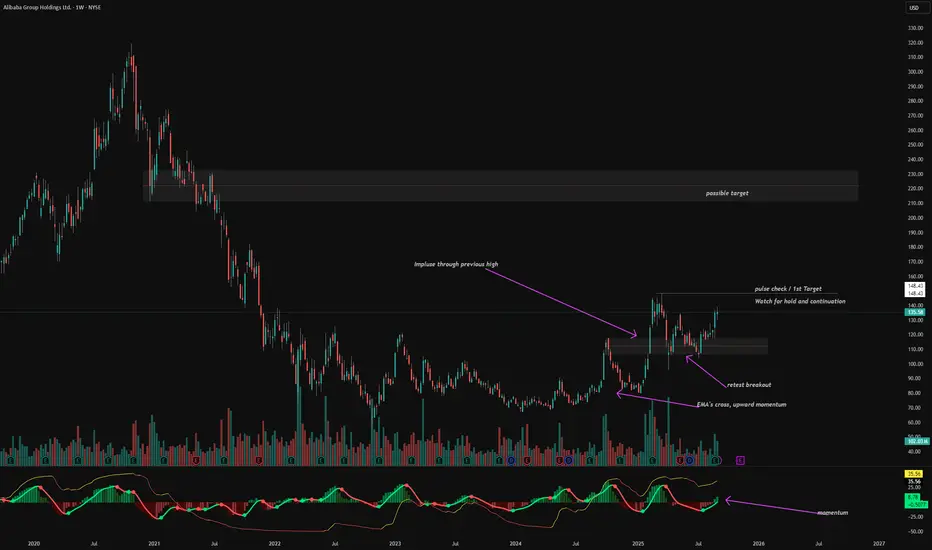
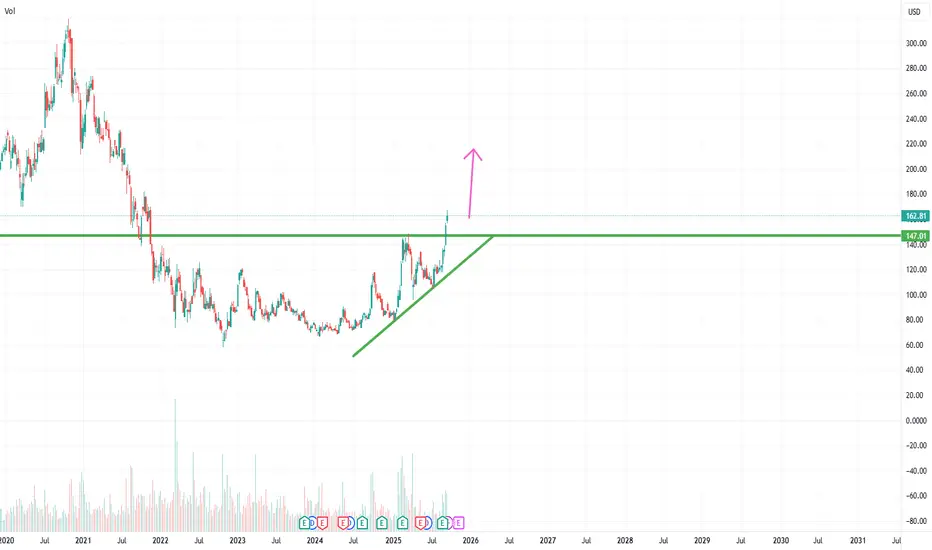
Alibaba Wave Analysis – 16 September 2025- Alibaba broke key resistance level 147.70
- Likely to rise to resistance level 170.00
Alibaba Group has been rising sharply in the last few trading sessions after the earlier breakout of the key resistance level 147.70 (which stopped the previous wave (A) in the middle of March, as can be seen below).
The breakout of the resistance level 147.70 was preceded by the breakout of the 2 daily up channels from July and April - which accelerated the active impulse wave (C).
Given the strong daily uptrend, Alibaba Group can be expected to rise to the next round resistance level 170.00, the target for the completion of the active impulse wave (C).
Looks bullish to me…If they crush earnings we could have a pretty nice sized break out. Im long for earnings. Boom or Bust…
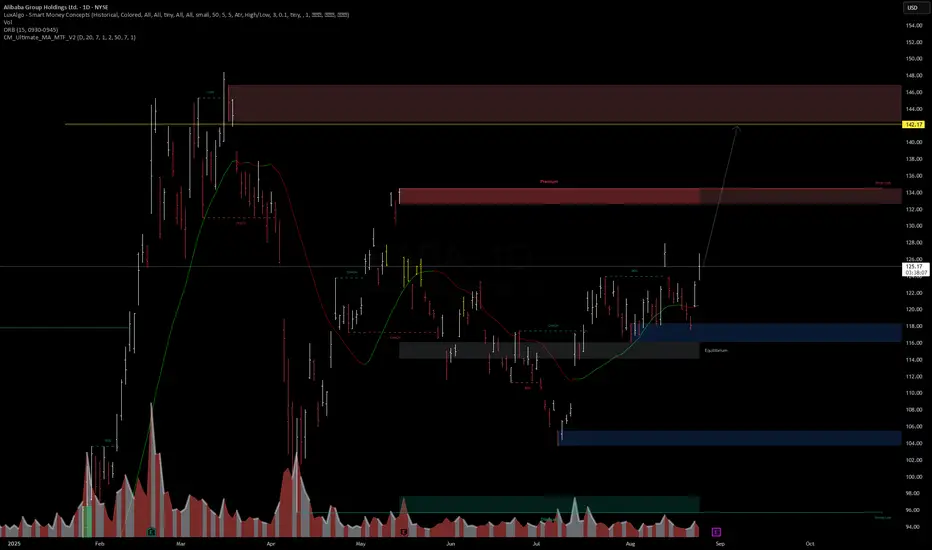
Alibaba (BABA) – Breakout in Progress? ER Bullish? 📊 Alibaba (BABA) – Breakout in Progress
After weeks of consolidation, BABA has broken above the 122–124 zone with strong volume confirmation. This move sets the stage for a liquidity sweep higher.
🔹 Key Levels
Support: 118–116 (Equilibrium), 106 (Major Demand)
Resistance: 132–134 (Premium zone), 142.17 (Liquidity pool)
🔹 Bias: Bullish continuation as long as price holds above 118.
🔹 Targets
TP1: 132–134
TP2: 142+
🔹 Macro Context
China’s easing stance, tech-sector rotation, and institutional flows support upside momentum. However, earnings and geopolitical risks remain key catalysts to monitor.
✅ Execution Plan (WaverVanir DSS)
Buy dips into 118–121
Scale out partial at 132
Final target at 142
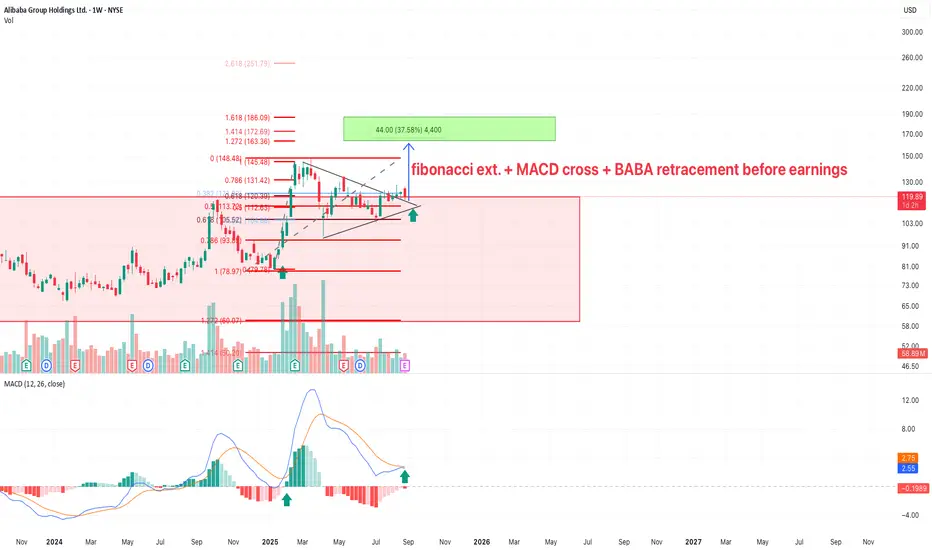
A Great and Clear Idea For AlibabaKEY POINTS (Why this idea stands out):
Bullish Symmetrical Triangle → The breakout has already happened, and the price has successfully retested the triangle trendline — a strong confirmation of bullish continuation.
Fibonacci Retracement → Confirms healthy pullback levels, showing the market structure is intact and technically strong.
Fibonacci Extension aligned with Triangle Take Profit → Rare confluence that significantly increases the probability of hitting the target.
MACD Bullish Crossover → Momentum indicator is turning positive, further validating the bullish setup and supporting upside continuation.
📊 This is a pure and clear Murphy-style Technical Analysis, based exclusively on objective chart signals.
Why Alibaba (like JD.com) is the right choice now:
Deeply undervalued: Current market price does not reflect Alibaba’s real business strength.
Pre-earnings tech opportunity: Chinese tech stocks historically experience strong price action ahead of earnings.
Perfect technical + fundamental alignment: Breakout confirmation, Fibonacci confluence, and bullish momentum (MACD) combine with undervaluation to create a high-probability setup.
⚠️ Main Risk Factor:
U.S. financial media often manipulates sentiment on Chinese equities with aggressive negative campaigns (Zacks, Dow Jones News, Alpha News).
✅ Solution: Filter out the noise and rely on neutral, fact-based outlets like Reuters.]
BABA 1D Time frame📊 Market Snapshot
Current Price: Around $146–147
Recent Trend: Strong upward momentum over the past weeks
Overall Technical Bias: Bullish, but nearing overbought
🔎 Technical Indicators
RSI (14-day): ~75 → Overbought zone, signals strong momentum but also risk of pullback.
MACD: Positive → Momentum remains bullish.
Stochastic & CCI: High readings → Also showing overbought conditions.
📈 Moving Averages
5-day MA: ~$146 → Bullish short-term support
10-day MA: ~$145 → Still bullish
20-day MA: ~$140 → Strong base level
50-day MA: ~$137 → Medium-term support
100-day MA: ~$130 → Long-term support
200-day MA: ~$125 → Major long-term support
All major moving averages are aligned bullishly.
🔧 Support & Resistance
Support Zone: ~$145–146
Resistance Zone: ~$147–150 (immediate), with potential toward $160 if breakout continues
📅 Outlook
Bullish Case: If price holds above ~$147, it could target $150+ and possibly $160.
Bearish Case: Overbought readings may trigger a pullback toward $145 or even $140.
Overall Bias: Bullish trend intact, but short-term consolidation or mild correction is possible.

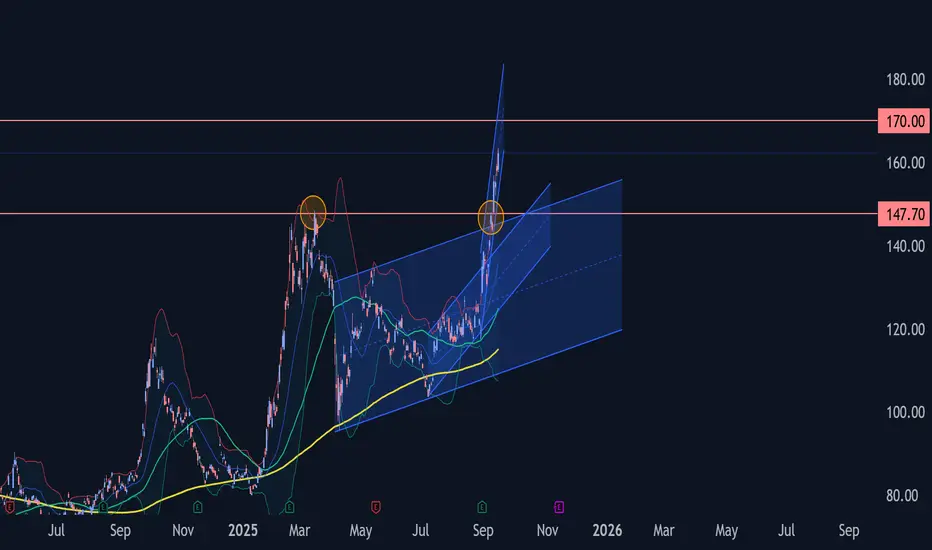
BABA 3Hour Time frameBABA 3-Hour Snapshot
Current Price: $147.10
Change: +4.18% from the previous close
Market Cap: $347.34 billion
P/E Ratio: 16.47
EPS (TTM): $8.84
Beta: 0.54
Dividend Yield: 0.73%
🔎 Key Levels
Resistance:
R1: $148.50 (prior high and Fibonacci cluster)
R2: $157.80 (Fibonacci 0.382 retracement)
Support:
S1: $135.00 (recent breakout level)
S2: $130.00 (next support level)
📈 Technical Indicators
RSI (14): 62.82 — Neutral
MACD: 4.08 — Bullish momentum
Moving Averages:
5-period SMA: $135.30 — Buy signal
10-period SMA: $128.98 — Buy signal
20-period SMA: $125.03 — Buy signal
50-period SMA: $119.26 — Buy signal
📌 Market Sentiment
Catalyst: Shares surged ~13% following a favorable court ruling, marking the highest close since March 2025.
Sector Performance: Positive momentum in the Chinese tech sector, with Alibaba leading gains.
Analyst Outlook: Average 12-month price target of $167.17, indicating a 13.64% upside from current levels.
StockAnalysis
📅 Outlook
Bullish Scenario: A breakout above $148.50 could lead to a push toward $157.80 and higher.
Bearish Scenario: A drop below $135.00 may test support around $130.00.
Overall Bias: Moderately bullish, with positive momentum but facing near-term resistance.

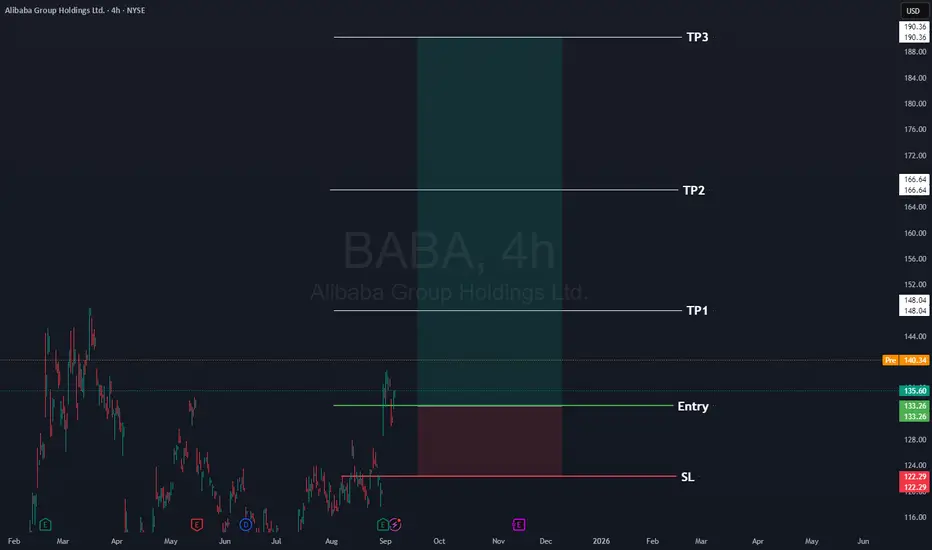
Alibaba Long $BABAHere's a free stock signal for you. Occasionally we like to give a free signal. This was posted to our subscribers
Stock: Alibaba
Stock Code NYSE:BABA
📈Entry: 133.26
⚠️SL: 122.29
✔️TP1: 148.04
✔️TP2: 166.64
✔️TP3: 190.36
Hope you earn lots of money
Sarah
CEO ETAforex
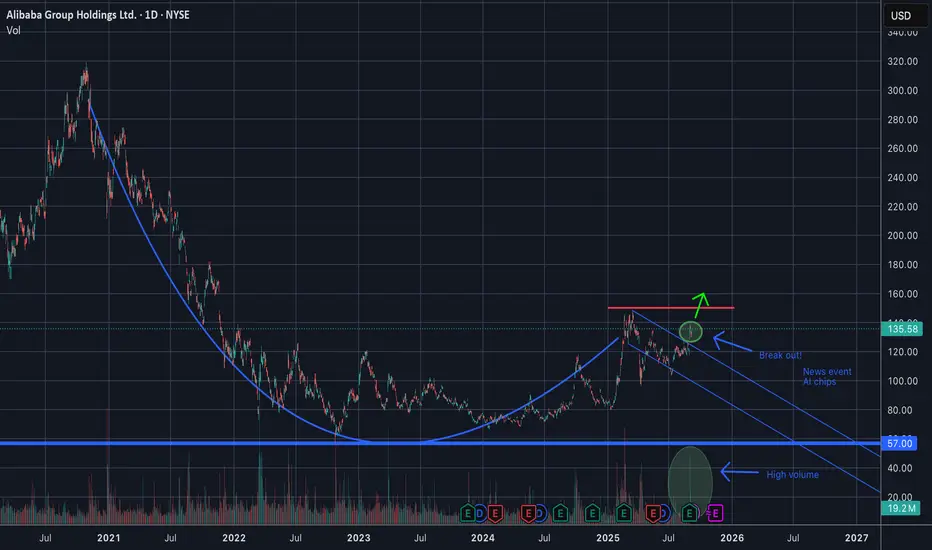
BABA Cup and Handle Breakout?The BABA chart has been perfectly forming a cup and handle pattern since the downturn in 2021.
Then BABA recently announced its AI Chips. This news event seems to have broken the stock out of its handle, indicating it will start a bull run.
BABA is a solid company with big plans and I believe it should have no problem reaching ATH's.
Thoughts?
BABA - LongI wanna say we are seeing a rotation into Chinese stocks, but not really sure. Looking at BABA on the weekly, it looks primed. I am currently in this trade, but it looks to have some promising upside.