BABA - when to buy?hi Traders
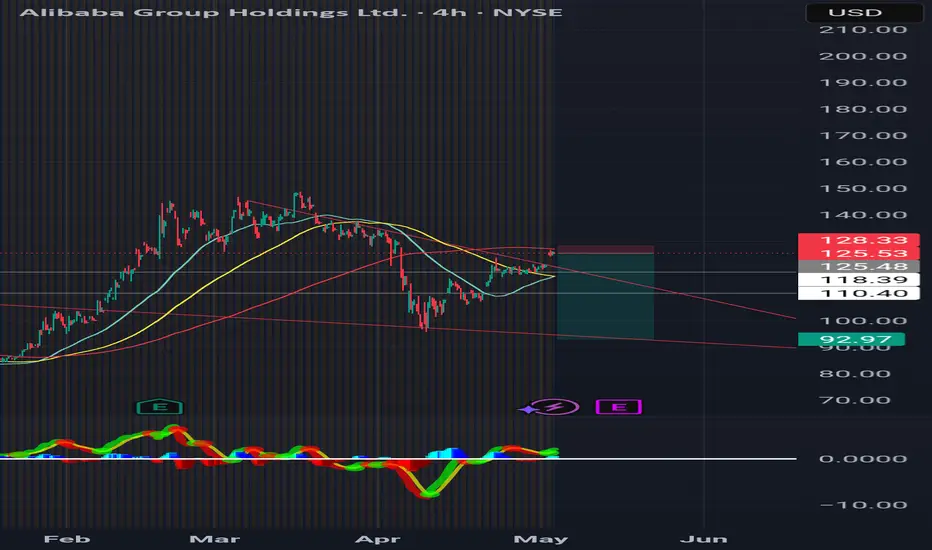
Today we are analyzing Alibaba Group Holdings Ltd. (NYSE:BABA) on a 4hour chart basis.
Alibaba stock is currently trading at $124
We expect that the price will get rejected at the downsloping resistance and in some time it will come back down to retest the support level around $100.
Following this event, we expect the price to bounce and move up towards the downsloping trendline (yellow line), which could be a take profit level.
$145 is the target.
This pattern (if continued) imitates a descending triangle.
We advise entering (buy) at this support line around $100. Be patient!
The stop loss can be placed around $95.
Good luck
Alibaba Group Holding Limited ADS Cert Deposito Arg Repr 1/9 ADS
No trades
Trade ideas

BABA short position - rising wedgehi traders,
Let's have a look at BABA on a 1h time frame.
After reaching approx.140$ levels, BABA experienced a significant correction and visited the 96$ level, which could very well be a bottom here.
After reaching 96$, the price has been forming a rising wedge pattern.
When the majority switched to a full bull mode again, we expect the trend to be a bit choppy now.
I'm expecting the price to break down out of the rising wedge sometime next week.
If you're a bear, you can take a short position at the breakdown.
The target for bears is around 106,50$.
If you're a bull, don't buy now but wait for a pullback.
There's a gap to 125$ that may get filled before the rising wedge plays out, so don't be surprised if the prices push a bit higher.
Good luck

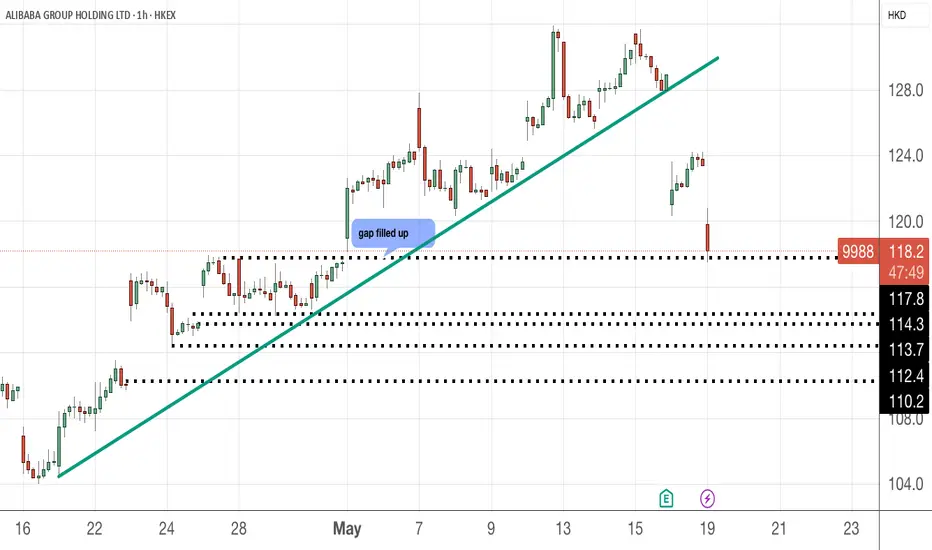
9988 dropped more than 4% .....In the 1H chart, we can see the price action has broken down from the bullish trend line and there are several gaps that it can possibly fill up. The first one at 117.8 is completed. So, if you want to go LONG/accumulate, go in in tranches instead of one lump sum. Yes, you may lose a bit in brokerage fees but the average price you get is much better.
Nibbled some for now
Please DYODD
BABA upBABA has followed technical movements very well over time
On the way up:
- it made several nice cups with good follow through to the upside
On the way down:
- it followed my channel height estimate (I learned this mostly from crypto charts)
- nice channel down
Consolidation:
- excellent basing pattern
- popped above & retouching the top of the box
The world economic stage feels shaky right now. I’m watching any long plays very closely, keeping risk to a minimum. Putting the macro aside, this chart looks good & has a history of good technical behavior.

Alibaba (BABA) is going down ?Market
Broader China Tech – CQQQ – Tracks a wide range of Chinese technology companies.
Large-cap China exposure – FXI – Focuses on major Chinese companies, including Alibaba.
Stock: Alibaba (BABA)
The stock has recently fallen below its 50-day moving average, indicating short-term weakness.
The 10-day moving average has crossed below the 20-day, a short-term bearish signal.
MACD is starting to reflect bearish momentum, suggesting growing market fear.
Selling volume has increased, confirming downward pressure from investors.
Fundamentals & Outlook
Despite recent technical weakness, Alibaba remains fundamentally undervalued relative to its peers and historical metrics.
The company continues to generate strong free cash flow and maintains a healthy balance sheet.
However, broader market sentiment around Chinese tech remains cautious due to regulatory overhang and global macro factors.
Conclusion
Near-term pullback is possible due to bearish technical indicators and weak sentiment.
Long-term investors may view this as a potential accumulation zone, provided there's risk tolerance for volatility in the China tech sector.

BABA: Buy ideaOn BABA we would have a high probability of having an upward trend after a bounce on the support line.

Alibaba - This Chart Speaks In Money!Alibaba ( NYSE:BABA ) prepares for a significant pump:
Click chart above to see the detailed analysis👆🏻
Basically since Alibaba was listed on the NYSE, it always perfectly respected market structure. With the recent rejection away from the key neckline, Alibaba is now creating a bullish break and retest. After bullish confirmation, this forms a bottom and we might see new all time highs.
Levels to watch: $110, $140
Keep your long term vision,
Philip (BasicTrading)


Potential for a bullish market9988 may be going on a bullish 12345 or a big B.
However, since no bullish divergence for RSI right now,
we can forsee 9988 will still be raising in the coming week.

Baba waking up after 3 years accumuationMonthly
VRVP indicate huge multiyear volume accumulation
Need to close monthly May candle above last month's high
Weekly
Expecting green continuation candles (good thing that each weekly candle is making a higher high each) as low is probably in with that weekly reversal candle and volume spike
Medium term target 200
300 in the cards along with monthly target RSI 70, but let's see if it goes through 200 without any major reversal candle

Cooked I don't think it would actually go this low into the wedge but if it chatches the moving averages then rejects I would hold other wise just a retest of support im guessing since they came in under last three quarters it'll be more pain. Plus US lawmakers want it delisted for "national security". No beuno.
BABA breakout! It broke above that golden fib zone between 61.8% and 38.2%. When this happens, stocks tend to go much higher and test previous 1y high. In my opinion $140 coming very fast

BABALICOUS Outlook Part 2 BABA continues the bullish outlook since we called it last on October 23rd.
Babalicous outlook Part 1 :
We continue with our update here!
Baba has broken through our previous resistance/ area of demand and has perfectly retested the zone.
As you can see our Area of demand has always been an area of tough resistance and as of now it is becoming strong support. In addition we have spotted a beautiful rounded bottoming pattern with a target of 80% or $210.00 price target from current levels. If BABA can close this monthly candle as is the $210 price level is sure to be tested!


BABALICOUS OUTLOOK BABA is Super bullish on higher time frames.
Great entry at current prices.
A move to the $200 level is expected.
Lets see!

BABA Showing Potential, But Not Quite ReadyNYSE:BABA has gone on a crazy run this year showing signs of strength. Recently price has stall out leaving us at a cliff hanger. The bull run was more than likely fueled by large investors accumulating shares at previous years lows as shown on the chart. In Wyckoff that typically happens in Phase B, the cause building phase. During this phase price consolidates with multiple tests or fake outs of the range as 'big money' accumulates shares at lows and soaks up the remain liquidity. The recent breakout confirms that supply has been absorbed, and price is ready to move higher, this marks the end of Phase B. The breakout is also called a 'Sign of Strength' in Wyckoff Method, which is also used a trap for buyers, hence the quick move back into the trading range. This move marks the beginning of Phase C, which typically creates a Spring or LPS (Last Point of Support). The Spring will fall below the trading range and quickly recover, while the LPS will find the last point of support within the range and gradually move higher. As you can see in the chart price has not fallen to either, which means there may be more downside to ensue. This correlates with recent "Tariff Wars", so pay attention to the news when or if price retraces to these lower levels. I have currently identified a redistribution pattern on the 1H timeframe which is showing signs of completion and that price is ready to continue down. If prices breaks above $117.50 this will more than likely invalidate the redistribution.

BABA bulls lose control!my last bullish analysis was late February 2024, It can all bullish targets. now it seems like bears are taking over again, I think we may see the dip continue to trend support/support zones.
we may see a cluster support bounce around 78-89 area, Boost and follow for more

Alibaba - Don't Forget Chinese Stocks Now!Alibaba ( NYSE:BABA ) still remains super interesting:
Click chart above to see the detailed analysis👆🏻
After we saw the very expected parabolic rally on Alibaba about four months ago, Alibaba is now perfectly retesting major previous structure. Yes, we could see a short term pullback in the near future but this just offers a perfect break and retest after the rounding bottom pattern.
Levels to watch: $110, $140
Keep your long term vision,
Philip (BasicTrading)

$BABA slingshot ++ china long previsous bullish divergence ;
new scenario
Uptick in volume , slinght shot RSI & MACD oversold ,
China & Trump deal is inevitable china needs a plan but Trump keeps poking , you know you have the upper hand just wait a while ++ pushed back the TikTok deal so you have an extra 75 days with that you know they need some time as China was clearly unprepared ;;;;
anyways, I'm bullish and this goes for NASDAQ:JD NASDAQ:BILI aswell .

BABA is going down Hard BABA has dropped on a violent gap making a very large window with no bounce in sight. The drop should be very fast

BABA to hit 100 today in the ADR US listingChinese stocks are plunging, Hang Seng -13%. Alibaba will be hit by the trade tarrifs.


Triple TopWe are testing this weekly to the 3rd time now.
For almost 1 month we cannot overcomethis top level. Supposedly Ali Baba has forgotten the passwort to escape the cave and the treasure is overbought.
