Alibaba (BABA) Weekly – BABA is holding above a major structural support zone and remains inside a rising channel from the 2023 lows. The bullish scenario activates only if price stays above support and reclaims key levels.
Entry Trigger:
• Break and close above 156–162 zone (confirmation of bullish momentum)
Targets:
•
Alibaba Group Holding Limited ADS Cert Deposito Arg Repr 1/9 ADS
No trades
Key facts today
0.10 USD
16.21 B USD
124.73 B USD
About Alibaba Group Holdings Ltd.
Sector
Industry
CEO
Yong Ming Eddie Wu
Website
Headquarters
Hangzhou
Founded
1999
ISIN
ARBCOM4601T8
Alibaba Group Holding Ltd. engages in providing technology infrastructure and marketing reach. It operates through the following business segments: China Commerce, International Commerce, Local Consumer Services, Cainiao, Cloud, Digital Media and Entertainment, and Innovation Initiatives and Others segments. The Core Commerce segment consists of platforms operating in retail and wholesale. The China Commerce segment includes China commerce retail and wholesale businesses. The International Commerce segment focuses on international commerce retail and wholesale businesses. The Local Consumer Services segment is involved in To-Home businesses, which include Ele.me, local services and delivery platform, and Taoxianda, and To-Destination segment businesses which include Amap, the provider of mobile digital map, navigation and real-time traffic information, and restaurant and local services guide platform. The Cainiao segment has Cainiao Network and offers domestic and international one-stop-shop logistics services and supply chain management solution. The Cloud segment includes Alibaba Cloud and DingTalk. The company was founded by Chung Tsai and Yun Ma on June 28, 1999 and is headquartered in Hangzhou, China.
Related stocks

BABA: when China allows growth againAlibaba remains one of the most undervalued mega-cap tech companies globally. After years of regulatory pressure and weak macro conditions in China, the company is entering a stabilization phase. Regulatory risks have eased, and Chinese authorities are signaling support for the technology sector and

Alibaba May Be Breaking DownAlibaba climbed sharply in September, but some traders may think it’s giving back the gains.
The first pattern on today’s chart is the failed rally after the last earnings report on November 25. BABA has made lower highs since that session, resulting in a potentially bearish descending triangle.

BABA BUYBUY BABA at 106.0000 to 95.0000, riding back up to 148.0000 to 158.0000 as Profit Targets, Stop Loss is at 80.000!
Warning: This is only for entertainment and opinion purpose. Trading is a risky business, so do your own due diligence, and trade at your own risk. You can loose all of your money an

BABA 2026 SETUP: MACRO TURNS, CHINA RE-RATES, VALUE UNLOCKINGTicker: NYSE:BABA
Timeframe: 6–18 months
Bias: Bullish continuation into 2026
🌍 Latest Macro Catalysts (Why the Wind Is Shifting)
China Policy Put Is Back (Liquidity + Growth)
PBOC has clearly pivoted toward growth stabilization: rate cuts, reserve-ratio reductions, and targeted liquidity for c
ALI BABA : SELL OR BUY ??The last time that the price was around 100 $ was at the IPO (2014) and then between AUG 2016- JAN 2017
TOTALL ASSET :
IPO(2014) : 41.27 B
2016: 73.55 B
2017: 114.01 B
2020: 257.86 B
2021 :276.25 B (UNTIL Q3)
GROSS PROFIT :
IPO(2014) : 8.12 B
2016: 14.05 B
2017: 20.66 B
2020: 42.09 B
2021: Q1

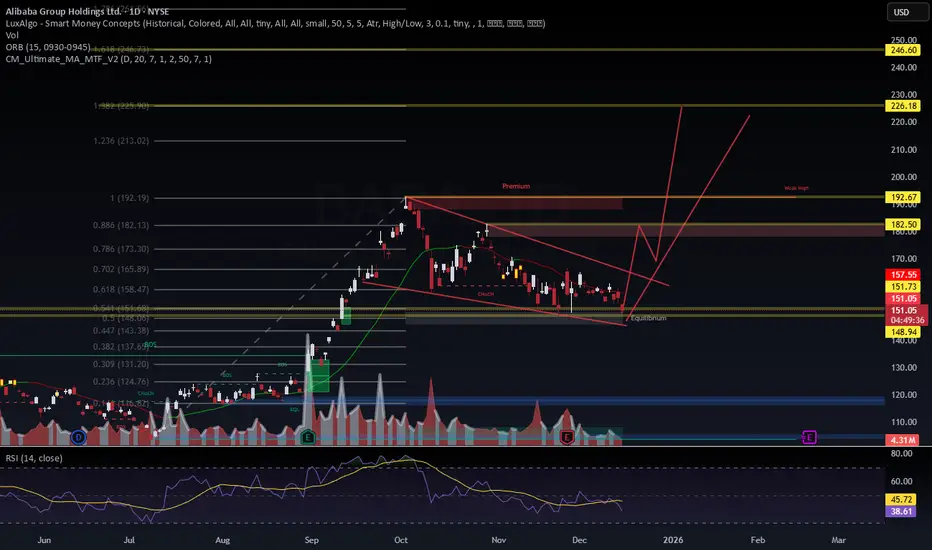
$BABA | Macro + Technical ConfluenceNYSE:BABA | Macro + Technical Confluence
Current setup: Descending wedge at 0.618 fib ($158) after Premium rejection at $192. RSI neutral at 45.
Macro Catalysts:
Cloud AI segment +34% YoY — 7 straight quarters of triple-digit AI growth
Qwen AI model outperforming ChatGPT in certain benchmarks
Fed

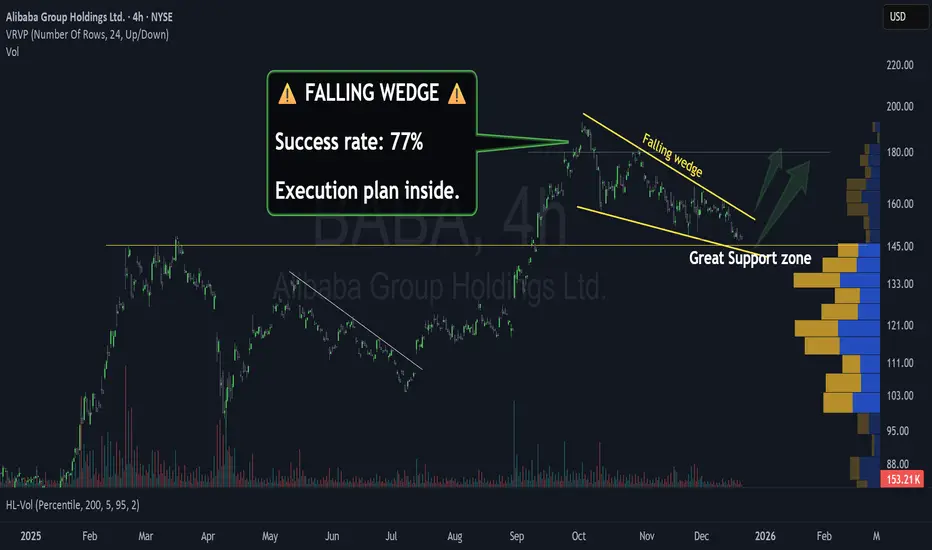
BABA: Two Strategic Entries for Falling Wedge at SupportBABA: Two Strategic Entries for Falling Wedge at Support
We are seeing a textbook bullish setup on the NYSE:BABA 4-hour chart. A Falling Wedge pattern converging right on top of a major historical Support Zone.
This structure offers us two distinct tactical approaches:
1. The Anticipat

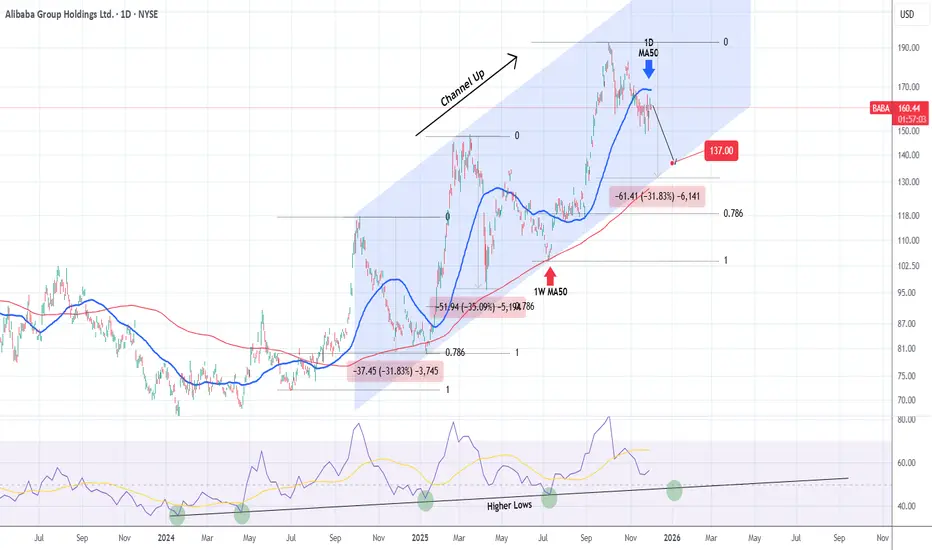
ALIBABA This correction isn't over.Alibaba (BABA) has been trading within a Channel Up since the October 07 2024 High. Right now it is on the 3rd Bearish Leg of this pattern, confirmed below the 1D MA50 (blue trend-line).
Both previous Bearish Legs touched the 1W MA50 (red trend-line) and the 1W RSI Higher Lows trend-line.
We expec
See all ideas
Summarizing what the indicators are suggesting.
Oscillators
Neutral
SellBuy
Strong sellStrong buy
Strong sellSellNeutralBuyStrong buy
Oscillators
Neutral
SellBuy
Strong sellStrong buy
Strong sellSellNeutralBuyStrong buy
Summary
Neutral
SellBuy
Strong sellStrong buy
Strong sellSellNeutralBuyStrong buy
Summary
Neutral
SellBuy
Strong sellStrong buy
Strong sellSellNeutralBuyStrong buy
Summary
Neutral
SellBuy
Strong sellStrong buy
Strong sellSellNeutralBuyStrong buy
Moving Averages
Neutral
SellBuy
Strong sellStrong buy
Strong sellSellNeutralBuyStrong buy
Moving Averages
Neutral
SellBuy
Strong sellStrong buy
Strong sellSellNeutralBuyStrong buy
Displays a symbol's price movements over previous years to identify recurring trends.
Curated watchlists where BABAD is featured.


