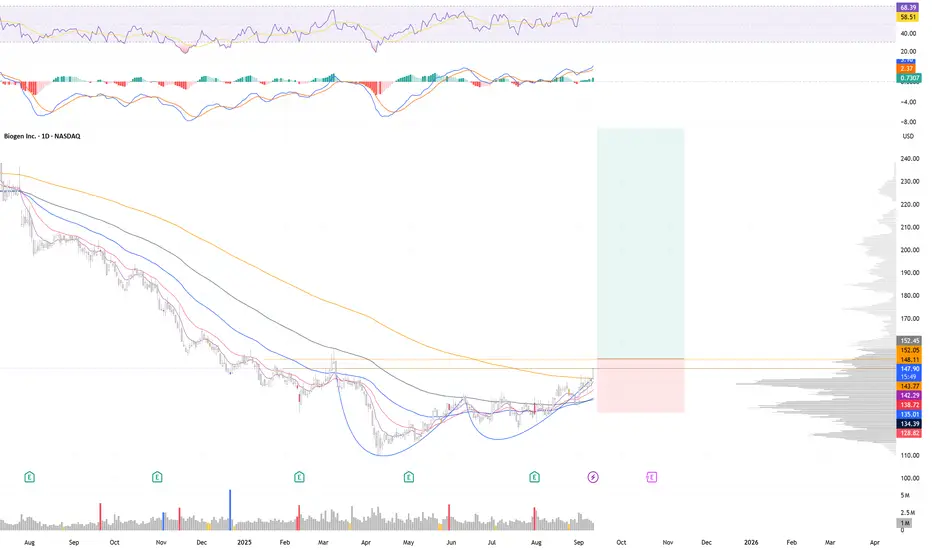
The Exhaustion Gap: BIIB's Momentum Failure at Resistance## Risk Management Framework
Entry: 144.86 (Point 4)
Stop Loss: 152.92 (8.92% risk) - Above Point 2 highs
Target: 91.99 (35.88% reward) - Major Chaos Theory support zone
Risk/Reward Ratio: 1:4.02
Position Advantages:
• Price at mathematical resistance (VWAP 2-sigma)
• Momentum exhausti
975 ARS
1.49 T ARS
8.49 T ARS
About Biogen Inc.
Sector
Industry
CEO
Christopher A. Viehbacher
Website
Headquarters
Cambridge
Founded
1978
ISIN
ARBCOM4601A8
FIGI
BBG00PCCBPX0
Biogen, Inc. is a biopharmaceutical company, which engages in discovering, developing, and delivering therapies for neurological and neurodegenerative diseases. Its products include TECFIDERA, VUMERITY, AVONEX, PLEGRIDY, TYSABRI and FAMPYRA for the treatment of MS, SPINRAZA for the treatment of SMA, ADUHELM for the treatment of Alzheimer's disease, and FUMADERM for the treatment of severe plaque psoriasis. The company was founded by Charles Weissmann, Heinz Schaller, Kenneth Murray, Walter Gilbert, and Phillip Allen Sharp in 1978 and is headquartered in Cambridge, MA.
Related stocks

Shall VCP Pattern break the Down-Trend?BIIB ready to break-out Downtrend, Good first Momentum bullish was created let's wait for what happening toward?
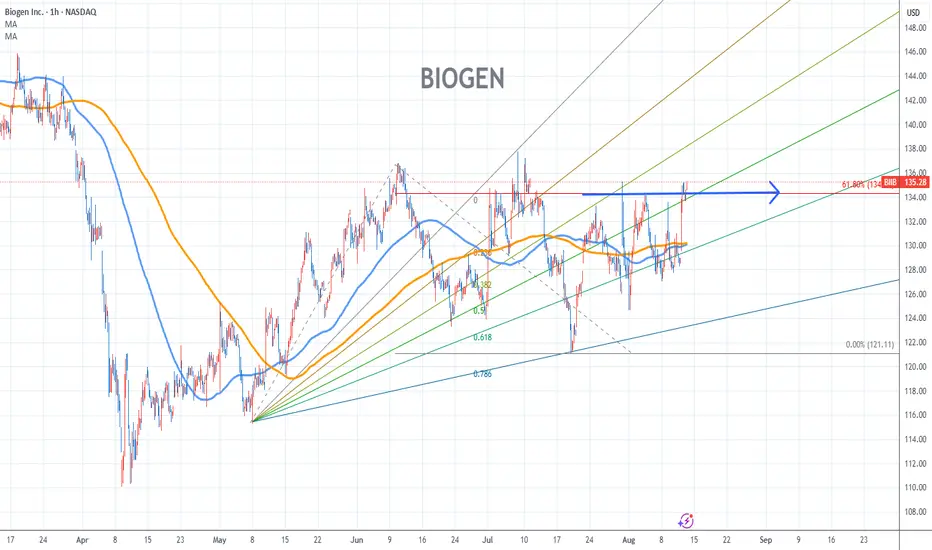
Biogen Stock Chart Fibonacci Analysis 081325Trading Idea
1) Find a FIBO slingshot
2) Check FIBO 61.80% level
3) Entry Point > 134/61.80%
Chart time frame:B
A) 15 min(1W-3M)
B) 1 hr(3M-6M)
C) 4 hr(6M-1year)
D) 1 day(1-3years)
Stock progress:A
A) Keep rising over 61.80% resistance
B) 61.80% resistance
C) 61.80% support
D) Hit the bottom
E)
Quick View : $BIIBThe daily chart looks really good.
Another bullish alert at the end of this crazy downtrend.
Box on the go with flat EMAs.
Earnings coming that may work as catalyst.
Ready to Catch
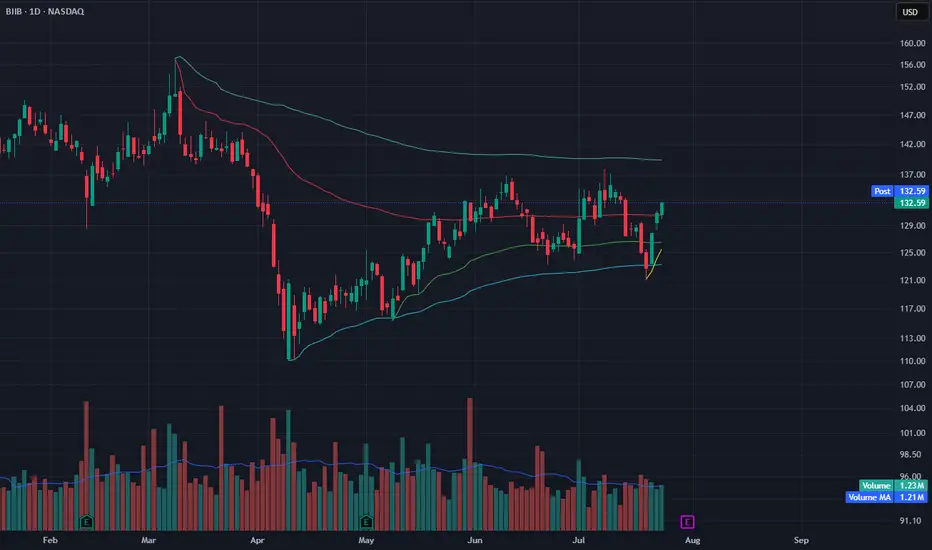
BIIB Bounces from VWAP ClusterBIIB is climbing after bouncing off a VWAP cluster (yellow and green zones) and reclaiming key levels. Price held support near $125 and is now pushing toward the upper range near $134.
Volume is slightly above average (1.23M vs. 1.21M MA), and price structure looks constructive with a clean higher
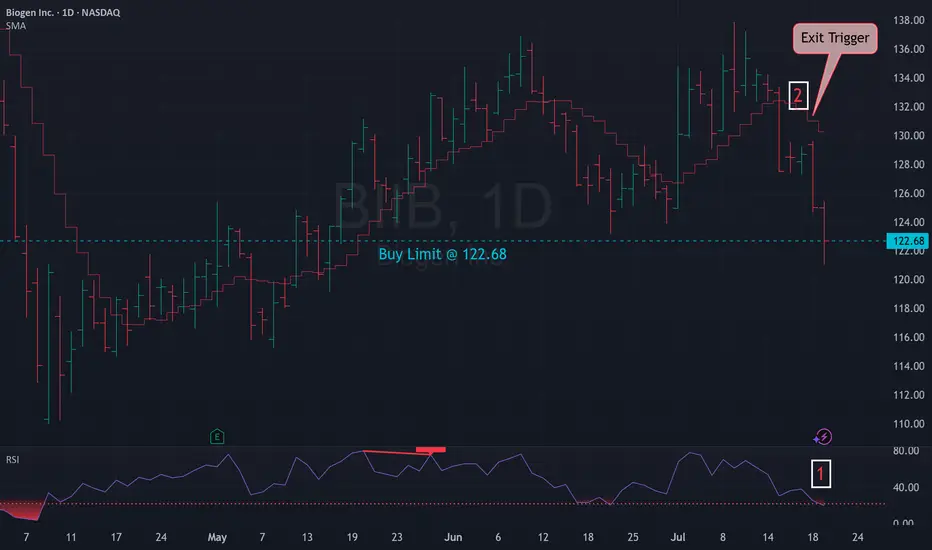
Mean Reversion Trade: BIIB1. RSI in oversold region
2. Price likely to rebound back the the mean
Trade Rules:
Entry Trigger - RSI has cross below oversold region, enter limit buy at close price
Exit Trigger - Close at market when close price cross above exit trigger (Red step line)
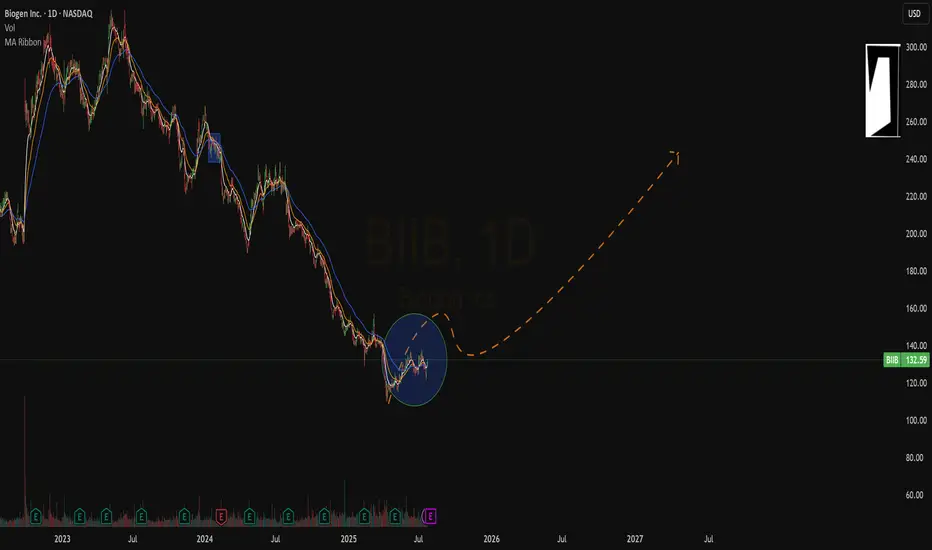
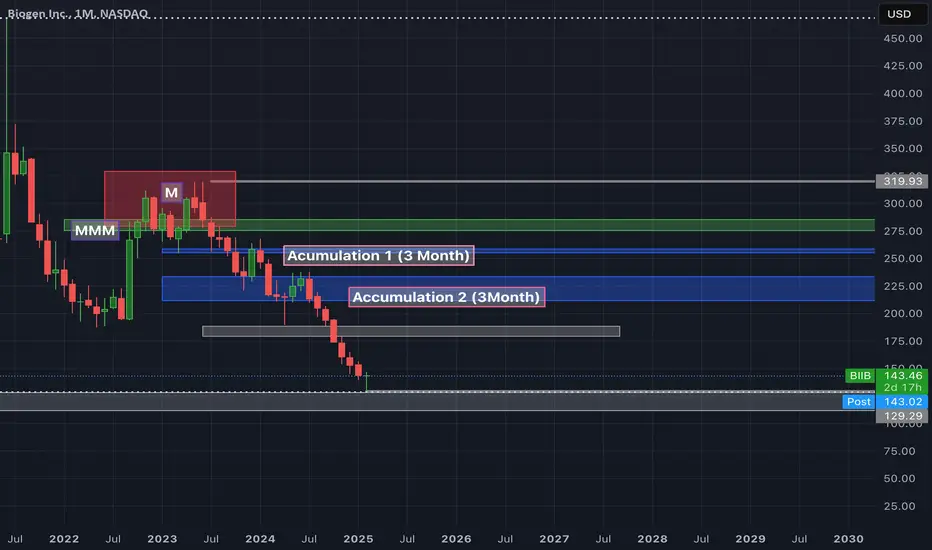
BIIB - Picture Perfect Market Maker ModelQuite Frankly This Is a Piece of Art.
Ai is been helping Bio Tech massively
Using the 3 Month and 1 Month Time frames we have a perfect Market maker model. Consolidation up top with market manipulation straight to distribution (A,M,D)
- 2 main accumulations before it hit's a perfect fair value g
BIIB is BullishPrice was in a strong downtrend, however a matured bullish divergence hints the return of bulls. If the descending trendline is broken with volume along with the previous lower high then according to Dow theory we can expect a bullish reversal. Targets are mentioned on the chart.

$BIIB imploding to the downsideStock is leaking out lows, next stop 182.23 where we should bounce. Until then i am #bearish

BIIB Long, Coming Soon!The price has sold off from the $207.59 pivot level, dropping to $193.84 as of the Monday, September 30th close. The sharp decline from $200 to $190 over two days last week was largely due to sector-wide weakness, as reflected in the IBB (Biotech ETF). Since then, both the ETF and BIIB have been con

See all ideas
Summarizing what the indicators are suggesting.
Oscillators
Neutral
SellBuy
Strong sellStrong buy
Strong sellSellNeutralBuyStrong buy
Oscillators
Neutral
SellBuy
Strong sellStrong buy
Strong sellSellNeutralBuyStrong buy
Summary
Neutral
SellBuy
Strong sellStrong buy
Strong sellSellNeutralBuyStrong buy
Summary
Neutral
SellBuy
Strong sellStrong buy
Strong sellSellNeutralBuyStrong buy
Summary
Neutral
SellBuy
Strong sellStrong buy
Strong sellSellNeutralBuyStrong buy
Moving Averages
Neutral
SellBuy
Strong sellStrong buy
Strong sellSellNeutralBuyStrong buy
Moving Averages
Neutral
SellBuy
Strong sellStrong buy
Strong sellSellNeutralBuyStrong buy
Displays a symbol's price movements over previous years to identify recurring trends.
BIIB6071255
Biogen Inc. 6.45% 15-MAY-2055Yield to maturity
6.03%
Maturity date
May 15, 2055
US9062XAD5
Biogen Inc. 5.2% 15-SEP-2045Yield to maturity
5.92%
Maturity date
Sep 15, 2045
BIIB4981508
Biogen Inc. 3.15% 01-MAY-2050Yield to maturity
5.87%
Maturity date
May 1, 2050
BIIB5133378
Biogen Inc. 3.25% 15-FEB-2051Yield to maturity
5.83%
Maturity date
Feb 15, 2051
BIIB6071069
Biogen Inc. 5.75% 15-MAY-2035Yield to maturity
5.07%
Maturity date
May 15, 2035
BIIB4981506
Biogen Inc. 2.25% 01-MAY-2030Yield to maturity
4.42%
Maturity date
May 1, 2030
BIIB6071254
Biogen Inc. 5.05% 15-JAN-2031Yield to maturity
4.40%
Maturity date
Jan 15, 2031
BIIB5133379
Biogen Inc. 3.25% 15-FEB-2051Yield to maturity
4.30%
Maturity date
Feb 15, 2051
See all BIIB bonds
Curated watchlists where BIIB is featured.
