Break out or Break down - $C - CitigroupShort-term call?
After a quick drop and sharp earnings reversal, Citigroup seems to be ready to break out of the "Head and Shoulders" pattern it has been setting for a year. In the past two years especially, the second half of the year has typically been a boon to the Financial Sector. Due to the lack of resistance, if Citigroup does resume it's trend, it's clear skies until $73 or 8 strikes from it's Monday (7/16/18) close of $69.47. MACD & RSI divergence, higher lows & highs, hint it's break out time; although $C tends to test support when closing below a mid-dollar strike (e.g. $68.5, $69.5 ... ) many signs seem bullish.
Short-term Put?
Since the 100-day MA hasn't been traversed quite yet and dimming global outlook for a very globally diverse financial institution are pertinent concerns: a resumption of $C's breakdown toward $67.50 is still plausible; Less likely after $66.50 was touched and multiple lines of support drawn there after during the post-earnings fire-sell, but still plausible all the same. Having a complete collapse like the "Head & Shoulders" suggests, and a fall straight through $66 is more of a longer term trend that is unlikely, but still possible. Caution would be to start with a strangle or straddle around the $69.50 strike, with the call focusing on the resistance-turn-support of $69 (firmly in the money) and roll the dice with the put's placement, with one's choice on potential gains.
At the end of the day:
Financial deregulation, tactical global divestment, Citigroup's 10% share buyback, increase in dividend payouts and a solid beat on it's Q2 earnings (despite the sell-off) all point toward a brighter future. Old allies and Old foes becoming the opposite, nationalistic rhetoric and new Middle-Eastern oil deals all are obstacles, but whether they are insurmountable is up to your short-term hypothesis because only time tells; and time is always money.
Citigroup Inc. Shs Cert Deposito Arg Repr 1/3 Sh
No trades
Market insights

Citi (C) bullish butterfly pattern and daily hammer!The banks showed significant relative weakness against the market since 2018.
While, with regard to the rate hike cycle, put some banks in the portfolio is still one of the major investing ideas.
Therefore, this daily bullish butterfly pattern and the daily hammer combination may be a short-term set-up to long C!
Without abundant EMA correction rooms, I won't prefer trading the hammer with the breakout strategy;
on the other hand, the 50% or 0.618 pullback buy and put the out below 62.80 would be the trade for me!
Let's see how it goes!


Citigroup still says buy Trade the trend with bullish bias until proven wrong, It bounced nicely off the last safety net of 66, price area around 72 should be interesting to see if bears will keep the ball rolling or let the trend continue to flow. Trend says buy so I buy. Stop loss below 65 if that breaks it will show bears are gaining momentum.

CITIGROUP - is turning bearish and expected for a new breakdown.CITIGROUP - is turning bearish and expected for a new breakdown.


watch for the break downIf this can close below that blue ling then expect lower prices. falling wedge below all sma banks are really lagging and holding the markets back

Long C via CallsStrong close here on the 65m chart.
Long 3x $67.5 Aug17 calls @ $2.51
Stop: 66.68
Target: ~72.2
I will also move my stop up as C moves up because of decaying options.

A Bad Year For US Financials Looking Even WorseMorgan Stanley, Bank Of America, Citigroup and JPMorgan - all exhibiting similar year to date behaviour. The whole sector is rolling over, reversing the 2017 rallies as the yield curve remains flat, and possibly set to invert. JPMorgan and Bank Of American look particularly bad.. notice both are just managing to hold up above a clear 6 month support. I would bet on break lower in the coming weeks, possibly days. BAC, JPM, C, MS, XLF.


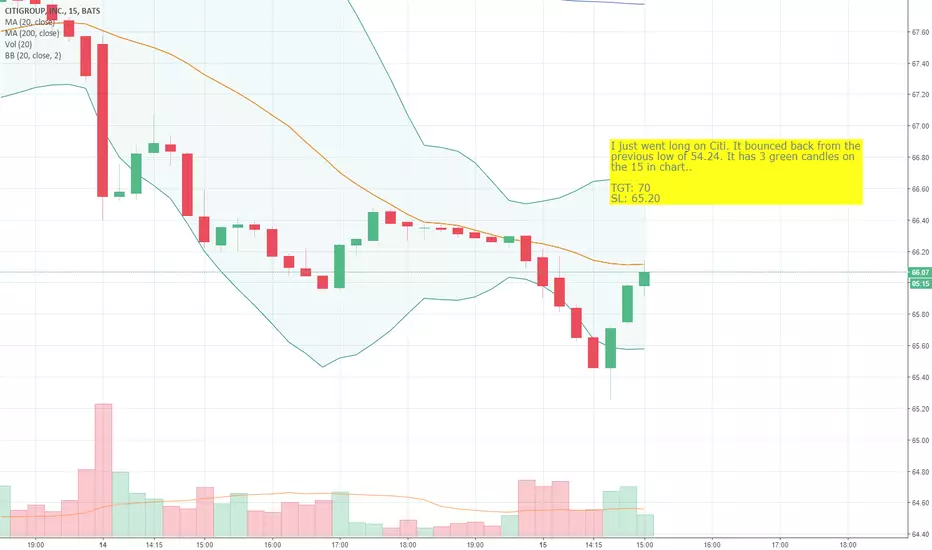
Long call on C - My Options tradeI just went long on Citi. It bounced back from the previous low of 54.24. It has 3 green candles on the 15 in chart..
TGT: 70
SL: 65.20


#C citi plan....Im on sell...made money...now the next plan...
Plan 1 : Sell here 66.5
Plan 2 : buy pull back 73.5
I still feel the trend is up...and it will move up...let us watch....

Citigroup Support & PredictionI believe the market support is going to be around $67 for the next few weeks, and a short call of it going to reach a $70 market price within a timely manner is reasonable. The negative correlations and left skewed spread though seems unattractive to investors, but it is still not considered a high risk stock. Overall Citigroup is investable for a conservative portfolio and both an expectancy of it surpassing the $70 price, as well as strong market support trailing at $67 in the meantime, is a reasonable analysis.

Citibank found support at 67C has been at 67 before, if the price clears 68, it could grind higher towards 78.


C & financial sector showing weakness?The financial sector sell off caught my attention. Bearish future?

The "Cheap" Bank w/ Short Term Trading Gains (PT $75.40)Who couldn't love Citi when it had dropped to $68? Given both the long term and "2017 Hotness" trend lines, the stock has been knocked down between a reasonable to weak area where it can rebound back up to a comfortable "median" position that has been previously held. Reading between the fib lines and the somewhat consistent range of $70-77, it wouldn't be unreasonable for the stock to climb back to around the midpoint of $75. Its earnings call was great, though some will argue with how fantastic it should have been given the current climate and what's priced in.
If the stock reaches $78, absolutely sell and don't be greedy trying to wait for that magic $80 mark. I'm sure everyone will be watching and waiting for it, but without proper volume, it will be a short lived rally up as everyone else takes their gains. I love Citi as a company and believe it to be strong and stable moving forward the rest of this year. Any price point close to $70 is great for a small position and for technical trading to get some ranged gains.

Citibank filled it a Gap, but the ES didn’t...Looks like we will get a squeeze higher on the Es, then drop

MA 200 is broken.The price bounced off the upper border of the downward trend. This means that we will be able to move the stop order all the time.The fall occurred on the day of publication of the quarterly report.This fact sets the direction for the next three months.

C is on an ABC Wave Now, A-B up wave Monthly chart just tells you before 2008 2009 crash Citibank was huge, now $80 looks like a MAJOR resistance area, with $40 MAJOR support area. Earning is scheduled for later this week, I except price will be bullish for next week or two, then continue down wards to support level of $60 area.
