Citigroup Inc. Shs Cert Deposito Arg Repr 1/3 Sh
No trades
Trade ideas


CCall option buy at price stock 52$ strike price 53@0.16, And sell at price stock 53$ strike price 53@ 0.55 Take profitrun = +243% in 4 days.


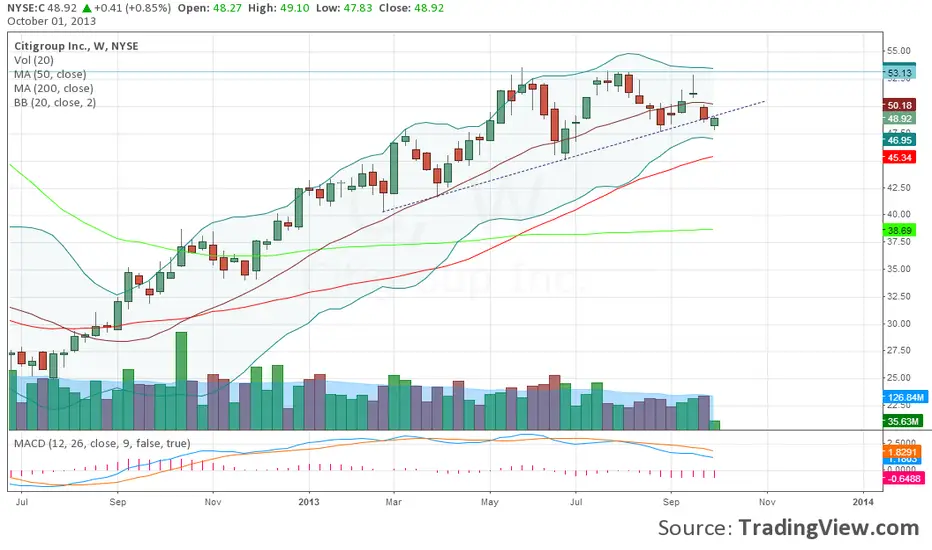
Citigroup Ready to Move?Shares of Citigroup have been trading in the $48-$52 range for close to the last 6 months. With the stock currently trading at $50, Citigroup has YTD performance greater than 25%. Despite the above average returns, I think the stock is getting ready for a breakout very soon. The $52.5 January options are trading at 5:1 call to put ratio and the $55 January option right now has a 3.5:1 call to put ratio.

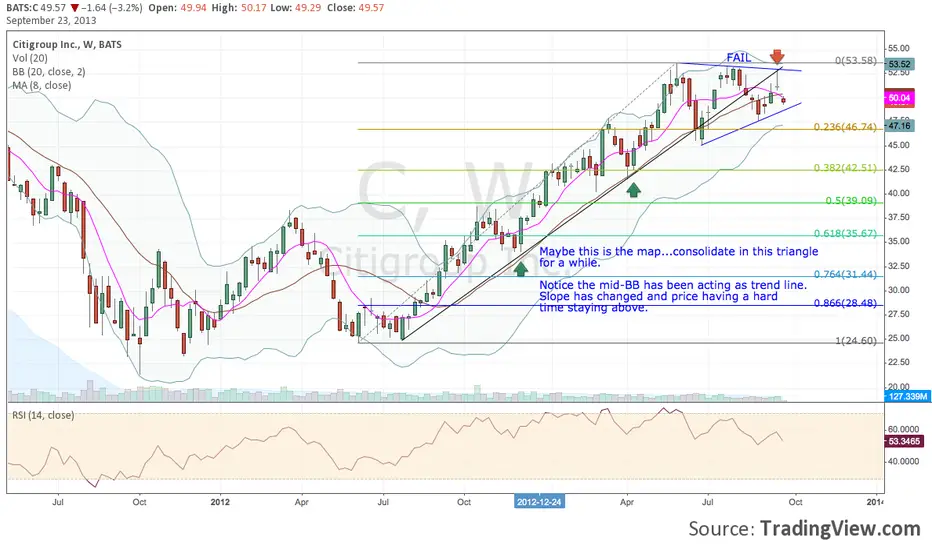
CityGroupElliott Wave Bullish Contracting Triangle.
For the reason C wave was already complex, D should be finished & impulse wave up to act with daily TF.
E finished either X wave or IV wave. First Alternation comes with 51 $ tick, note that once & if reached contracting triangle can be drawn as bearish pattern & scenario ie. to end B wave !


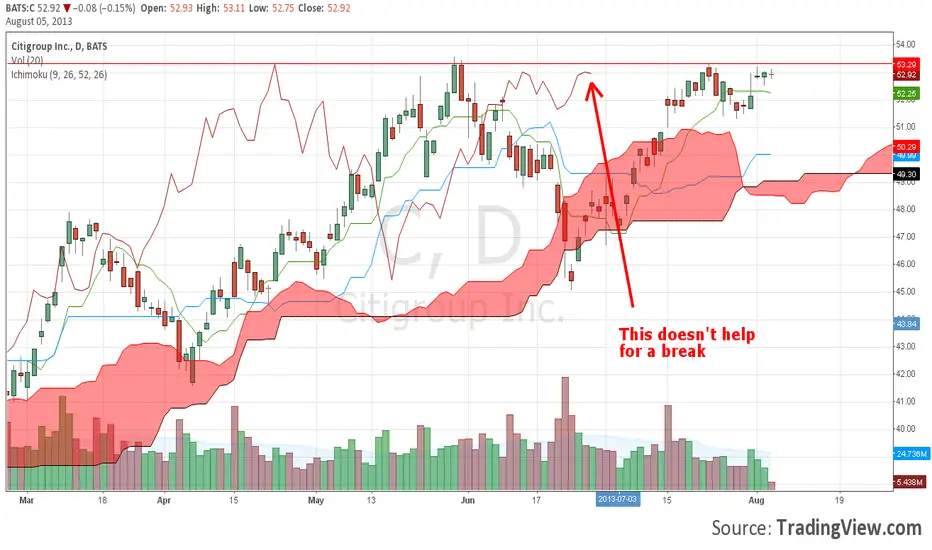
Citigroup outlookIf we get a retest of prior highs, there is a big chance to get short for a long-term move down.
This pattern is based on long covering at an important price level. Wait for a false break or any kind of weakness.
For further information about my trading style, live trading videos and analyses, subscribe to my YouTube Channel: bit.ly

Triple Top Nick Line broke ...whats Next 45.40Triple Top Nick Line broke ...whats Next 45.40 ,,, this caused of broken nike line with low volume re- test we think this the best place to go bearish


$SPY My my! Only a break of 53.30 can lead this market to ATH. But MCD, RSI, Volume have different plans! 43.98 next stop!


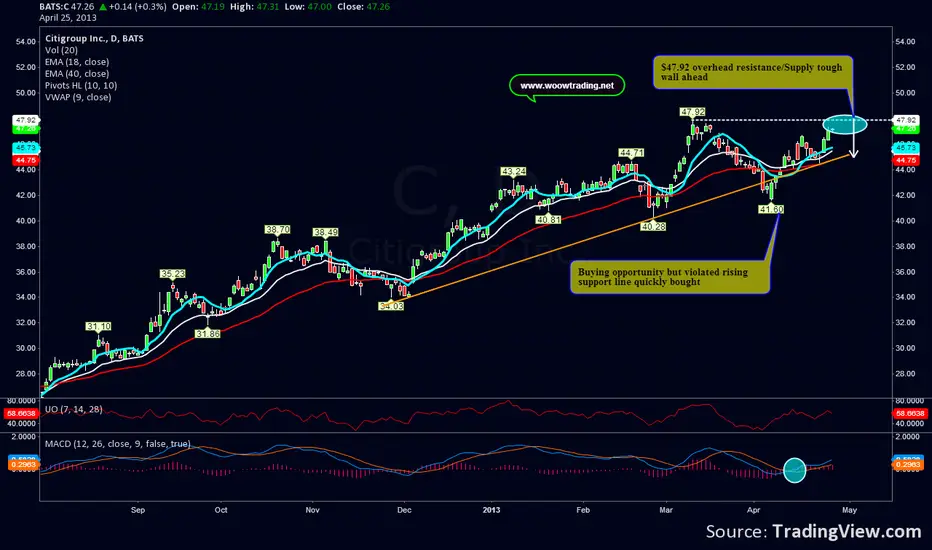
Will $C crash recent swing high?Tough to judge from here, but it could be another shorting opportunity if that fails. Good to take note and see if price finally pushes above recent swing high $47.92 area if not expect another possible violation of the rising support line. Join us woowtrading.net