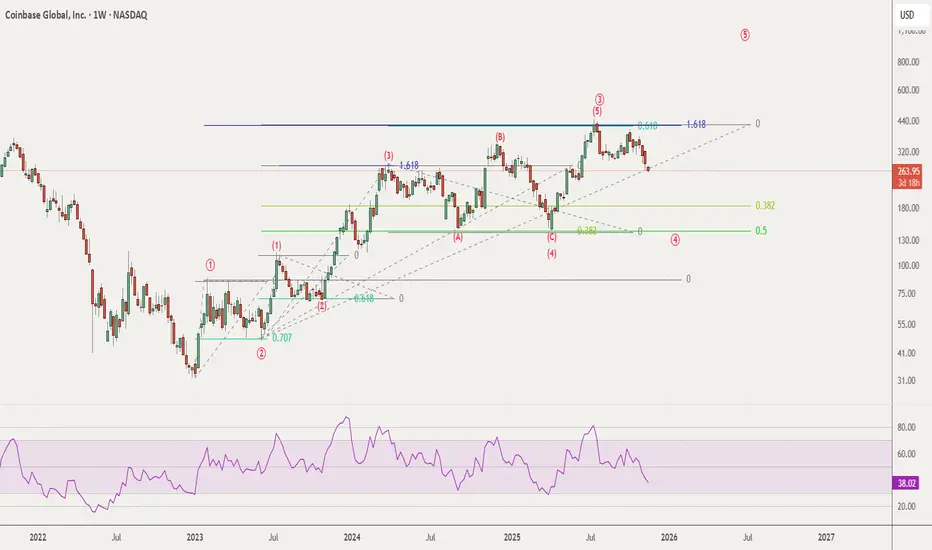
COINBASE Still looks strong!NASDAQ:COIN Coinbase appears to have printed completed 2 of (V), extending the targets to the upper boundary trend-line and R4 weekly pivot, $718.
Price found support at the weekly pivot just above the weekly 200EMA and lower trend-line.
🎯 Terminal target for the business cycle could see prices as high as $718 based on the weekly pivots
📈 Weekly RSI has reset below the EQ.
👉 Analysis is invalidated below wave (IV)
Safe trading
Trade ideas

Coinbase and Bitcoin Breakout before breakdown In this video I analyse Coinbase and BTC and draw out the idea of the push to the upside although highlighting what levels need to be claimed in order to do so .

CoinbaseToday I went ahead and bought just 10 shares @ $254. I do not have a stop set as of now. This is due to my intention to buy more shares should price continue to move lower. Whether it does or not remains to be seen. My next buy zone would be the $225 area if that is the case.
If you recall, I expect price to raise to the mid - upper $300's range at the minimum. I could always be wrong, but both of the potential counts I am tracking point higher. This is normally a good sign that price intends to head in that direction.
MACD is weakening to the downside and is now positioned to begin moving higher again. Of course, it could continue its descent too, so don't think it is without risk to go long at this juncture. This is why I only bought 10 shares.
In short, rather price moves down more or moves higher again next, I believe this is a good investment opportunity. We should know soon enough if (A) or ((2)) is complete or not.

COINBASE entering a brutal Bear Cycle. 1st Stop = $150Coinbase (COIN) has been on a strong decline since its July All Time High (ATH) and right now is within the 1W MA50 (blue trend-line) - 1W MA100 (green trend-line) range. This is similar so far to the correction phases since March 2024 that found a bottom on the Support Zone but more importantly looks identical to the start of the 2022 Bear Cycle.
Based on the latter, after the current 3-wek consolidation is over, the stock should decline more, towards the 0.236 and 0.382 Fibonacci levels. The latter is where the Support Zone is, hence our medium-term Target is $150.00 (marginally above).
If the Support Zone breaks and the market keeps mirroring the 2022 Bear Cycle, we are looking at a brutal sell-off that could be as low as $54.00 (Fib 0.786) and $32.00 (Fib 1.0). Notice that in 2022, the most efficient bottom buy signal was given initially by a massively oversold 1W RSI (nearly 20.00) and finally confirmed by a Higher Lows Bullish Divergence of the same indicator. Use that to time the bottom to your advantage regardless of the price and buy for the next long-term Bull Cycle.
---
** Please LIKE 👍, FOLLOW ✅, SHARE 🙌 and COMMENT ✍ if you enjoy this idea! Also share your ideas and charts in the comments section below! This is best way to keep it relevant, support us, keep the content here free and allow the idea to reach as many people as possible. **
---
💸💸💸💸💸💸
👇 👇 👇 👇 👇 👇

COIN bottom forming? Wave 4 changed to wave 2NASDAQ:COIN Price appears to be completing wave C of IV, a corrective pattern to the downsid,e expected to be shallow
Wave 4 was invalidated due to the retracement depth becoming wave 2 of V, which actually presents a bigger target for the wave 3 move to come. Price stopped at the golden pocket reflecting its higher cap characteristics.
📈 Daily RSI has printed a confirmed bullish divergence from oversold.
👉 Continued downside has a target of the S2 pivot at $210
Safe trading
Coinbase Global Inc. Expands 24/7 Altcoin Futures TradingCoinbase Global Inc. (NASDAQ: COIN) is expanding its derivatives business with the introduction of 24/7 altcoin futures beginning December 5. The new lineup will include long-dated, perpetual-style futures for Avalanche, Bitcoin Cash, Cardano, Chainlink, Dogecoin, Hedera, Litecoin, Polkadot, Shiba Inu, Stellar, and SUI. This expansion builds on Coinbase’s existing 24/7 markets for Bitcoin, Ethereum, Solana, and XRP, significantly broadening access for traders seeking diverse crypto exposure.
A Major Expansion of Altcoin Futures
The move signals Coinbase’s commitment to meeting rising demand for round-the-clock crypto trading. By extending futures beyond major assets into popular altcoins, Coinbase strengthens its position as a U.S.-regulated venue offering continuous derivatives access. The newly added assets operate under the same structure as existing futures: perpetual-style mechanics with hourly funding and twice-daily settlement to keep contract pricing closely aligned with spot markets.
Unlike traditional perpetual contracts, Coinbase’s U.S. version carries five-year expirations, blending long-term optionality with the flexibility traders expect from perpetual futures. This hybrid approach appeals to institutions and advanced traders who want exposure without rolling short-dated contracts.
Strategic Positioning in a Competitive Market
With global crypto exchanges competing aggressively in derivatives, Coinbase’s move positions it as a key player offering regulated futures across a wide basket of assets. The expanded lineup enhances liquidity, attracts hedging activity, and deepens Coinbase’s ecosystem ahead of growing institutional interest.
Technical Outlook for COIN
COIN recently retraced sharply from its $444 high, falling toward the $240 support zone, where it currently trades. This level is critical: a breakdown could send price toward the ascending trendline near $170, aligning with the previous higher low.
If either support level holds, the broader bullish trend remains intact. A strong rebound may set COIN on track to retest, and potentially reclaim the $444 high, supported by its expanding derivatives business and improving market sentiment.
CoinbaseIf you have been following along with my analysis, you know that I have had this box drawn for over a month. I only post on TV every so often, so you don't get my full analysis. However, I have been calling for $225 as my "sweet" spot for price to bottom with the possibility of dropping all the way to the 1.618 @ $203.01. Rather or not we make it down there remains to be seen. We do have positive div forming though, hinting that a reversal is incoming.
I am not sure if I will post it on here or not, but when we do bottom in what I am calling (A), I will be able to ascertain the target area of (B). If this drop is actually ((2)), then we will be headed much higher afterwards. Either way, after this move lower completes, price will very likely head higher by at least $100 per share. That is from current price levels too. Time will tell, but this will be a very good trade to take IMHO.

COIN - Alternative count?I've been calling for a decent 4th wave correction for a number of US equities but this count has been growing in weight in the back of my mind in recent days. It suggests that the preceding wave 3 was extended in it's wave 5 and now the 4th wave correction may have finished at the wave 4 level of that degree. I will be looking for 5 waves up from this move to see if this count has merits.....

COIN Short Trade Setup — Smart Entry Levels Revealed!🎯 COIN "The Crypto Exchange Heist" 💰
Stock Market Profit Playbook for Swing & Day Traders
📈 Analysis Overview 🔍
Asset: NASDAQ:COIN | Coinbase Global Inc. ⚡
Current Price: $295.22 (Nov 7, 2025) 💵
Market Cap: $79.60B 🏆
Trading Volume: Bullish liquidity ✅
Technical Bias: BEARISH CONFIRMED ⬇️
🎲 The Setup: Bearish Hull Moving Average Breakout
We've identified a critical bearish breakdown pattern with Hull Moving Average (HMA) confirmation. The rejection from the $350 resistance zone combined with oversold conditions creates the perfect "HEIST" opportunity for disciplined traders.
Key Technical Signals 🚨:
✅ Hull MA showing downtrend confirmation
✅ Price rejection from upper resistance
✅ Volume compression into breakdown
✅ RSI divergence in overbought territory
✅ Support trap formation at key levels
🎪 ENTRY STRATEGY: The "Layering Heist" Technique 💎
Method: Multiple Limit Order Layers (Position Stacking Strategy)
Instead of chasing ONE entry, we deploy the Thief OG Layering System — multiple entry levels to average down as the bearish thesis develops:
📍 Entry Layers (Top to Bottom):
Layer 1: $340.00 💎
Layer 2: $330.00 💎
Layer 3: $320.00 💎
Layer 4: $310.00 💎
Pro Tip: Feel free to add MORE layers based on your risk tolerance and account size! The more precise your layers, the better your average entry price. 🎯
🛑 Stop Loss Placement (Risk Management Critical)
Thief OG's Recommended SL: $350.00 🚫
This sits above the rejection zone — if price reclaims $350+, the bearish thesis is invalidated, and we exit.
⚠️ DISCLAIMER: This is YOUR trade. We recommend this SL, but YOU control your risk. Adjust based on your position size and risk appetite. No feelings — just math! 📊
🎁 PROFIT TARGET (The "Escape Plan")
Primary Target: $240.00 🎯
Target Type: Strong Support + Oversold Zone + Trap Confirmation
Why $240?
Historical support confluence 📍
RSI reaching oversold extremes 📉
Previous institutional accumulation zone 🏦
Fibonacci 0.618 retracement level ✨
⚠️ CRITICAL NOTE: This is YOUR profit target decision. Once you're in profit, TAKE YOUR MONEY — don't be greedy! Secure gains at comfortable levels. Risk management > Ego. 💪
📊 Correlation Pairs to Watch 🔗
Keep an eye on these related assets for confluence signals:
Bitcoin (BTC)
Price Action: CRYPTOCAP:BTC is COIN's strongest correlation driver
Why?: Crypto market sentiment flows through BTC first → COIN follows
Watch For: BTC breaking $100K could trigger COIN capitulation 📉
Ethereum (ETH) 💠
Price Action: CRYPTOCAP:ETH directional bias impacts institutional flows
Why?: ETH derivative volume is massive on COIN's platform
Watch For: ETH breaking below $3,500 = bearish acceleration ⬇️
Nasdaq 100 (QQQ) 📈
Price Action: NASDAQ:QQQ tech sector health matters
Why?: COIN correlates with tech rallies & risk-off dumps
Watch For: QQQ support breaks = COIN weakness confirmed 🔴
Fear & Greed Index 😨😊
Watch: Extreme Greed (75+) = Potential top | Extreme Fear (25-) = Potential bottom
Why?: COIN is highly sentiment-driven
Action: Lower entries during Fear zones for better risk/reward 🎰
📋 Trade Checklist Before You Enter ✅
Confirm HMA bearish alignment on your timeframe
Check BTC & ETH correlation for confluence
Position size = Max 2-3% portfolio risk per trade
Set alerts at each layer level
NEVER move SL in the red (that's a LOSS, not protection)
Secure profits on the way up (don't wait for PT)
Journal every trade (you learn more from losses)
💡 Pro Trading Tips 🧠
Size Down in Uncertainty — If volume is low, position smaller
Trail Your SL — Once profit doubles, move SL to breakeven
Partial Profits — Take 50% at $280, let the rest run to $240
Never Average-Up — Only add on confirmations going DOWN
Time Your Layers — Don't slam all orders at once; space them out
📢 Join The Community 🚀
✨ If you find value in my analysis, a 👍 and 🚀 boost is much appreciated — it helps me share more setups with the community!
#COIN #Coinbase #CryptoTrading #SwingTrade #DayTrade #TechnicalAnalysis #BearishSetup #TradingStrategy #CryptoExchange #NASDAQ #HullMovingAverage #TradingIdeas #CryptoMarkets #RiskManagement #ProfitPlaybook #ThiefStrategy #EditorPick 🚀✨

$COIN: Wave 2 correction may have been completedNASDAQ:COIN : Completed a higher degree 5-wave sequence and pulled back during the 2021-2022 bear market.
From the 2022 bottom, a new 5-wave sequence has started. Wave I and II finished in April 2025. Wave 1 completed in the most recent high and we have been in Wave 2 correction since.
This correction has reached 61.8% retracement as well as AB=CD target. It's very likely that Wave 2 correction has ended.
I added to my position.

COIN Swing Alert! QuantSignals V3 Predicts Strong Put MoveCOIN | QuantSignals V3 Swing Trade Alert (2025-11-20)
Signal Overview
Direction: BUY PUTS (Short)
Confidence: 72% (Medium Conviction)
Horizon: 15 days → Expiry 2025-12-05
Strike: $240.00
Entry Price: $17.83
Target 1: $25.50 (+43%)
Target 2: $32.00 (+79%)
Stop Loss: $12.50 (-30%)
Position Size: 2.5% of portfolio
Market Context
1W Move: -7.35% | 2W Move: -13.26%
Swing Range: $246.88 – $287.92
Technicals: Bearish momentum, RSI oversold (21.2), MACD bearish, EMAs aligned bearish
News Sentiment: Mixed → Coinbase prediction market + regulatory tailwinds, but BTC < $90k weighs on crypto stocks
Trade Rationale
Katy AI shows neutral-to-bullish bias, but overwhelming bearish technical evidence supports PUT
Price at lower swing range → high probability for continuation or controlled bounce
Elevated VIX (23.66) → increased premiums, use moderate position size
Tight stop loss mitigates premium decay and oversold risk
⚠️ Risk Warning
Oversold conditions may cause sharp reversals → monitor closely
Moderate confidence → reduce position size
BTC correlation → track crypto market closely
Coinbase double hit by weak US and Crypto sentimentCoinbase is pulling back and holding around the $238 support. If the drop doesn’t slow there, the next support to watch is around $202. The chart still looks weak, dragged down by the overall bearish sentiment across the crypto market.
From my view, Coinbase’s financials shouldn’t be heavily affected, as brokers usually make tons of money from user deposits when liquidations happen.
Another thing to add: Coinbase has secured a CASP licence from Luxembourg, making them one of the early players to obtain approval in the EU after the MiCA legislation came into effect. This should help offset the compliance pressure from the FCA in the UK dealing with AML/CTF requirement.

$1000 may be in 1-2 years?I think it's close to the bottom. It must stay above 240, otherwise all bets are off. If it turns around 240 and starts moving higher, this can turn bullish along with crypto. My target is in the range 750-1000. I am a buyer at these prices and lower.
Not a financial advice. I may change my mind anytime given the price and market conditions.

COIN bullish for EOY rallyNASDAQ:COIN fractals overlayed from the last few times when price took off from this channel as support. Following similar price action too as noticed in RSI and MACD. Turn soon? Santa rally?
PT $480 by Jan 2026

COIN - 4th wave correction in motion?As I look through my charts of US equities this morning I can find arguments to suggest that we might be seeing a decent 4th wave correction taking place. In this chart we can see some decent fib extensions and retracements adding to the arguments and some reasonably clear-cut counts. Lets see how it plays out.
$COIN updated fractal. Heading towards the gap!Each time before a run, NASDAQ:COIN made sure to fill the gaps. Following the fractal so far and heading towards the gap forming an IHS in my opinion. Great opportunity awaits!
Gap from ~ $213 - $230

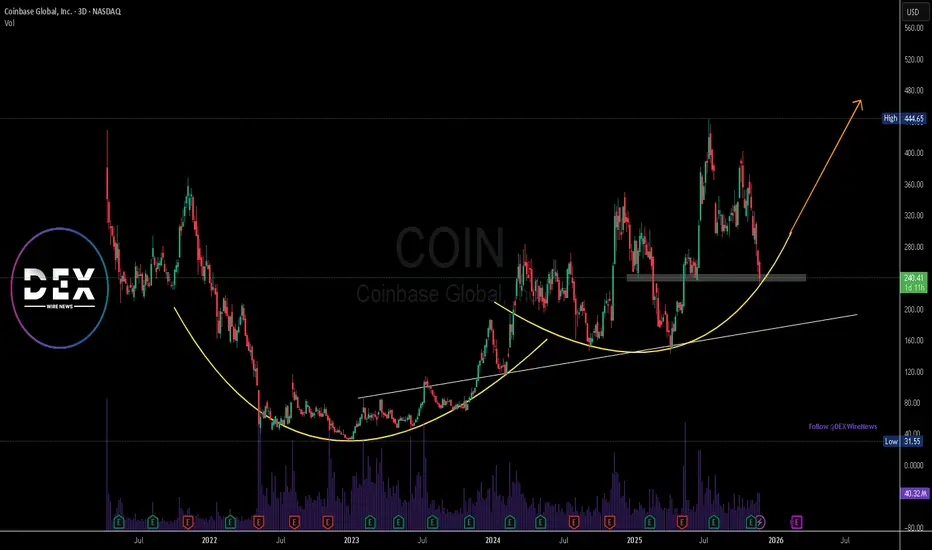
$COIN - Coinbase Down 40% From All Time HighCoinbase stock is down 40% from the all time high. The weekly chart shows the stock that had a massive run from 2023 to mid-2025, shooting from to over $440, but since then it’s been in a solid cooldown phase as crypto has pulled back.
The long-term trend is still positive, but the short-term trend is clearly down and the stock is losing momentum for now. COIN is sitting near important support levels around $250–260, with stronger support at $230–$240 range.
The Golden Zone at 0.618 Fibonacci puts us at $189 target price if things get worse. On the upside, it needs to climb back over $300–325 to show real strength again.
Bitcoin and the crypto market have dipped as well and NASDAQ:COIN is moving down with it even more dramatically since it acts like a “leveraged” version of crypto sentiment.
Overall, long-term the stock still looks solid, but short-term it’s correcting, and the key is whether it holds support around $230–240 or breaks down further. Brian Armstrong came out on MSNBC and said the Crypto Market Structure Bill is nearly done with only around 10% left before it clears committee by Thanksgiving.
We're bullish in the long run for Crypto in general. Coinbase could be the example of "during a gold rush, sell shovels."
Disclaimer:
I do not provide personal investment advice and I am not a qualified licensed investment advisor. I am an amateur investor.
All information found here, including any ideas, opinions, views, predictions, forecasts, commentaries, suggestions, or stock picks, expressed or implied herein, are for informational, entertainment or educational purposes only and should not be construed as personal investment advice. While the information provided is believed to be accurate, it may include errors or inaccuracies. I will not and cannot be held liable for any actions you take as a result of anything you read here.
Conduct your own due diligence, or consult a licensed financial advisor or broker before making any and all investment decisions. Any investments, trades, speculations, or decisions made on the basis of any information found on here, expressed or implied herein, are committed at your own risk, financial or otherwise.
Feel free to give us a follow and shoot us a like for more analysis updates.

$COIN: support zoneNASDAQ:COIN : the 61.8% retracement is $257 and AB = CD projects to $250. Whether this zone will serve as support will depend on BTC.

Coinbase ready for takeoff!!!COINBASE is looking really tasty right now! Sitting at strong support ahead of the upcoming liquidity tidal wave. Early Xmas gift my friends!

Coinbase at Support-Cancels $2B BVNK Deal as It Expands GloballyCoinbase has officially terminated its $2 billion plan to acquire the UK-based stablecoin startup BVNK, ending what could have been one of the biggest acquisitions in the stablecoin industry. The decision, reached during the due diligence phase, was reportedly mutual, though neither company disclosed the reasons behind the collapse.
If completed, the deal would have nearly doubled Stripe’s $1.1 billion Bridge buyout, positioning Coinbase as a dominant player in stablecoin infrastructure. Despite the setback, Coinbase remains aggressive in its global expansion. The exchange recently launched Coinbase Business in Singapore, a platform designed to help startups manage crypto payments, transfers, and treasury operations more efficiently.
In another strategic move, Coinbase announced plans to reincorporate from Delaware to Texas, citing a friendlier and more predictable legal climate. Chief Legal Officer Paul Grewal highlighted that Delaware’s recent legal unpredictability prompted the shift, while Texas offers “efficiency and stability” — critical traits for a company navigating evolving crypto regulations.
Technical Outlook
On the charts, COIN is forming a strong cup-and-handle pattern, signaling bullish continuation potential. Price is currently retesting the $300–$310 support zone, previously a key resistance. A successful hold above this range could trigger the next bullish leg, targeting $440–$450. Volume remains steady, suggesting investor confidence in the broader uptrend.
With the U.S. government nearing resolution of its shutdown and rate cuts anticipated in December, improving liquidity conditions could further boost Coinbase’s stock and crypto-related equities.

Coinbase: Progress and DistractionCoinbase initially made progress in line with our primary scenario, moving just below the support level at $291.50 before a notable rebound to the upside. Our primary expectation is that price will soon reverse and head down toward our magenta Target Zone between $255.42 and $173.05, where we anticipate the low of magenta wave will be established. In wave , we then expect the rally to continue past resistance at $444.65, which makes the magenta zone an attractive entry point for long positions. We still see the possibility of gains above the $444.65 resistance occurring earlier than expected. In this 30% likely scenario, we would anticipate an early wave alt. top, meaning the magenta wave alt. would already be complete. In that case, our magenta Target Zone would no longer be relevant.

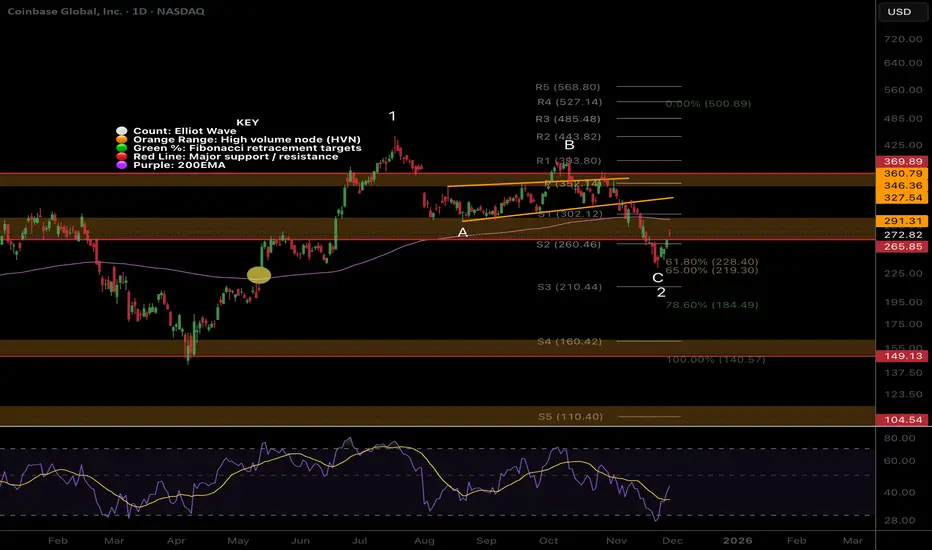
Coinbase wave C underway NASDAQ:COIN Price appears to be completing wave C of IV, a corrective pattern to the downside expected to be shallow.
Wave IV are often shallow ending no further than the 0.5 Fibonacci retracement. This is just below the S2 pivot and High Volume Node support. 0.382 is the higher probability target for the end of the downwards move aligning with a swing below the daily 200EMA and S1 pivot.
Daily RSI has room to fall.
Breaking wave B would suggest a new bull move is underway.

Coinbase And BTC Very Similar...Both have been moving from the bottom up quite similarly - fractally speaking there looks to be 5 waves up completed forming a larger wave (1) and (2) on both.
Going forward from a Bullish stance I would expect these to continue trending higher for the majority of 2026 - it's possible in the shorter term we get some more corrective behavior but I imagine it will be short lived if the bull thesis holds true.
