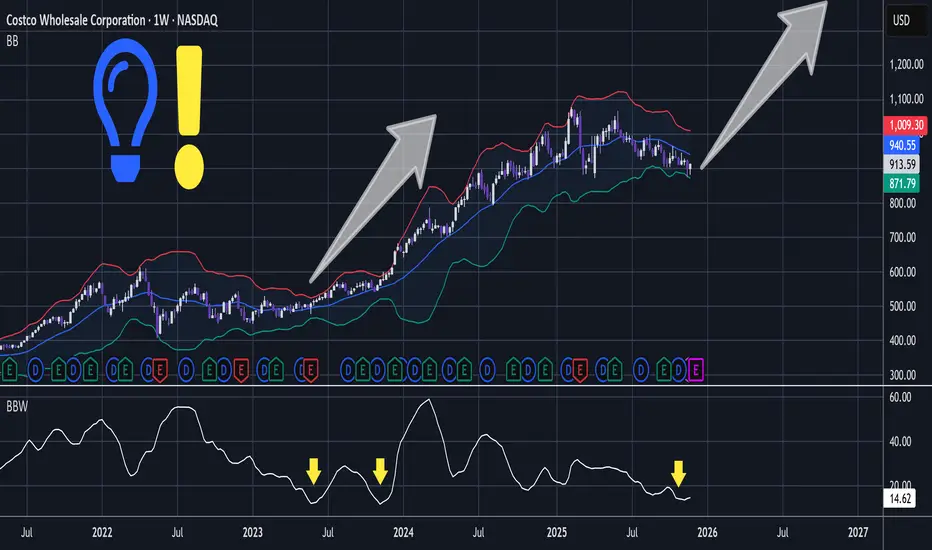
COST - Retail Powerhouse In Ideal HTF PositionShallow compressive action has printed contracting Bollinger Bands.
Notice that the BBW - Bollinger Band Width is similar to the previous correction before breakout.
In lower time frame the significantly sized slump has whipsawed through support and wedge trendline to become a bullish engulf:
T
Costco Wholesale Corp Shs Cert Deposito Arg Repr 0.020833333 Shs
No trades
Key facts today
1.25 USD
6.61 B USD
224.57 B USD
About Costco Wholesale Corporation
Sector
Industry
CEO
Roland M. Vachris
Website
Headquarters
Issaquah
Founded
1983
Identifiers
2
ISIN:ARDEUT110863
Costco Wholesale Corp. engages in the provision of operation of membership warehouses through wholly owned subsidiaries. It operates through the following geographical segments: United States, Canada, and Other International Operations. The company was founded by James D. Sinegal and Jeffrey H. Brotman in 1983 and is headquartered in Issaquah, WA.
Related stocks
$COST - Costco Showing Potential for Another Leg UpWatching Costco Here:
MACD rolling over but flattening suggesting slowing bearish momentum.
RSI sitting in the mid-40s, showing neutral to slightly oversold conditions.
Stochastic RSI curling up from oversold territory.
Holding above $896 (Fib 0.236) keeps the long-term uptrend intact.
A break bel

COST - descending channel. $870 needs to holdCOST- Stock in a descending move lower holding below the weekly trendline resistance. Stock needs to hold $870 to hold uptrend. if fails we see a big move lower. calls above $930

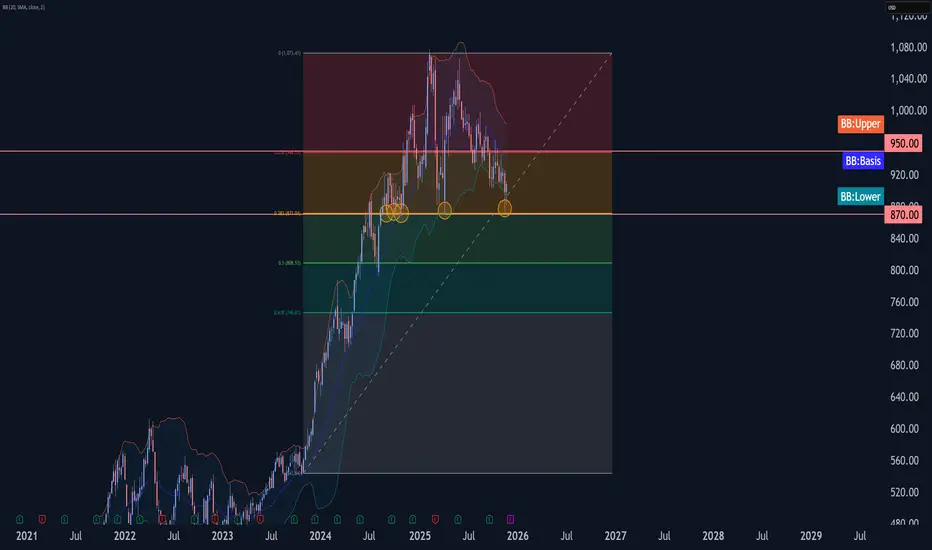
Costco Wave Analysis – 27 November 2025
- Costco reversed from support level 870.00
- Likely to rise to resistance level 950.00
Costco recently reversed from support area between the support level 870.00 (which has been reversing the price from July of 2024), lower weekly Bollinger Band and the 38.2% Fibonacci retracement of the upward
New Base and Bearish Crossover on $COSTLongTerm Swings
NASDAQ:COST , after a LongWave of +80% the ticker is facing its healthy pullback.
Bearish crossover going on with lazy action.
New Base started as well.
Waiting for a clean new LongWave Alert.

$COST
NASDAQ:COST reports earnings tomorrow.
Nov–Feb is Costco’s strongest demand cycle: holiday cooking, tight January budgets, and February home dinners.
People cook more, spend more on essentials, and bulk up for gatherings.
I expect buyers to start forming a new base soon.

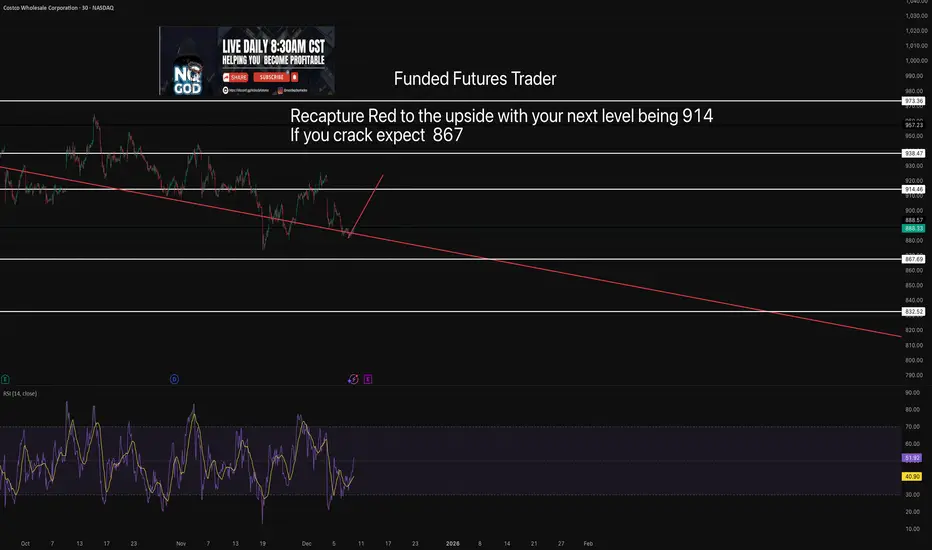
Costco Levels with TAPretty clear recapture red and youll grind to the upside if you don't you have your red to the downside which is a magent.
COSTCO may be the most durable choice in this Bear Cycle.Costco (COST) has been trading within a 17-year Channel Up ever since the 2008 Housing Crisis. Since its June 2025 High, it has been on a steady decline, contrary to the big gains of other high cap stocks (mainly tech).
During this decline, it has broken below its 1W MA50 (blue trend-line), which h

COST in BUY ZONEMy trading plan is very simple.
I buy or sell when at either of these events happen:
* Price tags the top or bottom of parallel channel zones
* Money flow volume spikes beyond it's Bollinger Bands
So...
Here's why I'm picking this symbol to do the thing.
Price in buying zone below bottom of cha

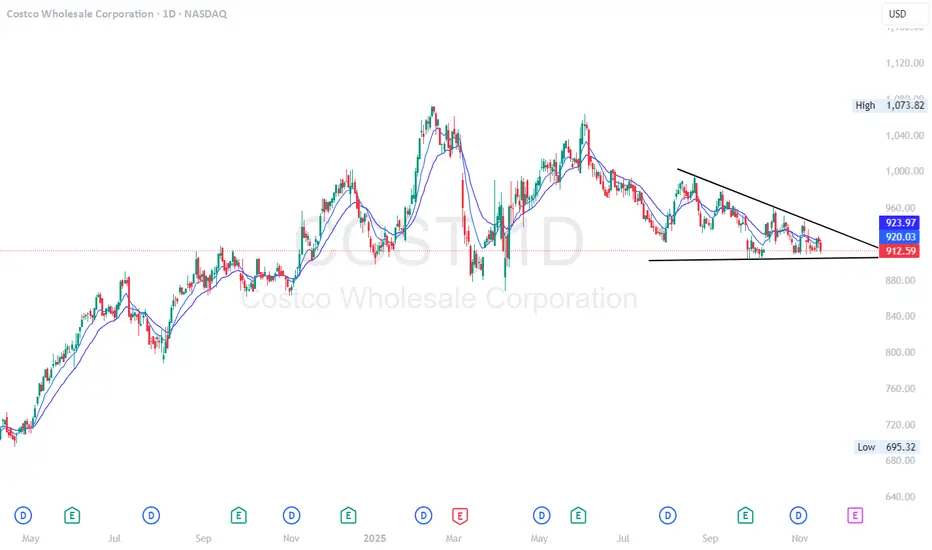
$COST - descending triangle pattern. put flow coming in strong.COST - Stock in descending triangle pattern on the daily. Seeing some big put buyers come in. Stock is weak at the indicator level. Looking for move downside below $900. Below $900 we can see $870 and $850.
See all ideas
Summarizing what the indicators are suggesting.
Oscillators
Neutral
SellBuy
Strong sellStrong buy
Strong sellSellNeutralBuyStrong buy
Oscillators
Neutral
SellBuy
Strong sellStrong buy
Strong sellSellNeutralBuyStrong buy
Summary
Neutral
SellBuy
Strong sellStrong buy
Strong sellSellNeutralBuyStrong buy
Summary
Neutral
SellBuy
Strong sellStrong buy
Strong sellSellNeutralBuyStrong buy
Summary
Neutral
SellBuy
Strong sellStrong buy
Strong sellSellNeutralBuyStrong buy
Moving Averages
Neutral
SellBuy
Strong sellStrong buy
Strong sellSellNeutralBuyStrong buy
Moving Averages
Neutral
SellBuy
Strong sellStrong buy
Strong sellSellNeutralBuyStrong buy
Displays a symbol's price movements over previous years to identify recurring trends.
COST4977644
Costco Wholesale Corporation 1.75% 20-APR-2032Yield to maturity
4.23%
Maturity date
Apr 20, 2032
COST4977643
Costco Wholesale Corporation 1.6% 20-APR-2030Yield to maturity
3.95%
Maturity date
Apr 20, 2030
COST4495548
Costco Wholesale Corporation 3.0% 18-MAY-2027Yield to maturity
3.66%
Maturity date
May 18, 2027
COST4977642
Costco Wholesale Corporation 1.375% 20-JUN-2027Yield to maturity
3.65%
Maturity date
Jun 20, 2027
See all COSTD bonds
Curated watchlists where COSTD is featured.
