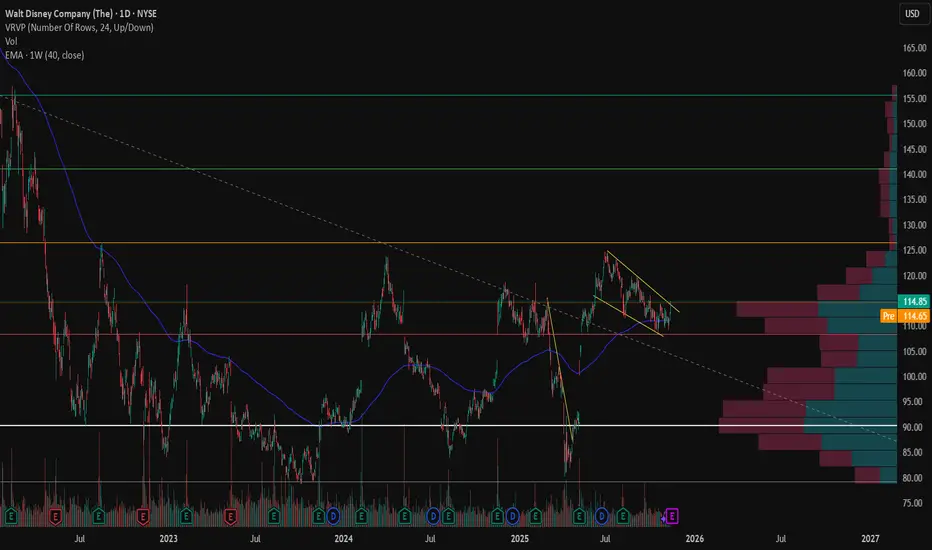
DIS FLAG BREAKOUTBouncing off the 40-week EMA, DIS broke out of a flag, just one day before the Qtr earnings. Pending the Qtr results, this could mean the start of a new leg up.
Key facts today
2.26 USD
10.19 B USD
77.40 B USD
About Walt Disney Company (The)
Sector
Industry
CEO
Robert A. Iger
Website
Headquarters
Burbank
Founded
1923
ISIN
ARDEUT110137
FIGI
BBG000FCR4K6
The Walt Disney Co. engages in the business of international family entertainment and media enterprise. It owns and operates television and radio production, distribution and broadcasting stations, direct-to-consumer services, amusement parks, and hotels. It operates through the following business segments: Disney Entertainment, ESPN, and Disney Parks, Experiences, and Products. The company was founded by Walter Elias Disney on October 16, 1923 and is headquartered in Burbank, CA.
Related stocks
Disney Is Up Just 4% YTD. What Its Chart Says Ahead of EarningsWalt Disney Co. NYSE:DIS plans to release fiscal Q4 results this week at a time when the stock has risen just 4% this year and trails the S&P 500 SP:SPX in timeframes ranging from three months to five years. Let's see what the entertainment giant's chart and fundamental analysis say.
Disney's

Disney May Face DownsideWalt Disney spent months in a narrow range, and now some traders may see downside risk.
The first pattern on today’s chart is the $108.66 level. It was the low on May 12 after positive trade news drove the broader market higher. The media giant stayed above that price until last Thursday, when it c

$DISA multi-year technical review of NYSE:DIS reveals a compelling narrative of a stock emerging from a prolonged period of consolidation. After a significant decline from its all-time highs, the stock appears to be building a substantial base, showing early technical signs of a potential major trend

Earnings,MACD,And Candlesticks-Top 3 Catalysts That Give SignalsSo in this chart NYSE:DIS we are using
👉MACD
👉Earnings Report
👉Multi-time frame
👉Candlestick Analysis
What you need know:
-
Earnings are a catalyst to price gaps also MACD shows you buying momentum.
-
Also understand candlesticks give early signals.
-
The problem is the the light green MACD h

DIS: Monthly and Earnings!My thoughts on DIS for the month and its earnings release next week.
Just thoughts, not advice of course.
Thanks for watching!

Flagging, Sitting on the 200-Day SMANYSE:DIS is at a critical technical junction:
It’s holding the 200-day MA, a key long-term support.
The descending channel suggests continued short-term pressure, but a breakout above $113–114 could confirm reversal momentum.
A bullish case would require a breakout above the upper blue trendline

DISDisney rejecting the top of its range ($120). Based on historical price action, easily could see the bottom of the range again in time (~$85). There is also some Classic bearish divergence on the weekly time frame. Same price as it was in 2015. No bueno.

Walt Disney Signs Multi-Year Deal With YouTube - Where Next?The Walt Disney Company has announced a major multi-year distribution agreement with YouTube TV, expanding access to Disney’s broad entertainment, sports, and news portfolio. The deal restores all Disney-owned networks—including ESPN, ABC, FX, Freeform, Disney Channel, and National Geographic—to You

DISNEY STOCK GOES MICKEY MOUSE'D, FALLS UNDER 52-WEEK SMA AGAINDisney (DIS) stock fallen under its major support of 52-week SMA Thursday, immediately after the company reported mixed fourth quarter results on November 13, 2025 as continued declines in its linear TV business offset strength in parks and streaming.
Disney reported revenue of $22.46 billion for t

See all ideas
Summarizing what the indicators are suggesting.
Oscillators
Neutral
SellBuy
Strong sellStrong buy
Strong sellSellNeutralBuyStrong buy
Oscillators
Neutral
SellBuy
Strong sellStrong buy
Strong sellSellNeutralBuyStrong buy
Summary
Neutral
SellBuy
Strong sellStrong buy
Strong sellSellNeutralBuyStrong buy
Summary
Neutral
SellBuy
Strong sellStrong buy
Strong sellSellNeutralBuyStrong buy
Summary
Neutral
SellBuy
Strong sellStrong buy
Strong sellSellNeutralBuyStrong buy
Moving Averages
Neutral
SellBuy
Strong sellStrong buy
Strong sellSellNeutralBuyStrong buy
Moving Averages
Neutral
SellBuy
Strong sellStrong buy
Strong sellSellNeutralBuyStrong buy
Displays a symbol's price movements over previous years to identify recurring trends.
Curated watchlists where DISND is featured.


