Telefonaktiebolaget LM Ericsson ADR Cert.Deposito Arg.Repr. 0.5 ADRs
No trades
Market insights

ERIC: quietly breaking long-term resistancesERIC’s long-, mid- and short-term trend charts are presented. ___
Prompt: New traders should take some time and carefully read the post entitled 'You can't beat the market' that is located in my profile.
Disclaimer
The author of this text is not an investment advisor. The preceding content is intended to be used for informational and educational purposes only.
It is not an advice or inducement for the purchase or sale of the products mentioned. Before making any investment based on your own personal circumstances,
it is very important to do your own research and analysis and also take independent financial advice from a professional to verify any information provided here.

ERIC B breaking 7 year max. Next level 120Be prepared for the next level of 120 SEK
If you are in... wait.
If you are out, just wait for possible retreatment until the trend line.
Options: selling puts or buying calls (if you find a good price).

ERIC: steady upward trendERIC’s long-, mid- and short-trend charts are presented.
In both the weekly and daily charts the trend continues to be rising. We remain bullish as long as the mid-term trend is rising regardless of the short-term moves. ___
Prompt: New traders should take some time and carefully read the post entitled 'You can't beat the market' that is located in my profile.
Disclaimer
The author of this text is not an investment advisor. The preceding content is intended to be used for informational and educational purposes only.
It is not an advice or inducement for the purchase or sale of the products mentioned. Before making any investment based on your own personal circumstances,
it is very important to do your own research and analysis and also take independent financial advice from a professional to verify any information provided here.

$ERIC with a neutral outlook following its earnings #BeststocksThe PEAD projected a neutral outlook for $ERIC after a Negative over reaction following its earnings release placing the stock in Drift C
If you would like to see the Drift for another stock please message us. Also click on the Like Button if this was useful and follow us or join us.

It’s 5G telecom stocks timeThe long-term charts of ERIC+NOK+LUMN and XTC index are presented.
Notice that since 2009 the three stocks have been underperforming the index while historically overperforming.
Probably the historical order of performance will be restored in the coming years.
The NYSE Arca North American Telecommunications Index (XTC) is an equal dollar weighted index designed to measure
highly-capitalized companies in the North American telecommunications industry. The telecommunications industry in North America includes
U.S., Canadian, and Mexican companies that provide telephone, long distance, cellular phone, or other telecommunications related services;
supply telecommunications equipment; or which otherwise are involved in the telecommunications industry.
Prompt: New traders should take some time and carefully read the post entitled 'You can't beat the market' that is located in my profile.
Disclaimer
The author of this text is not an investment advisor. The preceding content is intended to be used for informational and educational purposes only.
It is not an advice or inducement for the purchase or sale of the products mentioned. Before making any investment based on your own personal circumstances,
it is very important to do your own research and analysis and also take independent financial advice from a professional to verify any information provided here.

ERICSSON: 5G is here and happening!ERIC seems to be a great growth story and probably a lifetime investment opportunity with minimum risk.
Next follows the ERIC's short-term trend chart. ___
Prompt: New traders should take some time and carefully read the post entitled 'You can't beat the market' that is located in my profile.
Disclaimer
The author of this text is not an investment advisor. The preceding content is intended to be used for informational and educational purposes only.
It is not an advice or inducement for the purchase or sale of the products mentioned. Before making any investment based on your own personal circumstances,
it is very important to do your own research and analysis and also take independent financial advice from a professional to verify any information provided here.

Ericsson long Waiting for price to break resistance then pullback for entry . Bulls are here 🚀🚀🚀 Ericsson to 30$ by April


ERIC is back in playERIC is a very slow5G stock with great fundamentals and potential.
I don't hold it but watch it to come back when it wants to start moving again
ERIC moved up on earnings in october but did not hold it and come back to consolidate lower.
Now it's back, playing around 12.30-12.50 range again.
Very strong weekly chart, bullish flagging.
It can move up any time, especially now, in bullish market, favorable to tech stocks.


Rising wedge (bullish) on $ERIC hourly chartkinda liking this setup, looking for plays off the beaten path like this

nice play if you got in!but now i think its time to look for a little pullback entry, or buy on a break of the top trendline. lots of potential outcomes :)


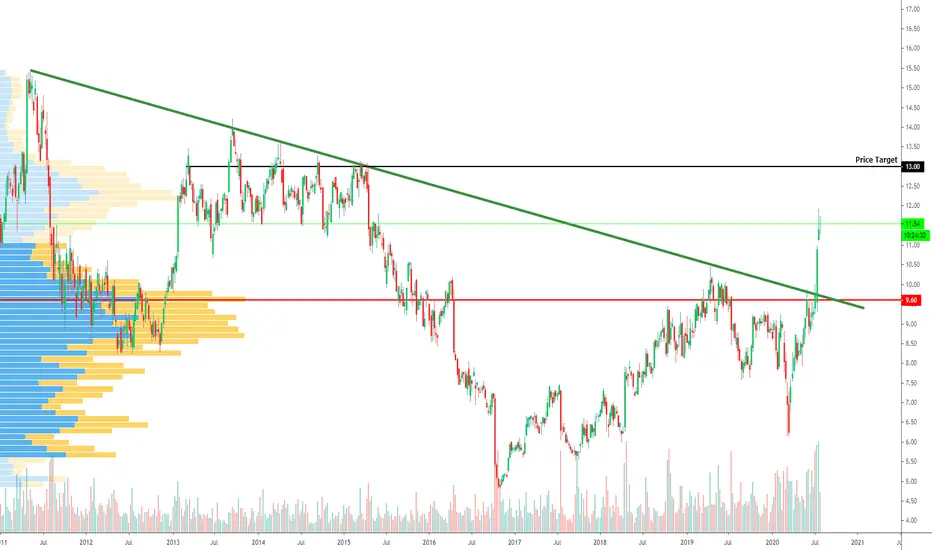
ERIC to Long, Breakaway GapCondition:
1. Downtrend line was broken by breakaway Gap
2. Runaway Gap in Uptrend. It shows 40% in the trend.
Entry 11
Stop: 10
Target: 17; reward:risk=7:1
I am not a PRO trader. I need few months to practice trading strategies.
If you like this idea, please use SIM/Demo account to try it, until my trading plans get high winning rate.
In my past Runaway Gap trades, 70% reached the final 100% target.
Plans reached final target:
1. ROKU 3/26/2020
2. ROKU 6/8/2020
3. GM 3/31/2020
4. MGM 3/31/2020
5. WYNN 4/2/2020
6. SQ 4/6/2020
7. ABT 5/15/2020
Plans did not reach final target:
1. PEP 6/9/2020
2. AAL 6/10/2020
3. BMY 6/8/2020


Ericsson looking bullish? Possible target SEK 148?Ok let's do some crazy predictions!
ERICSSON has been forming a cup and handle over the last few years. Doing a cup and then a perfect retrace (handle) to the 0.618 fib.
The resistance of this cup has recently been broken and is now being retested (red circle).
Now, the conservative next target is the resistance area around 118 (orange circle). HOWEVER (here comes the crazy part), if we take the low and the high of the cup (96-44) and we add that to the top of the cup (96), we get a target of SEK 148,-!!!. Which happens to be exactly the next major resistance area (green circle).
This scenario might take years to play out though, as has the cup and handle formation. However, interesting enough to show you.

Ericsson, looking for a buying opportunity So looking on the monthly chart we see that despite covid, Ericsson nicely held it's long term upward trendline.
Furthermore, it broke through some pretty tough resistance with a big green candle this month.
All great signals for a continued long term upward trend.
So what do I want to see for a good buying opportunity?
- A retest of the horizontal resistance now turned support. (orange arrows)
- Possibly with another touch on the blue trendline. (orange arrows)
- Then on the lower timeframes a bullish candle pattern to confirm support at the mentioned support area.
NB. There is a gap still at 87.65, let's see if this might come into play.


Lets Hit the Sweden Stock This time LM EricssonBy the time i see this with " Long Buy Long Sell Indicator " The buy move that is the LONG move in 4h timeframe has already been started.
This move will continue for another 4 trading session the reason is the below STRENGTHMETERS are really good .
It makes good sense to enter long and avoid short at this time as the price is uptrending .
hit me likes and comments will come up with another idea.
The LBLS indicator for your reference is here

$ERIC Ericsson Spikes on 5G Deal
Nice breakout from bull-flag.
MACD in bullish reversal as Histogram
ticks higher.
RSI crossed Mid -Point
Volume increasing as a result of new deal.
PLEASE GIVE US A LIKE IF YOU FIND OUR CONTENT HELPFUL, THANK YOU.
