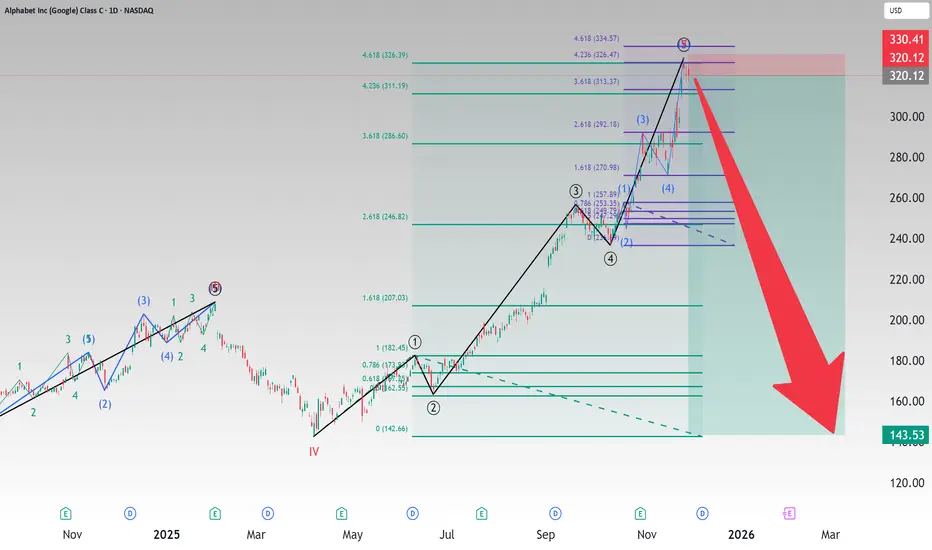
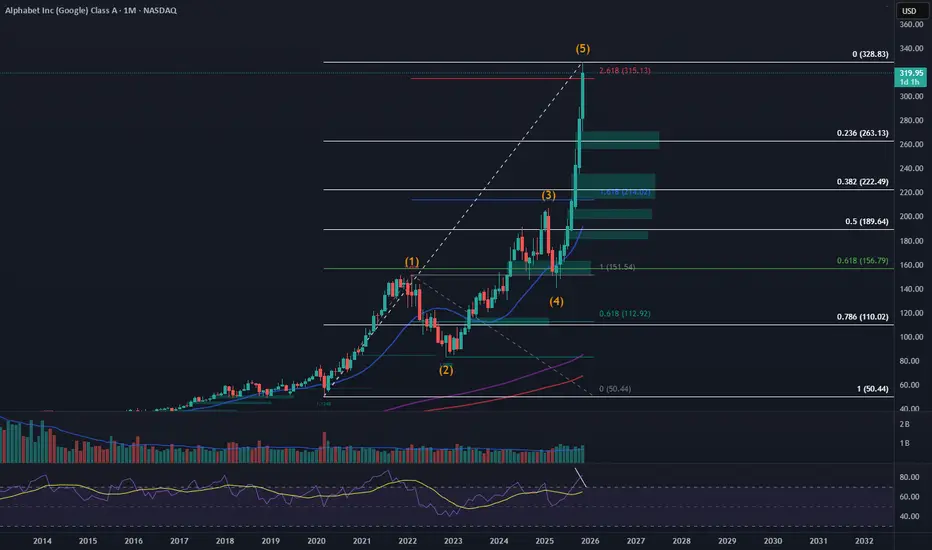
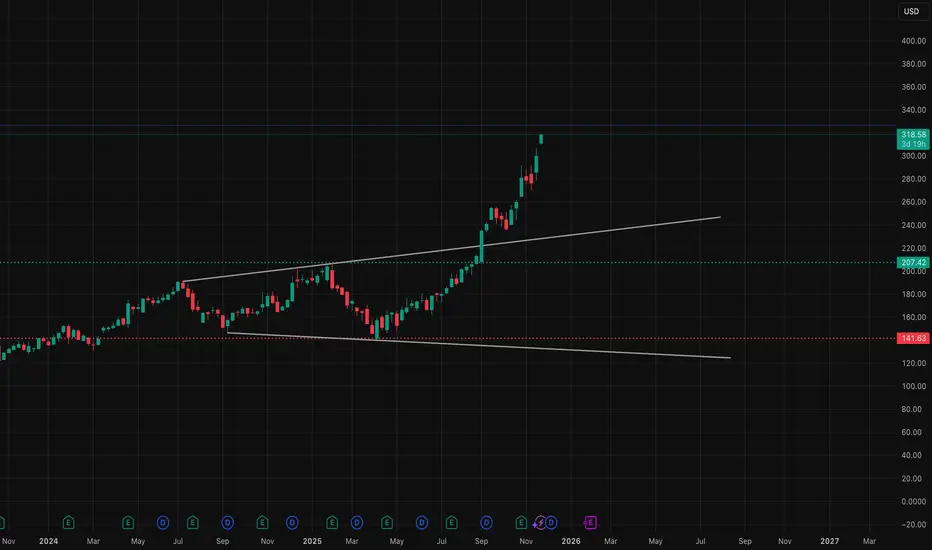
Google Short: 5-waves completion with Fibonacci ExtensionsOver here, I want to discuss the possibility that Google has peaked. I know that I am going against Berkshire Hathaway. But then, we can really confirm if the latest decision is really made by Warren Buffett given that he has also recently announced his retirement? And Charlie Munger is no longer with him.
Of course, I've always given my analysis based on Wester TA (chart patterns), Japanese TA (Candlesticks), and Elliott Waves. And over here, I present to you the potential 5-waves that might have completed on Google. And that is supported by 2 Fibonacci extensions:
1. From Primary Wave 1 across the entire wave, and
2. From Intermediate Wave 1 of 5 across entire Primary Wave 5.
But these are not certainties but probabilities and most importantly, risk-reward.
For this idea, the stop is most important: slightly above the All-time-high: $328.67. I would say that you can put the stop at $329 or $330. If Google goes beyond and makes new ATH, then this idea can be trashed.
The take profit is at the previous wave 4 of a higher degree, or the low made on 7th April 2025: $142.66.
Good luck!
Alphabet Inc. Shs A Cert Deposito Arg Repr 0.01724138 Shs
No trades
Market insights
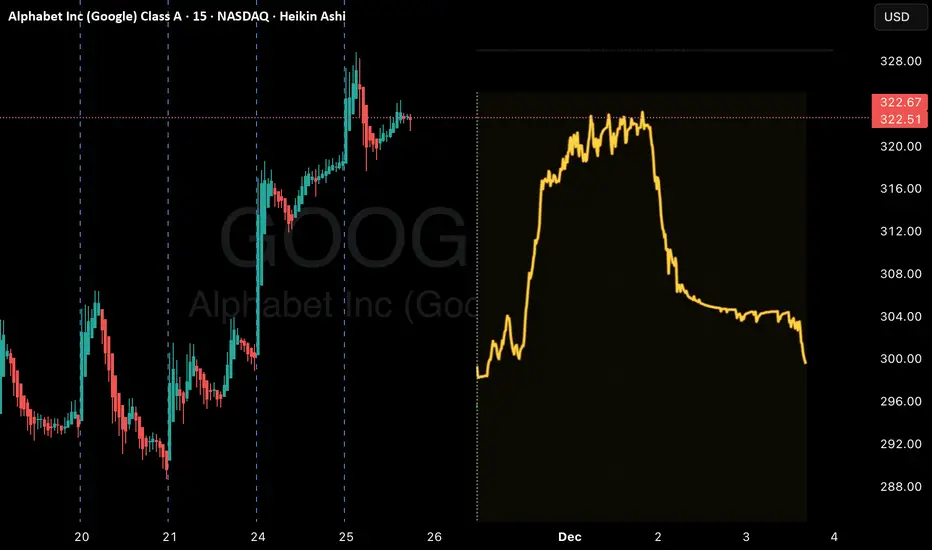
GOOGL · Dec 1–5 OutlookStretched Rally Meets Heavy Supply — Time for a Pause?
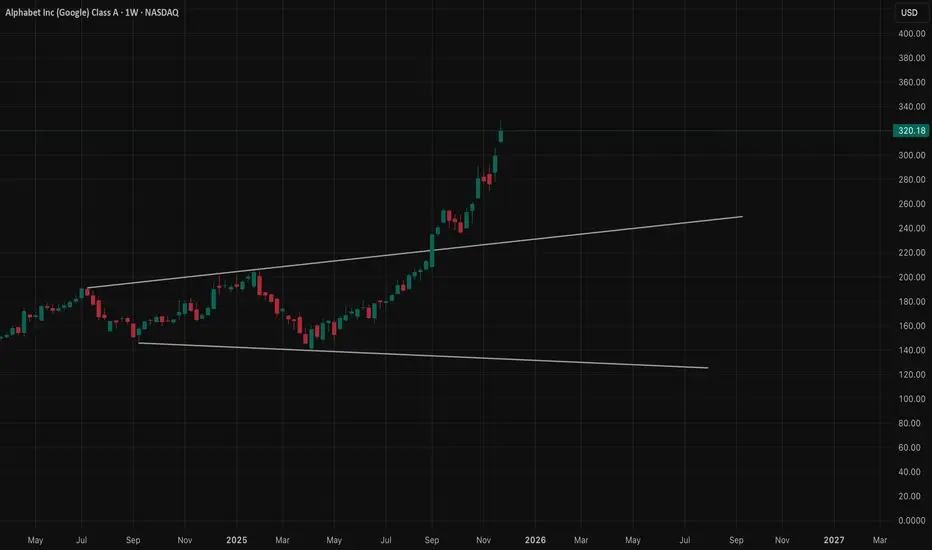
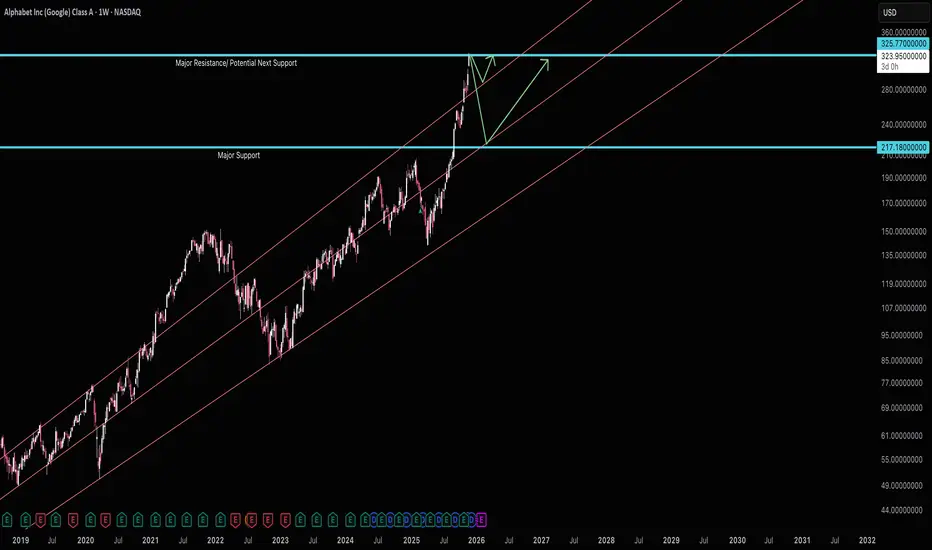
Weekly timeframe (bigger picture mood)
The weekly chart shows a monster trend. GOOGL has been riding this rising channel almost perfectly, and now price is pushing into the upper half of the channel where historically the momentum starts slowing. Candles are still green, but the bodies are getting smaller — that’s usually the market showing fatigue, not reversal.
Uptrend still intact, but the push is getting harder.
Daily timeframe (where the slowdown becomes real)
The daily chart lands right inside a clean supply zone around 323–332. Every attempt to break above that zone leaves long wicks. That’s not bearish yet — it just means sellers are active.
Volume dips here confirm one thing:
Buyers are getting tired exactly where sellers finally have the upper hand.
Whenever a strong weekly trend pushes into daily supply and stalls, that’s usually the stage before:
* a pause
* a pullback
* or a sloppy sideways grind
Not reversal… just cooling pressure.
1H timeframe (early crack in momentum)
This is where the weakness shows clearly.
Price tried to break supply, failed, and started forming lower highs directly underneath the ceiling.
That’s how uptrends slow: first the momentum dies, then structure breaks later.
There’s a small CHoCH on the 1H, meaning the market tested the bullish side and then flipped short-term control back to sellers. Trendline is still holding — but barely.
Whenever the 1H starts doing this under daily supply, the bulls usually need a “rest day.”
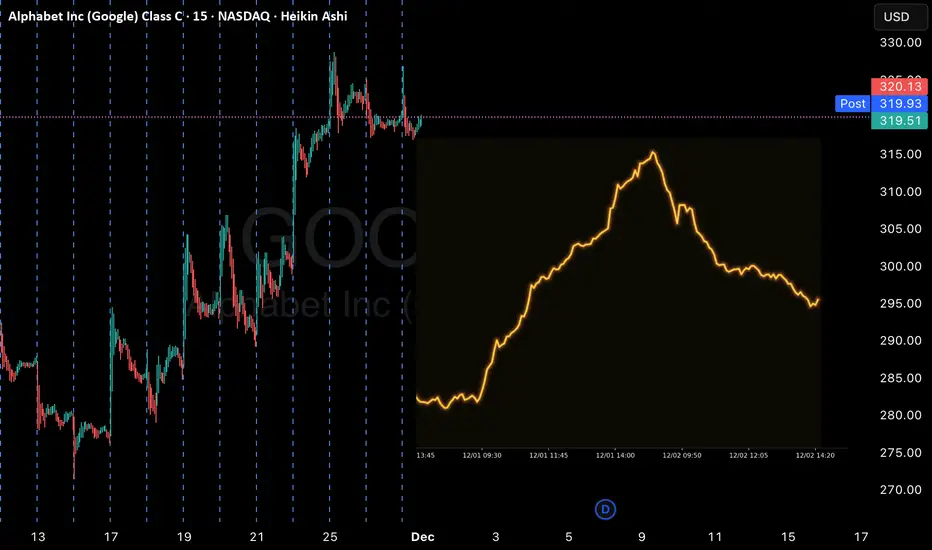
15m timeframe (the truth surface)
The 15m chart shows the “real” story before everyone sees it:
* Repeated rejections at the same zone
* Break of structure downward
* Retests failing
* And smaller and smaller bounces
This is the type of compression pattern that usually breaks to the downside first before anything else.
The 15m broke early.
The 1H is bending.
The daily is in supply.
The weekly is stretched.
The pieces fit.
How GEX confirms all of this
The GEX chart adds the final piece of evidence.
No need to hype — just simple cause & effect:
Major call-wall cluster: 327–335
This is thick resistance from hedging flows. Market makers get forced to hedge against upside when price enters that region, which creates downward pressure.
And guess what?
That zone lines up EXACTLY with the daily supply and the rejection levels on 1H and 15m.
Major put-magnet cluster: 312–310
Below, the heaviest put-weight sits around 312–310, which acts like a magnet if price loses 315.
So the GEX map basically says:
* “Upside is heavy and expensive near 327–335.”
* “Downside is easier if 315 breaks.”
Perfect confirmation to the TA.
Trade ideas (based on structure + GEX)
These are not signals — just how a trader would think based on the levels.
BULLISH SCENARIO (only if strength proves itself)
Trigger: Must reclaim 326 with a clean push + retest.
If that happens:
Targets:
* 330
* 332 (end of the supply zone)
* 335 (GEX wall — tough to break)
Safer call-side idea (for Dec 6 expiration):
* 325c / 330c spread
Tight risk, matches GEX resistance.
Aggressive idea:
* 330c, but only if 326 breaks with volume.
BEARISH SCENARIO (more likely unless buyers show strength)
Trigger: Break below 315
This opens the easier path where both TA and GEX want price to go.
Targets:
* 312
* 310
* 305 (if panic selling kicks in)
Put-side idea (Dec 6 expiration):
* 315p / 310p spread
Cheap, logical, and matches the GEX magnet.
Aggressive:
* 310p, aiming for the magnet flush.
NEUTRAL / SCALP IDEA (for those who don’t want directional risk)
Inside the 323–332 supply zone:
* Short calls above 332
* Short puts above 315
…because price is likely to chop until one side breaks.
This reflects the actual structure: compression between supply and short-term support.
My overall view for the week (Dec 1–5)
Everything points to a cooling week, not a runaway rally. Buyers have pushed hard for weeks, and GOOGL is finally running into an area where sellers care again.
Unless 326 breaks clean, this week favors:
* A pause
* A pullback
* Or a choppy range with bearish lean
Break of 315 = quick drop.
Break of 326 = one more push.
Disclaimer
This is not financial advice.
Educational analysis only — always manage risk according to personal trading rules.
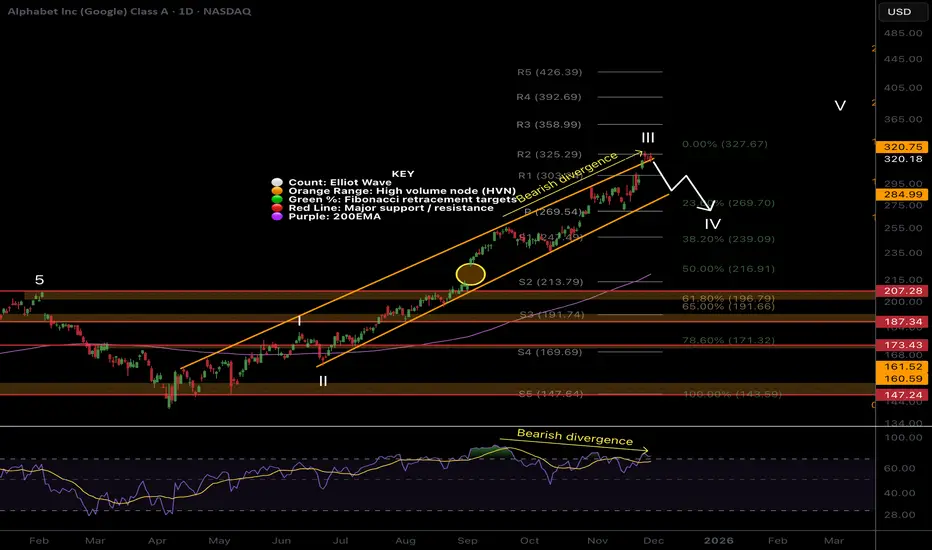
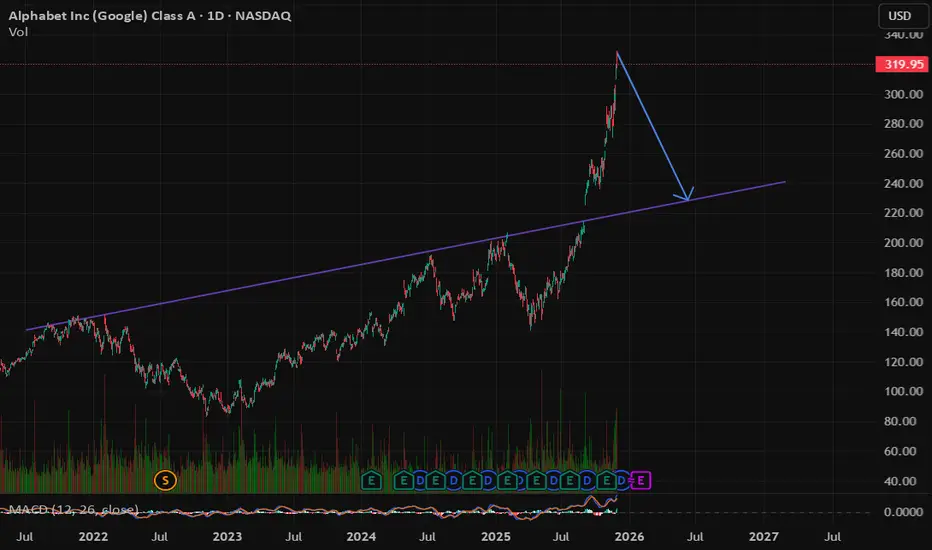
Google still going up in wave but hit 1.618 extensionNASDAQ:GOOGL Wave III continues, price looks exhausted but just won’t stop rewarding investors. It may trap late trend-chasing investors, causing them to capitulate lower.
Wave (5) of III is likely to complete with a throw-over of the upper channel boundary. Wave IV now has an expected retracement target of the 0.236 and daily pivot, $269. The gap remains unfilled.
📈 Daily RSI has printed a bearish divergence from overbought for weeks.
👉 Continued upside has a target of the R3 pivot
Safe trading
GOOGL Stock Forming a BIG Pattern — Key Levels You MUST Watch!In this video, I break down a clear chart pattern forming on GOOGL (Alphabet) stock, using detailed technical analysis.
You’ll see exactly how the pattern developed, what levels matter right now, and where the stock could move next.
🔍 What’s Covered in This Analysis:
GOOGL’s current chart structure
Clear pattern formation (triangle / channel / flag / wedge — based on your chart)
Key support & resistance zones
Breakout / breakdown levels
Trend strength and momentum
Short-term price targets
Medium-term technical outlook
Risk levels & invalidation points
📈 Why This Matters
Alphabet (GOOGL) is showing a highly tradable technical setup, and understanding this chart pattern can help you spot the next big move before it happens.
Perfect for:
Day traders
Swing traders
Long-term technical investors
Anyone following large-cap tech stocks

Alphabet (NASDAQ: $GOOGL) Stock: 2025 Continues BullishAlphabet’s stock continues its remarkable performance in 2025, surging nearly 70% year-to-date as strong fundamentals and aggressive AI expansion fuel investor confidence. Much of the momentum comes from Alphabet’s rapidly growing cloud division and the continued rollout of Gemini, its advanced AI model powering enterprise workloads, search upgrades, and next-generation productivity tools. This expansion has pushed Alphabet’s market valuation close to $4 trillion, establishing it as one of the fastest-growing mega-caps this year.
Another major catalyst is Google’s deepening presence in India’s digital infrastructure. The Adani Group recently announced a $5 billion co-investment with Google to build a large-scale data center aimed at supporting India’s rising cloud, AI, and storage needs. This move comes shortly after Google committed $15 billion to an AI-focused data center cluster in Andhra Pradesh. Together, these investments reinforce Alphabet’s expanding footprint across one of the world’s fastest-growing markets and strengthen long-term revenue prospects.
From a technical standpoint, GOOGL remains strongly bullish after breaking above a long-held ascending trendline that acted as multi-year resistance. The breakout triggered a sharp rally, pushing the stock to the current price around $320. Momentum indicators show extreme strength, with the MACD at record highs and RSI firmly overbought—signals that suggest the uptrend remains intact but may face volatility.
The next psychological resistance sits at $350, a level traders will watch closely. On the downside, immediate support lies at $291, followed by a stronger structural zone at $255. As long as price stays above the former trendline and these supports, the broader bullish structure remains dominant.

GOOG Weekly CALL Alert — Early-Week Momentum Play ActivatedGOOG QuantSignals V3 — Weekly Signal (2025-11-28)
Expiry: 2025-12-05 (7 Days)
Instrument: GOOG
Current Price: $319.97
Direction: CALL (LONG)
Confidence: 60% (Medium)
Risk Level: ⚠️ MODERATE
📈 Signal Details
Strike Focus: $320.00 (ATM, 0.513 Delta)
Entry Range: $5.60 – $5.70 (mid $5.65)
Target 1: $9.04 (+60%)
Target 2: $12.43 (+120%)
Stop Loss: $2.83 (-50%)
Position Size: 2% of portfolio
🧠 Katy AI Analysis
Predicted Move: $319.97 → $333.48 (+4.22%) by Dec 1 afternoon
Trend: Bullish momentum building despite initial NEUTRAL label
Sustained Levels: Above $325 through Dec 2
Time Series: Clear gradual upward trajectory
AI Confidence: 60%
📊 Technical & Market Context
Weekly Momentum: +0.33% (Neutral)
Weekly Range Position: 90.2% high
VWAP: $321.97 (resistance)
Support: $315.17 (stop loss)
Resistance: $325 – $330 zone
MACD: Bullish confirmation
News Sentiment: Mixed tech headlines, AI bubble concerns, potential oversold bounce
Options Flow: Neutral PCR 1.00; unusual activity at $175 put is protective hedging
Gamma Risk: Low
⚡ Trade Setup & Strategy
Why This Trade: Katy AI reveals bullish momentum not captured in NEUTRAL summary
Timing Advantage: Entry near weekly high → early-week upside capture
Risk Mitigation: Tight 50% stop, balanced delta selection reduces gamma risk
Google at record highs but Wave 3 cluster/RSI screams pullback!Alphabet is leading the Magnificent Seven, hitting record highs near $330, while most AI and growth stocks, including Nvidia, have stalled. Since launching Gemini 3 in mid-November and with news of a $4.9 billion Berkshire stake, Alphabet has rallied more than 135% off its April low, outperforming all Big Tech peers in 2025.
But Alphabet is at the 161.8% Fibonacci extension of its long-term move and long-to-medium-term move, which matches a textbook Elliott Wave 3 cluster completion. RSI is at an extreme 83 on the weekly, hinting a Wave 4 pullback to $288 could be next, even as the macro backdrop (Gemini 3 AI buzz, Fed rate cut hopes, and demand for Google’s AI chips from Meta) stays strong. Ultimately, a final Wave 5 could extend up to $380-$400.
Key drivers:
Gemini 3 launch positions Alphabet as an AI leader, topping major multimodal benchmarks.
$4.9B Berkshire stake signals major institutional confidence.
Meta seeks Google’s TPU chips, boosting Alphabet’s AI hardware story while pressuring Nvidia.
Fed rate cut odds above 80% further support growth stocks.
Elliott Wave/technical structure aligns with a potential $288 pullback before any push to $380.
Will Alphabet finally pause after eight explosive months, or does the rally have further to run?
Let us know your view and Elliott Wave count in the comments, and follow for more big-picture, technical-plus-macro trade ideas!
This content is not directed to residents of the EU or UK. Any opinions, news, research, analyses, prices or other information contained on this website is provided as general market commentary and does not constitute investment advice. ThinkMarkets will not accept liability for any loss or damage including, without limitation, to any loss of profit which may arise directly or indirectly from use of or reliance on such information.

How to Use Simple Moving Averages (SMA) to Predict Price TargetsIn this video, you’ll learn exactly how to use the Simple Moving Average (SMA) to find both short-term and long-term price targets.
I explain which SMA settings work best, how to spot trend direction, and most importantly:
When you should take a trade and when you should stay OUT of the market to avoid losses.
What You’ll Learn:
How the Simple Moving Average works (SMA 9, 21, 50)
How to use SMA for short-term and long-term price targets
Best SMA crossover strategies
When to enter a trade using SMA
When to stop trading / avoid traps
How institutions use SMA to set levels
Tips to improve your accuracy and timing

Alphabet (GOOGL) – Completing a Major Elliott Wave Cycle at 2.61Alphabet has reached the 2.618 Fibonacci extension of the entire macro impulsive structure, marking a potential completion of Wave (5) on the monthly timeframe. Price extended aggressively from the Wave (4) low and is now interacting with a historically significant Fibonacci exhaustion zone.
RSI also shows signs of potential macro divergence in daiy timeframe.
can be a nice short from heresuper extended movement here, the run is very likelly to dump soon in my opinion
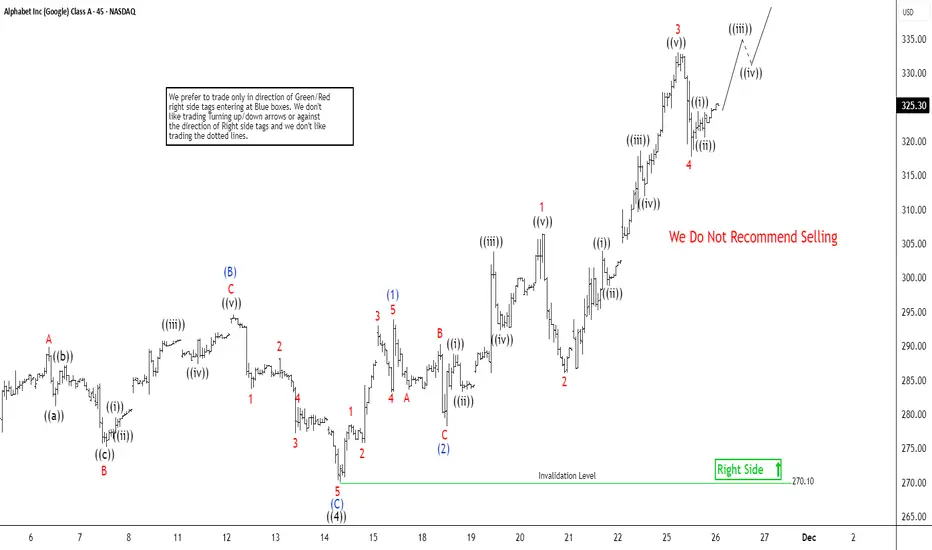
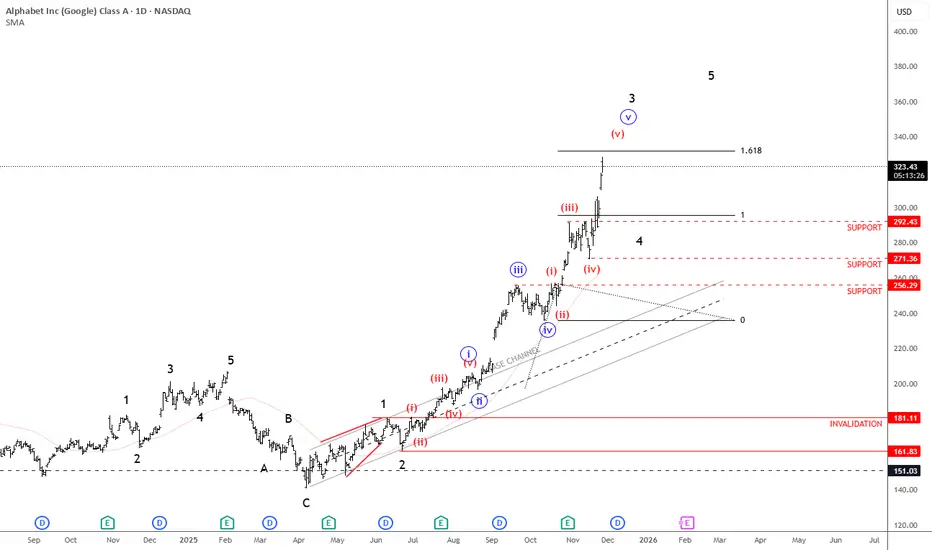
Google Stock (GOOGL) Approaches Historic Peak, $336 in SightThe short-term Elliott Wave view in Google (GOOGL) indicates that the stock is progressing within the final wave ((5)) of the impulsive rally that began from the April 2025 low. Wave ((4)) of this sequence concluded at $270.1, as reflected in the 45-minute chart. Following that completion, the stock resumed its advance toward new all-time highs, unfolding wave ((5)) as a five-wave impulse of lesser degree. From the termination of wave ((4)), wave (1) reached $293.95, while the corrective pullback in wave (2) settled at $278.2. The structure then nested higher into wave (3), reinforcing the bullish momentum.
From wave (2), wave 1 advanced to $306.42, followed by a modest dip in wave 2 that ended at $286.05. The third wave extended strongly, culminating at $332.98, before a corrective decline in wave 4 brought prices down to $317.65. The expectation now is for the stock to extend higher once more, completing wave 5 and thereby finalizing wave (3) of the larger degree. Afterward, a corrective phase in wave (4) should emerge, setting the stage for another rally in wave (5). This final advance would complete wave ((5)) and the broader cycle from the April 2025 low.
In the near term, as long as the pivotal support at $270.1 remains intact, dips are anticipated to find support within the typical three, seven, or eleven swing corrective structures. This suggests that the broader outlook continues to favor further upside, with each corrective phase offering opportunities for continuation of the bullish trend.
GOOG — Key Support 161; Bullish Extensions Toward 570.31Here’s a polished, TradingView-ready analysis in English — proofread and ready to publish — with key support set to 161 as you Alphabet (GOOG) is in a clear uptrend after a sustained bullish leg. Price is currently finding resistance near the short-term Fibonacci cluster, but the broader structure remains constructive while key support holds.
Key structural level: 161 — this is the primary long-term support / accumulation zone on the chart. As long as price stays well above 161, the bullish scenario stays valid.
Upside targets (Fibonacci extensions):
0.40 → 315.77 (near-term resistance)
0.50 → 358.19
0.618 → 408.20
0.75 → 464.25
0.90 → 527.89
Final target → 570.31
Price context: The market is showing momentum, but must break and hold above the immediate resistance cluster to accelerate the next extension. A series of higher highs and higher lows would confirm the continuation toward the targets above.
Alternative Scenario
If the current bullish reaction fails and selling pressure increases, expect a deeper retracement toward the structural support at 161. That zone represents the strongest demand area and liquidity base; a successful re-accumulation there would preserve the longer-term bullish thesis and improve reward-to-risk for buyers targeting the extension levels.

Got Microcaps?Sure the market is whipsawing up and down, the VIX is comparatively high, and the Head and Shoulders pattern on Bitcoin and SPY looms large. But... have you checked out IWC, the ETF that tracks an index of microcap stocks? They have performed in line with other indexes, but today this ETF is up two and a half percent, while QQQ and SPY are plodding higher at less than one percent.
Looking for setups on small caps and micro caps might be a worthwhile addition to your trading tactics from now until the end of the year.
GOOGL Long Alert: Katy AI Projects Upward Push AheadGOOGL QuantSignals Katy 1M Prediction 2025-11-25
Direction: LONG
Entry Price: ~$322.51
Target: ~$323.93
Stop Loss: ~$317.67
Confidence: ~55%
Trend: Neutral-to-slightly bullish
Volatility Estimate: ~24.1%
📊 TradingView Insights & Technical Context
According to recent Trade Ideas on TradingView:
GOOGL broke above a long-term ascending trendline resistance, which signals structural bullishness.
TradingView
+1
Some analysts highlight key resistance zones around $313–316 (or higher depending on update) and support around the $300 mark.
TradingView
+1
On the chart: price is in a consolidation/accumulation phase after previous strong trends. Some analyses suggest this phase precedes the next leg higher if key levels hold.
TradingView
+1
Fundamental driver: The company continues investing heavily in AI, cloud, infrastructure which supports the bullish narrative. (Though this is general market commentary, not specific to the trade setup).
⚠️ Risks & Considerations
Trend is labelled “Neutral” in your summary, so upside is modest. The target (~$323.93) is only ~0.5% above the entry — means limited upside relative to potential risk.
The quoted volatility (~24.1%) suggests the stock could move significantly, both up and down, so managing stop-loss is key.
Market technicals hint at major resistance zones; if the stock fails to clear them the upside could stall.
Even strong fundamentals don’t guarantee short-term movement especially when the trend is neutral or the trade horizon is short.
🧭 Why the Title Works
“Long Alert” is appropriate given the bullish bias, albeit moderate.
“Katy AI Projects Upward Push Ahead” links the trade to your AI-driven signal model (Katy AI) which adds thematic weight.
Alphabet Into $325 ResistanceGoogle/Alphabet has ripped through 217 and now at 325. The trouble with a fast move like this is there's heavy money looking for reversion to the mean. We are very far form any long term trend lines and up above the post-covid maximum trend line. Holding onto GOOG/GOOGL is highly risky here.
Major resistances like $217 almost always get checked back into so the risk of $217 is very high. I know google's revenue has been showing signs of accelerating, but not at fast enough rates that make me think it can fully avoid hitting 217.
So short resistance here 325 targeting 217.
Good luck!
Google Is In Strong Bullish Trend; Unfolding A Five-Wave ImpulseAlphabet (Google) is a huge tech company best known for its search engine, but it also makes things like Android, YouTube, Gmail, and cloud services. Google is pushing hard into AI and cloud computing. They’re rebuilding search with AI, making stronger chips, and growing Google Cloud fast. They’re also investing in long-term tech like self-driving cars and quantum computing.
Google is in a very strong uptrend as expected, but we can now count five waves up within the black wave three cycle from around 160. Ideally, the next pullback would be wave four, stabilizing near the previous fourth-wave area around 292–271. And once or if we see that kind of correction, that's when new buying opportunities could appear, but for now, it’s better to stay cautious since we may already be in the later stages of this cycle.
Highlights:
Trend: Strong uptrend, but nearing late stages of wave three
Potential: Pullback in wave four before continuation higher
Support: 292–271 zone
Invalidation: Below 200
Note: watch for a correction before new long setups
GOOGL long-term TAGoogle is strictly bullish on long-term, is one of the best survivors in tech sector at the moment during this market correction. But be aware of the negative divergence on mid-term, the negative correlation between price and volumes accumulation has been building up recently, which means eventually the correction will occur and then it could be a wise stock to pick up.

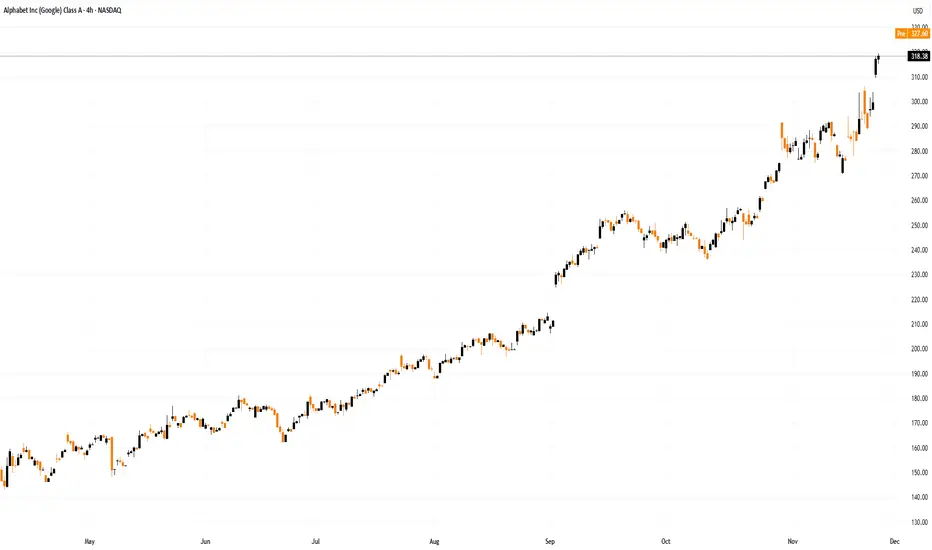
Alphabet (GOOGL) Shares Close Above $300 for the First TimeAlphabet (GOOGL) Shares Close Above $300 for the First Time
Charts show that Alphabet (GOOGL) shares have reached a record high, closing around $318. In doing so:
→ the price has surpassed the psychological $300 mark;
→ the stock has gained roughly 70% since the start of the year;
→ Larry Page has become the world’s second-richest person, after Elon Musk.
Why Have Alphabet Shares Risen?
The surge is explained by several factors, the most significant being news of strong performance in tests of the AI model Gemini, upgraded to version 3.0. In many benchmarks, it outperformed ChatGPT.
The rise in GOOGL’s share price seems to signal a shift in leadership in the “best AI” race — which could translate into higher sales of paid Gemini versions and increased revenue for Alphabet, which already exceeds analyst expectations, as confirmed by the report released in late October.
Technical Analysis of GOOGL Shares
Price movements have formed an ascending channel (shown in blue), originating in the summer of this year. Along the way, the price recently encountered resistance around:
→ $290: acting as a barrier following the earnings release;
→ $300: a psychological hurdle, as investors were hesitant to pay over three hundred dollars per share.
These levels had kept the price in the lower half of the channel. Now, with GOOGL’s fundamentals strengthened, the stock has reached the channel’s median — typically a point where supply and demand balance. It is reasonable to assume that:
→ the bullish momentum may begin to ease;
→ in the event of a correction, the $290–300 zone may shift roles to act as support, reinforced by the channel’s lower boundary.
This article represents the opinion of the Companies operating under the FXOpen brand only. It is not to be construed as an offer, solicitation, or recommendation with respect to products and services provided by the Companies operating under the FXOpen brand, nor is it to be considered financial advice.
GOOGL skyrocketed with the launch of Gemini 3
The new LLM model, Gemini 3, unveiled last week, has garnered positive reviews. Salesforce founder Benioff, who used ChatGPT daily for three years, stated that after using Gemini 3 for about two hours, he has no intention of returning to ChatGPT. Google's share of the AI market has significantly increased, rising from 23.4% before the launch of Gemini to 30.1% afterward.
Altman is also wary of Gemini. Referring to Google's recent AI achievements, he acknowledged that the internal atmosphere at his company might be uneasy for some time and that Google could present a temporary economic headwind to the firm.
GOOGL maintains its steep uptrend, approaching the ascending channel’s upper bound and the resistance at 320.00. Diverging bullish EMAs point to a potential uptrend extension.
If GOOGL breaches above the channel's upper bound and 320.00, the price may advance toward the new high and psychological resistance at 330.00.
Conversely, if GOOGL fails to close above 320.00, the price may temporarily retreat toward the following support at 300.00.

GOOGL Breaking Out Again? Key Levels This WeekWeekly timeframe:
GOOGL is in one of the strongest momentum runs in the market right now. Price just pushed above the previous weekly resistance around 315 and is now trading in open space with very little historical supply until the 325–330 zone. The weekly structure is still a clean higher-high, higher-low sequence with strong trend continuation. As long as price holds above 295, this weekly bullish trend remains intact. The only concern here is the speed of the move — this candle is extended and approaching the upper channel line, which often leads to a short-term pullback before continuation.
Daily timeframe:
The daily chart shows a clear breakout from the rising channel after a BOS move and retest. Buyers defended the 300 area multiple times, creating a strong demand zone below. Current price is sitting inside a small supply zone around 320–327, which has potential to reject short-term, especially after a fast run. If buyers maintain control above 310, continuation toward 330 is likely. A rejection back under 310 opens the door toward 300–295 demand for a healthier pullback.
1-hour timeframe:
Short-term momentum still favors upside, but price looks stretched. The last push created a BOS into supply, and volume is slowing. If 315 holds as intraday support, we could see another attempt toward 325–330. If 315 fails, watch 310 first, then 305 for deeper retracement levels.
GEX sentiment:
Options positioning is supporting the bullish scenario. The highest positive GEX levels sit around 320–330, acting as a magnet. Below, the strongest put support sits near 295. This creates a favored range between 310 and 325 for the short term. As long as price stays above 310, market makers have incentive to keep price elevated.
My thoughts:
GOOGL remains one of the cleanest trending names right now. The weekly structure suggests continuation, but the lower timeframes show exhaustion. Best opportunities likely come from pullbacks rather than chasing highs. Watching for either a breakout retest above 320 or a dip toward 310 for a higher low setup.
Conclusion:
Bullish overall trend
Upside target 325–330
Support zone 310–305
Major support 295
Disclaimer:
This analysis is for educational purposes only and does not constitute financial advice. Always do your own research and manage your risk before trading.
W. BUFFETT GOES 'GOOGLE'. DOES IT WORTH TO FOLLOW HIM AT PEAKSWarren Buffett has recently led Berkshire Hathaway to buy around $5 billion in Alphabet stock NASDAQ:GOOGL during the third quarter of 2025, making Alphabet one of Berkshire’s top ten holdings and sparking renewed interest in whether following Buffett’s move makes sense at today’s stock highs.
Technical Analysis
Alphabet is currently in a well-defined uptrend, with its price above short-term moving averages and an RSI near 60, indicating bullish momentum but no overbought signals.
Price action shows consolidation near highs (around $283–$290), pointing to the potential for a breakout, particularly with increasing volume on up days, which is a sign of institutional accumulation.
Critical technical levels: $260 (major support), $283–$290 (resistance zone). If the stock holds above $260 (Q3 2025 peaks), the underlying trend appears robust, but any reversal signals near resistance should be watched closely.
Momentum indicators (RSI, MACD) and stable volume profile suggest sustained optimism but prudent risk management is advised in case sentiment shifts.
Fundamental Analysis
Alphabet boasts strong recent earnings, with robust year-over-year growth in revenue and profit, especially from AI and Cloud businesses. Analyst consensus remains bullish, supported by upward revisions in price targets.
Valuation: Currently trading at roughly $284 per share, Alphabet’s price-to-earnings (P/E) ratio sits around 28, which is relatively attractive for a company growing earnings per share (EPS) at over 17% per year and maintaining high margins (ROE 32%, ROA 23%).
Intrinsic value estimates (base case) place fair value closer to $180, suggesting the stock is technically overvalued on traditional models, though AI/cloud potential and ecosystem advantages could justify a premium.
Key strengths: Dominant data ecosystem (Search, Android, Chrome, Gmail), world-leading AI research (DeepMind, Gemini), and a healthy balance sheet (minimal debt, strong free cash flow).
Risks: Heavy reliance on ad revenue, potential regulatory headwinds (especially in the EU), and risk of AI-driven disruption to legacy business lines.
Does It Worth to Follow Buffett at the Google' Peak?
Buffett’s purchase signals confidence in Alphabet’s long-term moat and ability to transition to AI-driven growth, despite current valuations appearing rich by historical standards.
Technically, the uptrend has not shown signs of exhaustion, and volume patterns indicate continued market accumulation. But buying near technical resistance always carries risk of short-term pullback.
Fundamentally, Alphabet’s growth engines, profitability, and fortress balance sheet remain appealing. However, potential macroeconomic and regulatory shocks are real, and intrinsic valuations suggest caution for value-focused investors.
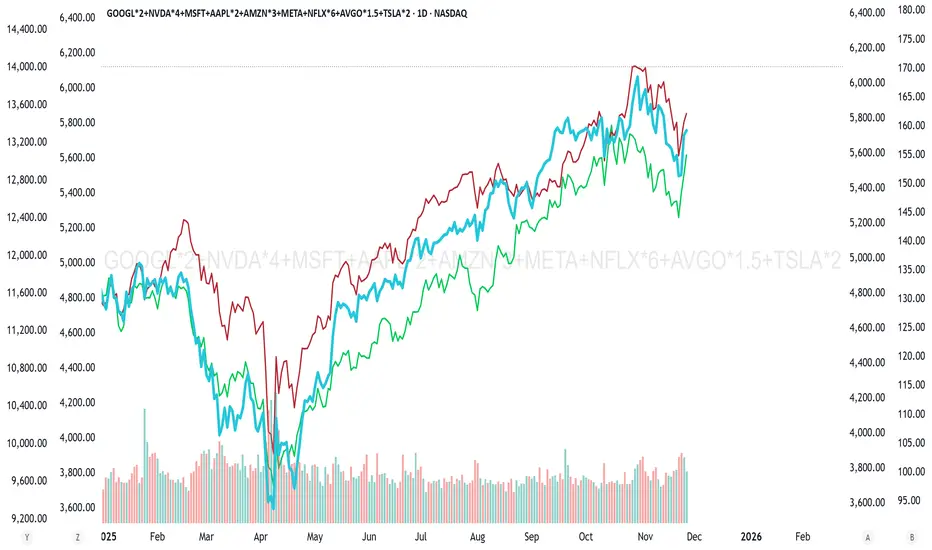
Beta-relative testing
We have examined Google stock in AU measure (one stock value in grams of gold). The graph below indicates on major long term upside trend, with a possible nearly 60% further upward potential is such measurement.
We have also tested Google stock in a measure of Nasdaq-100 (in example below NASDAQ:QQQ has been used; both - Google stock and QQQ - were used in 'total return' format).
Well, right now we can consider that multi-year 'flat regime' finally goes to breakthrough.
In conclusion, following Buffett now is technically supported by trend and recent accumulation, and fundamentally underpinned by growth, but it means accepting a premium and faithfully betting that Alphabet’s evolving AI/assets will deliver above-model returns over time.

GOOGL watch $313-316: Major Resistance zone could mark a TOPGOOGL has been flying high on the success of Gemini.
Just hit a major resistance zone at $313.21-316.33
Looking for a Dip-to-Fib like $294.08 or below to buy.

Alphabet Inc. (Google) bullish momentum poised for another break
Current Price: $292.69
Direction: LONG
Confidence Level: 78%
Targets:
- T1 = $300.00
- T2 = $310.00
Stop Levels:
- S1 = $288.00
- S2 = $283.50
**Wisdom of Professional Traders:**
The collective voice of professional traders is leaning strongly bullish on Alphabet this week. Multiple traders highlighted that Google has been the standout among mega-cap tech stocks, often closing at or near all-time highs and holding above key moving averages while peers like Meta, Nvidia, and Tesla saw significant weakness. Across the trader community, there is recurring focus on upside potential driven by the successful Gemini 3 AI launch, dominance in advertising, and significant institutional buying interest, including Warren Buffett's investment. Several traders also pointed out bullish options flow targeting higher strikes into $310–$320.
**Key Insights:**
Here’s what stands out to me: Google isn’t just keeping pace in the AI race—traders see it as taking the lead. The Gemini 3 model’s performance against OpenAI’s ChatGPT has fueled enthusiasm, with the market viewing Alphabet as a “long-term AI winner” capable of both innovation and profitable deployment. Multiple traders mentioned that it remains one of the few big tech names above its 55-day moving average, reflecting technical strength. Heavy call buying, including multi-million-dollar long-term positions, signals strong conviction from big money players aiming well above the current price.
What’s interesting is how resilient Google’s price action has been. Even in weeks where the broader market dipped, it often bucked the trend. Some pros warned about valuation stretch, but they still favored upside in the near term given the momentum and relative strength. This week’s key battleground is the $300 level, cited repeatedly as a resistance-to-break point that could open a pathway toward $310.
**Recent Performance:**
Last week, Google surged more than 8% to notch fresh record highs, driven by AI-related headlines and outperformance in the Communication Services sector. It repeatedly tested the $298–$300 zone, with Friday's close firmly above $292 after a brief pullback. Price action has shown higher highs and higher lows, which traders are watching closely as a bullish structure. Dark pool and options activity has supported the move, with notable gamma exposure centered at the $300 strike.
**Expert Analysis:**
Several professional traders are reading the chart as a textbook bullish setup—breakout from consolidation, clean uptrend, and strong relative strength vs. the MAG7 cohort. Many are eyeing $300 as the near-term breakout trigger, with $310 next if momentum builds. The $288 zone is being watched as first key support, followed by the $283–$284 area, which aligns with short-term swing lows. Fundamental catalysts, like stronger AI monetization potential in advertising and cloud, are reinforcing the technical read.
**News Impact:**
Fresh headlines around Google’s integrated AI stack—Gemini 3, Nano Banana Pro, and in-house TPU acceleration—are creating a narrative of competitive advantage. The confirmed Berkshire Hathaway buy only strengthens market sentiment. With the Federal Reserve expected to hold or ease rates into year-end and AI-driven ad revenues projected to lift margins, sentiment gains further tailwind. This positive backdrop is amplifying trader conviction for a sustained push through resistance.
**Trading Recommendation:**
Here’s my take: I like the long side as long as price holds above $288 support this week. A break and hold over $300 could drive a quick run to $310 on momentum and follow-through buying. I’d size in moderately at current levels, add on a confirmed break above $300, and keep stops tight under $288 to limit downside risk. This setup offers a solid risk-reward, backed by both technical and fundamental strength.
