GOOG: Is a 10% Surge Imminent? The Setup for $340 Explained🚀 NASDAQ:GOOG : Is a 10% Surge Imminent? The Setup for $340 Explained
In the noisy world of trading, clarity is power.
Today, we are looking at Alphabet Inc. (GOOGL). We are not predicting the future, we are simply preparing for a high-probability outcome.
We have identified a textbook Bull Flag pattern. As noted in the chart, this specific structure historically carries a 71% success rate. However, a statistic is only as good as the execution plan behind it.
The Technical Analysis
The price action is currently consolidating between two parallel yellow lines. This "pause" is healthy, it allows the market to build energy for the next potential leg up.
The key level to watch is $323 . We are looking for a clean breakout above this resistance.
A breakout is only valid if it is accompanied by significant volume . Without volume, a move above $323 could be a "fake-out", and that would be bearish.
If the price loses the $305–$309 zone , the Bull Flag structure is broken, and this specific trade idea is invalid . We must respect the market's "no."
The Projection
If the market gives us the green light at $323 , we have two targets based on standard projections:
Conservative : The 100% projection lands us at $336 .
Aggressive : For those holding longer, the 161.8% extension points higher ( approx. $346) .
Here are the levels I would use to set-and-forget in my trading system:
🎯 Take Profit: White lines ($336 - $346) | > 4-7% Potential
🛡️ Stop Loss : ~$314 Zone (Inside the flag structure) | ~ 2.5% Risk
⚖️ Risk/Reward : 2:1 Ratio or more
🎁 Let’s make a simple deal.
I will handle the heavy lifting to find the top 1% of setups like this, and you just HIT the 🚀 Rocket, Follow and Enjoy.
🤝 Deal?
Alphabet Inc. Shs A Cert Deposito Arg Repr 0.01724138 Shs
No trades
Market insights

Alphabet - The exceptional short setup!🔒Alphabet ( NASDAQ:GOOG ) is reversing right now:
🔎Analysis summary:
Alphabet is clearly indicating a major bearish move. With the current retest of major resistance, Alphabet is slowly reversing. Since Alphabet is also massively overextended, really everything is pointing towards a move lower. Just give it a couple of days to reverse.
📝Levels to watch:
$300
SwingTraderPhil
SwingTrading.Simplified. | Investing.Simplified. | #LONGTERMVISION

GOOGL. Plan for Dec 15Looking at GOOGL going into Dec. 15, the chart still feels heavy, even though price has stopped falling aggressively.
After the selloff, we got a bounce — but that bounce never reclaimed structure. Price broke down, tried to push back up, and stalled right where former support should turn into resistance. That’s not strength — that’s sellers letting price breathe.
Right now, GOOGL is sitting around the 308–310 area, which feels more like a pause than a base. There’s no real impulsive buying, just small candles and low follow-through. This usually means the market is deciding when, not if, to make the next move.
From a structure standpoint, the bearish move is still valid until proven otherwise.
Levels that actually matter
The first thing I’m watching is 308.
If price loses 308 with any momentum, I expect a quick move into 305, and if that doesn’t hold, 302–300 becomes very realistic. Those levels line up with prior lows and unfinished business from the selloff.
On the upside, 312–315 is the problem area.
That zone was support before the breakdown, and now it’s acting like a ceiling. Every bounce into that area so far has been sold. If price can’t reclaim and hold above 315, upside moves are likely just short-covering, not real trend change.
How GEX fits into this (not the focus, just confirmation)
Options positioning lines up with what price is telling us.
There’s strong PUT support around the current price, which explains why we’re chopping instead of free-falling. But above us, CALL resistance stacks up around 320 and higher, which makes upside continuation harder unless volume steps in.
That’s why moves down feel faster than moves up — dealers aren’t forced to support upside right now.
How I’d think about tomorrow
If GOOGL opens and can’t hold above 310, I’d be cautious leaning long. A clean break below 308 is where downside momentum likely kicks in.
If we open strong and reclaim 315, then I’d reassess — but until that happens, the burden of proof is on the bulls.
For me, Dec. 15 is simple:
* Below 308 → downside continuation likely
* Between 308–315 → chop and traps
* Above 315 → only then does the chart start to improve
Until then, this still looks like bearish consolidation, not a reversal.
Not financial advice. Just how I’m reading the chart going into the next session.

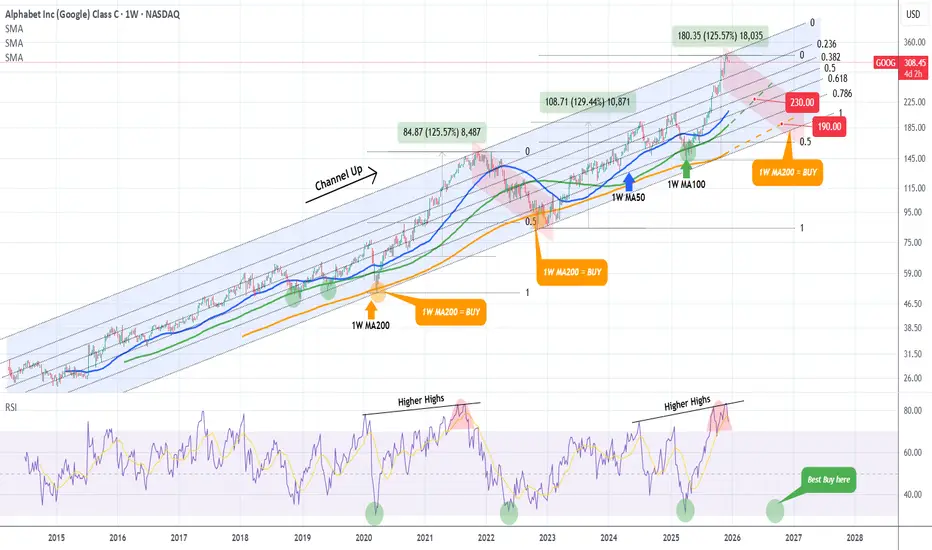
GOOGLE Bear Cycle has started and this is its ultimate blueprintWe made this chart on Google (GOOG) a little more than a month ago, warning of a potential market top on the Higher Highs trend-line of the multi-year Channel Up.
Well 3 weeks ago, the market hit that trend-line and we have a legitimate technical reason to expect that the Bull Cycle has topped. The 1W RSI has even printed the same kind of peak formation it did in September 2021.
We have extended the Channel Up on today's analysis all the way back to Google's IPO and the Fibonacci retracement levels serve absolute justice since the beginning to identify tops and bottoms.
You can see that the 1W MA200 (orange trend-line) has acted as the ultimate Support, thus best buy entry, on the last three major market corrections: the March 2020 COVID crash, the October 2022 Inflation Crisis bottom and the April 2025 (almost) Tariff War.
Before that, it was the 1W MA100 (green trend-line) that gave two excellent buy opportunities back-to-back.
As a result, even though the 2022 Bearish Leg correction bottomed on the 0.5 Fibonacci retracement level, this time we will 'limit' the new Bear Cycle to those MA trend-lines, the MA100 and MA200. If the price is contained on the MA100, its current trajectory shows a potential 'fair' contact around $230. If the market fails to rebound there, we expect a Q3 2026 bottom on the 1W MA200 around $190.
Regardless of that, we will also be looking closing at the 1W RSI. Since the 2020 COVID crash, and those 3 in total major corrections that the Alphabet stock had, when the RSI hit the 32.00 level, it presented an objective buy opportunity, even though in 2022 it dipped even lower.
---
** Please LIKE 👍, FOLLOW ✅, SHARE 🙌 and COMMENT ✍ if you enjoy this idea! Also share your ideas and charts in the comments section below! This is best way to keep it relevant, support us, keep the content here free and allow the idea to reach as many people as possible. **
---
💸💸💸💸💸💸
👇 👇 👇 👇 👇 👇
GOOG - From Erections Come CorrectionsAnytime you get an erection, move like this on a chart, rest assured, a correction is right around the corner.
Buffet's purchase of 1% of his cash holdings does not justify hundreds of billions in market capitalization gains.
GOOG has now exploded 53% since Sept. if you were long. GREAT! Take your profits and run! If you are chasing, you will ultimately get burned.
Remember, no matter where the price goes, you are always 100% from ZERO!
I will be the first to tell you that the most & easiest profits are always made at the tops of markets. When everyone and their grandmother is bullish! Therein is the problem! TOP!
GTFO and STFO!
THANK YOU for getting me to 5,000 followers! 🙏🔥
Let’s keep climbing.
If you enjoy the work:
👉 Boost
👉 Follow
👉 Drop a solid comment
Let’s push it to 6,000 and keep building a community grounded in truth, not hype.

GOOGL GEX & Bullish Decision Point at 320February 20 Expiration – GEX & Options Structure
Looking at the February 20 expiration, the options and GEX structure suggests that price is currently sitting at a critical decision zone .
Put side
The chart shows a clear put support level around 310 .
Price has briefly traded through this level, but there has been no strong downside continuation .
This keeps the scenario alive that 310 can still act as put support into this expiration.
Call side / Decision point
The next core resistance is located around 320 .
This level represents a bullish decision zone .
A clean break and acceptance above 320 could quickly shift dealer positioning.
Such a move would open the door for a potential gamma squeeze to the upside.
Technical context
Since summer, this is already the third similar bull flag structure on the daily chart.
The previous two structures resolved to the upside.
The current pattern has not yet confirmed a breakout.
This makes the 320 level especially important for technical confirmation.
Upside scenario
If price accepts above 320 , the next logical magnet becomes the next core resistance.
Based on daily structure and call wall positioning, this sits around 350 .
Volatility & Skew
Core pricing skew is currently around +25% , favoring calls.
Implied volatility has been compressing for several sessions .
This supports the idea that a directional expansion could follow once price resolves this range.
Summary
310 = key put support
320 = bullish decision point
Acceptance above 320 increases the probability of gamma-driven upside toward higher call resistance levels

Alphabet May Be OversoldAlphabet has pulled back after hitting a new all-time high, and some traders may think it’s oversold.
The first pattern on today’s chart is the rally between November 14 and November 25. The Internet giant held its ground yesterday after retracing half the advance, which may confirm its direction is pointing higher.
Second, GOOGL has bounced multiple times at its 21-day exponential moving average (EMA). It returned to the same EMA yesterday. Will that lure trend followers?
Next, stochastics have dipped to an oversold condition.
Finally, GOOGL is an active underlier in the options market. That could help traders take positions with calls and puts.
TradeStation has, for decades, advanced the trading industry, providing access to stocks, options and futures. If you're born to trade, we could be for you. See our Overview for more.
Past performance, whether actual or indicated by historical tests of strategies, is no guarantee of future performance or success. There is a possibility that you may sustain a loss equal to or greater than your entire investment regardless of which asset class you trade (equities, options or futures); therefore, you should not invest or risk money that you cannot afford to lose. Online trading is not suitable for all investors. View the document titled Characteristics and Risks of Standardized Options at www.TradeStation.com . Before trading any asset class, customers must read the relevant risk disclosure statements on www.TradeStation.com . System access and trade placement and execution may be delayed or fail due to market volatility and volume, quote delays, system and software errors, Internet traffic, outages and other factors.
Securities and futures trading is offered to self-directed customers by TradeStation Securities, Inc., a broker-dealer registered with the Securities and Exchange Commission and a futures commission merchant licensed with the Commodity Futures Trading Commission). TradeStation Securities is a member of the Financial Industry Regulatory Authority, the National Futures Association, and a number of exchanges.
Options trading is not suitable for all investors. Your TradeStation Securities’ account application to trade options will be considered and approved or disapproved based on all relevant factors, including your trading experience. See www.TradeStation.com . Visit www.TradeStation.com for full details on the costs and fees associated with options.
Margin trading involves risks, and it is important that you fully understand those risks before trading on margin. The Margin Disclosure Statement outlines many of those risks, including that you can lose more funds than you deposit in your margin account; your brokerage firm can force the sale of securities in your account; your brokerage firm can sell your securities without contacting you; and you are not entitled to an extension of time on a margin call. Review the Margin Disclosure Statement at www.TradeStation.com .
TradeStation Securities, Inc. and TradeStation Technologies, Inc. are each wholly owned subsidiaries of TradeStation Group, Inc., both operating, and providing products and services, under the TradeStation brand and trademark. When applying for, or purchasing, accounts, subscriptions, products and services, it is important that you know which company you will be dealing with. Visit www.TradeStation.com for further important information explaining what this means.

GOOGL Dec 22 – Breakout ConfirmedGOOGL Dec 22 – Breakout Confirmed, Now Watching Acceptance Above $307
1-Hour Chart Analysis (Primary Structure & Bias):
On the 1-hour timeframe, GOOGL has already done the hard part — it broke out of a multi-day compression and reclaimed the $304–$305 value area with conviction. The impulsive candle that pushed price above prior structure confirms bullish intent, not just a stop run. Since then, price has held above that level, showing acceptance rather than rejection.
The prior downtrend line has been invalidated, and market structure has flipped bullish. Higher highs and higher lows are now in place, with price stabilizing just below the next resistance band near $308–$310. As long as GOOGL holds above $302, the 1-hour bias remains firmly bullish and favors continuation rather than mean reversion.
Key 1H levels:
* Structural support: $301 → $302
* Acceptance zone: $304 → $307
* Expansion zone: Above $308.50
15-Min Chart Analysis (Execution & Timing):
On the 15-min chart, GOOGL is consolidating tightly near highs after the breakout, forming a bullish pause / micro flag just under $307–$308. This is constructive behavior — price is not retracing aggressively, and sellers are failing to push it back below the breakout base.
SMC signals show a clean BOS to the upside, followed by shallow pullbacks that respect prior demand. There is no distribution pattern here — just compression and liquidity building. Momentum has cooled slightly, which actually improves the odds of continuation once buyers step back in.
15-min execution levels:
* Support to defend: $304.50 → $303
* Immediate resistance: $307.80 → $308.50
* Trigger: Acceptance above $308.50 with follow-through
As long as price stays above $303, dips remain buyable within trend structure.
GEX Analysis (Dealer Positioning & Confirmation):
The GEX data aligns well with the technical structure going into Dec 22:
* Highest positive NETGEX / Gamma Wall sits near $310, which lines up with the next logical upside target.
* CALL walls are stacked at $305 and $307.50, suggesting dealer hedging should continue to support price above the breakout zone.
* PUT support is concentrated near $295–$290, well below current price, creating a solid downside buffer.
This is a positive gamma environment. Volatility is compressed, downside moves are being absorbed, and once price clears resistance, dealer hedging can help accelerate upside toward the gamma wall.
My Thoughts:
GOOGL is behaving like a stock that wants higher prices. The breakout was clean, volume expanded, and price is now holding above prior resistance, not slipping back into the range. That’s the key difference between a failed breakout and a real one.
If GOOGL holds above $304–$305 into Dec 22, the path of least resistance remains toward $308 → $310. Acceptance above $308.50 could quickly open the door for a push into the low $310s, especially with gamma stacked overhead.
The only scenario that weakens this view is a failure back below $302, which would signal a false breakout. Until then, the structure favors patience on the long side.
Options Outlook (Week of Dec 22):
* Bullish continuation: 307.5C or 310C if price accepts above $308.50.
* Pullback entry: Calls near $304–$303 if price holds structure and momentum stabilizes.
* Risk hedge: Short-dated 300P only if $302 breaks decisively.
* Volatility note: IV remains relatively low, favoring directional call plays over premium-selling strategies.
Conclusion:
GOOGL has confirmed a structural breakout and is now building value above former resistance. The 1-hour trend defines the bullish bias, the 15-min chart provides clean execution levels, and GEX confirms supportive dealer positioning. Above $304, buyers remain in control. Acceptance above $308.50 sets up the next leg toward $310+.
Disclaimer: This analysis is for educational purposes only and does not constitute financial advice. Always do your own research and manage risk responsibly.

Just In: Alphabet Inc. (NASDAQ: GOOG) Surging in Early PremarketShares of Alphabet Inc. (NASDAQ: NASDAQ:GOOG ) is experiencing a notable uptick of 0.63% in early market trading on Monday albeit market condition. The asset last close trading session was up 1.67% on Friday.
In recent news, A Spanish consumer rights association on Friday said it had launched preliminary legal action against Google for allegedly collecting sensitive personal data and violating their right to privacy.
The Association of Communication Users (AUC) says the US tech giant collected data about users' personal opinions, religion, sexuality and health through applications and the Android operating system, supporting their claim with a study by a Dublin-based university professor.
"Technology and the desire to provide a service have taken precedence over putting in place safeguards to protect people's privacy," AUC secretary general Bernardo Hernandez told AFP.
"The issue of privacy is extremely scandalous because not even the bare minimum is protected," he added, saying Google could have provided the same services without unnecessarily collecting "an excessive amount of data."
Analyst Summary
According to 44 analysts, the average rating for GOOG stock is "Strong Buy." The 12-month stock price target is $307.02, which is a decrease of -0.52% from the latest price.
Important Dates
The next estimated earnings date is Tuesday, February 3, 2026, after market close. The stock price has increased by +62.30% in the last 52 weeks.

GOOGL - Going for another ATH=======
Volume
=======
- expanding
==========
Price Action
==========
- Inside candle bar with decent bullish recovery
=================
Technical Indicators
=================
- Ichimoku
>>> price above cloud, pointing up, rebounded at lagging
>>> Green kumo still strong
>>> Tenken - Above clouds & Lagging
>>> Chiku - above clouds & flat
>>> Kijun - above clouds, Conv and Lagging & pointing up
=========
Oscillators
=========
- MACD at early bullish reversal
- DMI neutral, early bullish movements
- StochRSI, early bullish reversal, K crossed D and entering band
=========
Conclusion
=========
- short to long term breakout swing
- price may reverse or range at current level, to enter spot or wait for pullback at entry 2.
- Entry and exits depends on your time horizon and risk management.
=========
Positions
=========
Entry 1 - $308.15
Entry 2 - $303.45
Stop - $294.50
Exit 1 - $311.50
Exit 2 - $315.50
Exit 3 - $321
Exit 4 - $324.50
Exit 5 - $335

Alphabet - CorrectionThe upward move started in mid-October 2025.
A full five-wave bullish cycle has been completed.
The market is now developing corrective wave A .
Targets:
Intermediate: 292
Primary: 280
---
Please subscribe and leave a comment.
You’ll get new information faster than anyone else.
---

4 consecutive down days for GOOG? Yes, please. Long @ 307.59GOOG has had 4 consecutive down closes only 7 times so far this year. Today makes 8. In the previous 7 instances, it returned at least 2% in 7 trading days or less 6 of the 7 times and a gain all 7 times .
That is all. Very simple today. I'll hold until it hits a sell signal for me and tactically add and sell along the way if necessary.
As always - this is intended as "edutainment" and my perspective on what I am or would be doing, not a recommendation for you to buy or sell. Act accordingly and invest at your own risk. DYOR and only make investments that make good financial sense for you in your current situation.

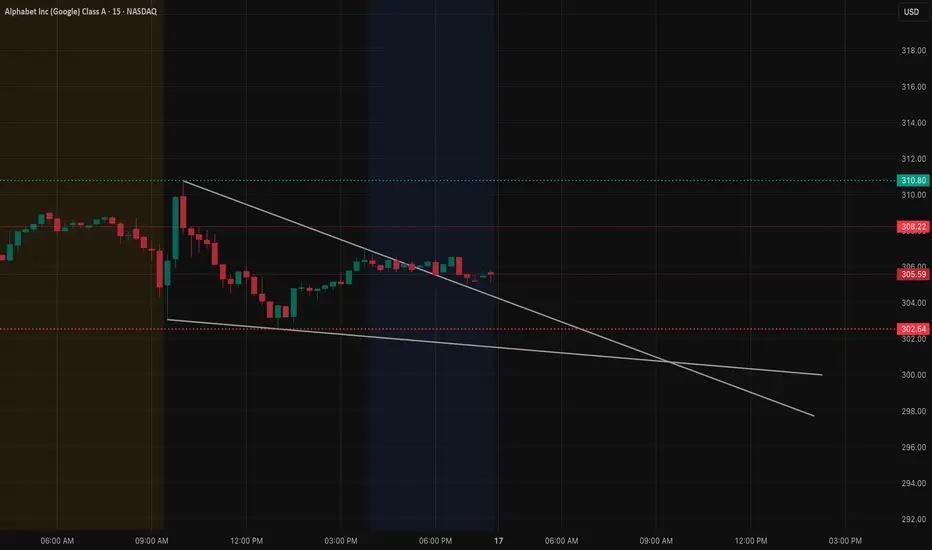
GOOGL at Critical Support – Dec. 17 Could Decide DirectionGOOGL is still trading inside a descending structure, and price is currently compressing toward the apex of that falling channel. The bounce off the lows lacked momentum and volume follow-through, which tells me this is more of a relief move than a true trend reversal for now.
From a price-action perspective, GOOGL failed to reclaim the prior breakdown zone around 308–310. That area continues to act as supply. Until price can hold above it, the path of least resistance remains sideways to down. The lower channel trendline and prior demand around 302–300 remain the key downside magnet if sellers press again.
Now layering in GEX, the options positioning lines up well with what price is showing.
The largest negative gamma / PUT support sits near the 300–302 zone, which explains why price keeps reacting there instead of cascading lower. Dealers are likely hedging aggressively in this area, creating temporary stabilization. However, above price, CALL resistance builds between 315–320, with a notable call wall around 317–320, which caps upside attempts unless we see a strong shift in flows.
This creates a very defined range behavior:
As long as GOOGL remains below 315, upside extensions are likely to stall into dealer-driven resistance. If 302–300 breaks with volume, the next downside pocket opens quickly, since gamma support thins out below that level.
In short, price structure and GEX are aligned. This is still a sell-the-rallies environment, not a chase-the-bounce setup. Bulls need a clean reclaim and acceptance above 315 to flip the narrative. Until that happens, expect choppy consolidation with downside risk toward 302–300, especially if broader market pressure increases.
This analysis is for educational purposes only and does not constitute financial advice. Always manage risk and make your own trading decisions.
I bought GOOGLEWell, bought Google... I waited for a correction to buy... Personally, I don't think we're in a bubble and I believe we'll continue to rise and reach new historic highs.
I think Google is an incredible company and is doing everything right: increasing users, accounting for 90% of internet searches, and its artificial intelligence is incredible (beating ChatGPT again).
They are investing in data centers and AI, and they focus too much attention on their existing customers.
I am very bullish on this company and continue to be so...

Google is trading in a high-risk zone.Google (Alphabet) Stock Analysis
As shown on Chart A, Google is trading within a 5-year ascending channel on the weekly timeframe and has now reached the upper boundary of the channel.
On Chart B (daily timeframe), price has broken below its rising channel and has already moved toward the mid-level of the extended channel.
Given the strong bullish momentum in the most recent move, the probability of a sharp sell-off appears limited. However, considering the bearish divergence in the last price leg, along with the presence of a large unfilled gap that price has never revisited, a corrective move can be expected.
Based on these factors, a pullback at least toward the $217 level remains a plausible scenario.
This analysis will be updated accordingly.
Follow me on TradingView for more analyses and live stock trades.
NASDAQ:GOOG

GOOGL Dec 12 Sliding Downward Channel. Key Support Now in PlayGOOGL has been moving inside a clean descending channel on the 15-minute timeframe after the sharp rejection earlier in the session. Each bounce continues to form lower highs, and price remains pinned under the channel’s upper boundary. That trendline has now rejected price multiple times, signaling that sellers are still in control until GOOGL can break above it with strength.
The mid-zone around 313–315 is acting as the key intraday decision area. Buyers attempted to stabilize here, but each rally into 315 met resistance, and the latest candles show hesitation beneath the trendline. Unless GOOGL can reclaim 315 and close above the channel’s upper line, the structure remains bearish.
Below price, the channel’s lower boundary aligns with the 308–309 support zone. This area held earlier and became the base of the channel. If GOOGL breaks under 310, the channel suggests room for continuation toward 308–307, where buyers previously stepped in aggressively.
Now looking at the options landscape, the GEX levels line up tightly with these structural turning points.
The 315 level, where GOOGL stalled repeatedly, corresponds with a significant positive gamma band. When price moves into these upper positive-gamma regions, dealer hedging typically dampens momentum. This explains why every push back into 315 fades—it’s not just chart resistance, it’s an area where hedging flows naturally limit extension.
Above that, the next major positive gamma levels sit around 322–324. These levels represent the top-end call concentration. To reach that area, GOOGL would need to break the descending channel, reclaim 315, and hold it. If that happens, the hedging pressure that previously contained price begins to release, and volatility can expand upward, opening a path toward 320+.
On the downside, negative gamma levels align with the lower channel targets. The cluster around 310–308 shows where downside movement can accelerate. If GOOGL loses 310, the options positioning shifts into a zone where dealer hedging amplifies volatility instead of controlling it. That is exactly the environment where channel breakdowns can follow through cleanly.
The correlation between the descending channel and the GEX positioning creates a clear roadmap:
• Holding below the channel’s upper trendline keeps the bearish structure intact
• A move above 315 signals strength and opens the path to 318 and potentially 322 if momentum builds
• Losing 310 confirms continuation within the downward channel toward 308–307
• Below 307, negative gamma increases the chance of sharper moves
GOOGL is moving cleanly within its channel, and the options landscape supports both the rejection zones above and the acceleration zones below. Dec 12 is likely defined by how price interacts with 315 on top and 310 underneath.
This analysis is for educational purposes only and not financial advice.

Google: Pause?Over the past two weeks, Google's stock has been taking a breather, moving mostly sideways. Our primary scenario suggests that price will soon gather fresh upward momentum and swing into the red Target Zone between $377.44 and $418.64, where it should complete the overarching upward cycle of the beige wave I. Once this occurs, a new downward impulse is expected to begin, making the red zone suitable for entering short positions; a stop 1% above the upper boundary of the zone can provide protection.

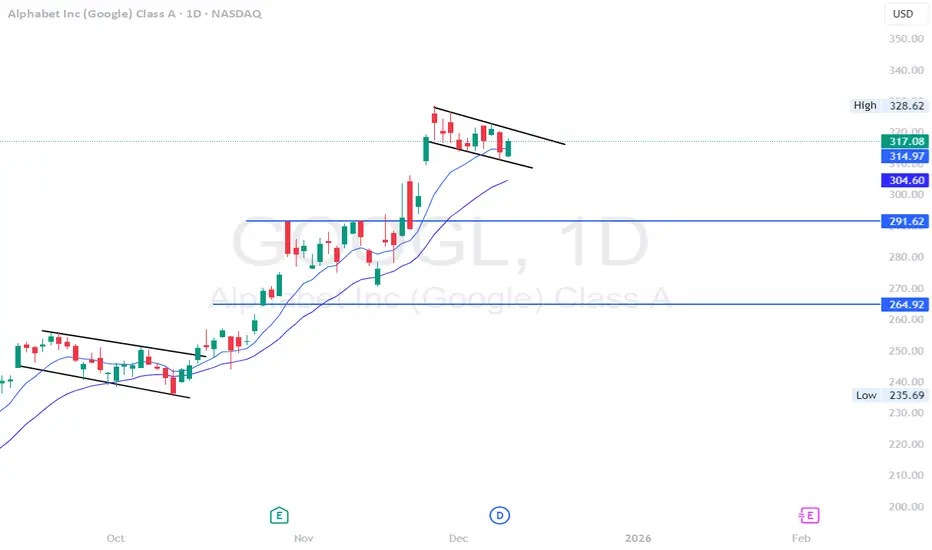
GOOGL - flagging on the daily time frame.GOOGL - Stock flagging on the daily time frame. potential breakout move above $320. Stock does have gap to fill to the downside of $309.50 breaks. possible move still on both sides.
GOOGL at a Key Decision Zone — Dec. 10 TA with GEX InsightGOOGL continues to respect one of the most important levels on its chart: the 311–312 zone. Every time price dips into this area, it gets absorbed instantly, creating a solid base for the recent recovery. That kind of repeated defense usually means real buyers are sitting there, not just random bounces.
The move back toward 316–318 shows where supply still lives. Price wasn’t able to push through that pocket, and the rejection lined up perfectly with the upper trendline on the 1-hour chart. It doesn’t break the bullish structure, but it does tell us that sellers remain active and patient at that level.
On the 15-minute timeframe, the picture is cleaner. GOOGL had a strong run off the 311 support, pushed straight into 318, and then shifted into a controlled pullback. EMAs are flattening, which usually means the market is transitioning from momentum into consolidation. The structure stays constructive as long as price avoids making a new lower low. That 311–312 zone is the line in the sand.
The gamma exposure map adds clarity to why the stock keeps behaving this way. The put wall is stacked right at 311–312, which means dealers hedge by buying each time price approaches it — creating that reliable support. On the other side, the first meaningful call-wall pressure sits at 316–318. That’s exactly where price keeps getting rejected, because dealer hedging tends to produce sell-side flow as we approach those levels.
This leaves GOOGL pinned between two strong forces: a supportive floor and a heavy ceiling. Until one of those gives way, the stock is likely to keep drifting around the middle of the range, roughly near 315. A clean breakout over 318 would free it toward 322–325, where the next gamma pockets sit. A breakdown under 312, on the other hand, would open room toward 310 and possibly even 300 if momentum shifts.
Right now the chart and the options-based gamma structure are aligned, and that usually produces reliable levels. GOOGL is coiling — and whichever side breaks first will define the next directional leg.
Disclaimer: This analysis is for educational purposes only and is not financial advice. Always do your own research and manage your risk.
Alphabet - This rally will soon be over!🪦Alphabet ( NASDAQ:GOOG ) will end its rally soon:
🔎Analysis summary:
Starting back in 2025, Alphabet created a major bullish break and retest. Following this behavior, we witnessed an expected strong rally of about +120%. But with the current retest of the upper resistance trendline, Alphabet will soon create a healthy retracement.
📝Levels to watch:
$300
SwingTraderPhil
SwingTrading.Simplified. | Investing.Simplified. | #LONGTERMVISION

Global Trade Imbalance: Causes and ConsequencesGlobal trade imbalance refers to a persistent difference between a country’s exports and imports when trading with the rest of the world. When a nation consistently exports more than it imports, it runs a trade surplus; when it imports more than it exports, it runs a trade deficit. While short-term imbalances are a normal part of international trade, long-lasting and large imbalances can shape global economic stability, influence currency movements, affect employment, and even create geopolitical tensions. In today’s interconnected world, understanding global trade imbalance is crucial for policymakers, investors, businesses, and traders.
Understanding the Concept of Trade Imbalance
At its core, a trade imbalance reflects differences in economic structure, productivity, consumption patterns, and savings behavior among countries. Developing economies often run trade deficits as they import capital goods and technology to support growth, while export-oriented economies may generate surpluses by focusing on manufacturing and external demand. Trade imbalances are recorded in a country’s current account, which also includes services, income flows, and transfers, but goods trade usually dominates the discussion.
Trade imbalances are not inherently negative. For example, the United States has run trade deficits for decades while maintaining strong economic growth and attracting global capital. However, when imbalances become excessive or politically sensitive, they can trigger policy responses such as tariffs, currency interventions, or trade agreements.
Major Causes of Global Trade Imbalance
One of the most important drivers of global trade imbalance is differences in savings and investment rates. Countries with high domestic savings and relatively lower consumption—such as China, Germany, and Japan—tend to export more than they import, creating trade surpluses. In contrast, countries with high consumption and lower savings—such as the United States—often rely on imports, resulting in trade deficits.
Exchange rate policies also play a critical role. A weaker currency makes exports cheaper and imports more expensive, supporting trade surpluses. Some countries have historically managed or intervened in their currencies to maintain export competitiveness. Conversely, strong currencies can make exports less competitive, widening trade deficits.
Another key factor is economic structure and competitiveness. Countries specializing in high-value manufacturing, technology, or capital goods often dominate global exports. Meanwhile, economies dependent on commodity imports or consumer goods may experience persistent deficits. Labor costs, productivity levels, infrastructure quality, and innovation capacity all influence trade performance.
Globalization and supply chains have further contributed to trade imbalances. Multinational companies often locate production where costs are lowest, exporting finished goods to consumer markets. As a result, manufacturing hubs accumulate trade surpluses, while consumption-driven economies absorb deficits.
Role of Capital Flows and Financial Markets
Trade imbalances are closely linked to capital flows. A country running a trade deficit must attract foreign capital to finance it, usually through foreign direct investment (FDI), portfolio investment, or borrowing. For example, the U.S. trade deficit is matched by strong inflows into U.S. Treasury bonds, equities, and real estate. This relationship shows that trade deficits are not just about goods, but also about confidence in an economy’s financial markets.
However, reliance on foreign capital can increase vulnerability. Sudden reversals of capital flows may lead to currency depreciation, higher interest rates, and financial instability, especially in emerging markets.
Economic and Social Consequences
Persistent global trade imbalances can have wide-ranging effects. In surplus countries, heavy dependence on exports can make growth vulnerable to external demand shocks. A slowdown in global trade or protectionist policies can quickly hurt employment and industrial output.
In deficit countries, large trade gaps may contribute to industrial decline and job losses in manufacturing sectors. This has been a major political issue in several advanced economies, fueling debates about globalization, outsourcing, and fair trade. Rising income inequality and regional economic disparities are often linked to long-term trade deficits.
Trade imbalances also influence currency markets. Deficit countries may experience downward pressure on their currencies over time, while surplus countries may face appreciation pressure. These movements affect inflation, interest rates, and central bank policies, directly impacting global financial markets.
Trade Imbalances and Geopolitics
Global trade imbalance is not just an economic issue; it is also deeply political. Large imbalances between major economies have led to trade disputes, sanctions, and tariff wars. Governments may accuse trading partners of unfair practices such as subsidies, dumping, or currency manipulation.
Such tensions can disrupt global supply chains, reduce investor confidence, and slow global growth. International institutions like the World Trade Organization (WTO), International Monetary Fund (IMF), and G20 often emphasize the need to reduce excessive imbalances through structural reforms rather than protectionism.
Impact on Emerging and Developing Economies
For emerging markets, trade imbalances present both opportunities and risks. Export-led growth strategies have helped many countries industrialize and reduce poverty. However, over-reliance on exports—especially commodities—can expose economies to volatile global prices and demand cycles.
Trade deficits in developing countries can be manageable if they finance productive investments, such as infrastructure and technology. Problems arise when deficits fund consumption instead of growth, increasing external debt and financial fragility.
Addressing Global Trade Imbalance
Reducing global trade imbalance requires coordinated policy efforts. Surplus countries can encourage domestic consumption, raise wages, and invest more at home. Deficit countries can boost savings, improve productivity, and enhance export competitiveness through innovation and skill development.
Exchange rate flexibility is also crucial. Allowing currencies to reflect economic fundamentals can help correct imbalances over time. Structural reforms, such as improving ease of doing business, strengthening infrastructure, and upgrading manufacturing capabilities, play a long-term role.
At the global level, cooperation is essential. Protectionist measures may reduce deficits temporarily but often lead to retaliation and higher costs. Sustainable solutions focus on balanced growth, open markets, and fair competition.
Conclusion
Global trade imbalance is a complex and multifaceted phenomenon shaped by economic structures, financial flows, currency policies, and global supply chains. While trade surpluses and deficits are natural outcomes of international trade, persistent and large imbalances can create economic vulnerabilities and political tensions. In an increasingly interconnected world, addressing global trade imbalance requires thoughtful domestic reforms and strong international cooperation. Rather than viewing imbalances as purely negative, policymakers and market participants must understand their underlying causes and manage them in a way that supports stable, inclusive, and sustainable global growth.

GOOGL low resistance liquidity run to ATHI think this GOOGL 24 hour chart has a great set up to take us back to All-time high.
We got the formation of a bullish fair value gap today.
We have relative highs sitting at 321.31.
Most definitely a low resistance run on liquidity at 332.98.
There was a gap on the weekly timeframe that got filled, and we got a bounce out of it two weeks in a row, and this would be the third week of a bounce .
The only thing that could disrupt this move up, is that there is a bearish weekly Fair value gap that needs to get broken through.
We clear that and it could be smooth sailing.

Google Wave Analysis – 22 December 2025
- Google reversed from key support level 290.00
- Likely to rise to resistance level 320.00
Google recently reversed from the key support level 290.00 (former strong resistance from October and November) intersecting with the lower daily Bollinger Band and the 38.25 Fibonacci correction of the upward impulse 1 from October.
The upward reversal from the support level 290.00 started the active impulse wave i of the higher impulse waves 3 and (C).
Given the strong daily uptrend, Google can be expected to rise to the next resistance level 320.00 (target for the completion of the active impulse wave i).
