ESG Investing and Green Finance1. Understanding ESG: Environmental, Social, and Governance
ESG investing involves evaluating companies not only on financial performance but also on how well they manage environmental, social, and governance risks and opportunities. It helps investors identify sustainable businesses that are better positioned for long-term growth.
1.1 The Environmental Component (E)
This dimension examines how a company impacts the planet. Key factors include:
Carbon emissions and climate impact
Energy efficiency and renewable energy usage
Waste management and recycling
Water usage and conservation
Biodiversity protection
Investors focus on whether a company has strategies to reduce climate risk, comply with environmental regulations, and transition towards greener operations.
1.2 The Social Component (S)
This pillar evaluates a company's relationship with people—employees, customers, suppliers, and communities. It includes:
Labor rights, wages, and workplace safety
Diversity, equity, and inclusion (DEI)
Customer privacy and data protection
Human rights across supply chains
Community development and social welfare initiatives
Companies with strong social practices tend to have better employee retention, improved brand reputation, and lower legal risks.
1.3 The Governance Component (G)
Governance is about the ethical and transparent management of a company. Criteria include:
Board independence and diversity
Shareholder rights and protections
Anti-corruption policies
Executive compensation linked to performance
Transparent reporting and accountability
Good governance reduces the chances of scandals, fraud, and mismanagement, making the company a safer long-term investment.
2. ESG Investing in Practice
2.1 ESG Screening Methods
Investors use different strategies to integrate ESG:
Negative Screening: Excludes harmful industries (tobacco, weapons, coal).
Positive Screening: Selects companies with high ESG scores.
Best-in-Class Selection: Chooses top performers in each sector.
Integration Approach: Combines ESG data into financial analysis.
Active Ownership: Investors influence companies through voting and engagement.
2.2 ESG Ratings and Data Providers
Agencies like MSCI, Sustainalytics, Refinitiv, and S&P Global provide ESG scores. These ratings help investors compare companies and assess risks.
2.3 Why ESG Investing Is Growing Rapidly
Several forces are driving global adoption:
Climate change concerns
Government regulations and carbon policies
Demand from millennials and Gen-Z investors
Corporate transparency and pressure from stakeholders
Better long-term risk-adjusted returns
Research shows that companies with high ESG performance often deliver higher resilience during economic downturns and more stable cash flows.
3. Green Finance: Capital for a Sustainable Future
Green finance refers to financial instruments and investments specifically designed to support environmentally friendly projects. While ESG investing evaluates companies broadly, green finance channels capital exclusively toward environmental sustainability.
3.1 Key Components of Green Finance
Green Bonds
These are debt instruments where funds are used for climate or environmental projects such as solar plants, wind farms, green buildings, or pollution reduction.
They are issued by governments, corporations, and global institutions.
Green Loans
Loans provided to businesses for sustainable and energy-efficient projects.
Sustainability-Linked Bonds (SLBs)
Interest rates vary depending on a company’s achievement of sustainability targets such as emission reductions.
Climate Funds
Investment pools dedicated to renewable energy, carbon reduction, and environmental innovation.
Carbon Markets and Credits
Companies purchase carbon credits to offset emissions, promoting global decarbonization.
Green Banks
Specialized financial institutions supporting low-carbon infrastructure.
3.2 Priority Sectors in Green Finance
Green finance focuses on sectors with high environmental impact:
Renewable energy (solar, wind, hydro)
Electric mobility and battery technologies
Green buildings and energy-efficient infrastructure
Waste management and recycling
Water treatment and desalination
Sustainable agriculture
Climate adaptation and resilience projects
4. How ESG and Green Finance Work Together
While ESG investing evaluates a broad spectrum of ethical factors, green finance is narrowly targeted at environmental impact. Yet, both frameworks complement each other:
ESG encourages companies to adopt sustainable behavior, improving overall corporate responsibility.
Green finance provides funding for environmentally beneficial projects.
Together, they push global markets toward decarbonization, resource efficiency, and ethical governance.
For example, an energy company with strong ESG scores may issue green bonds to finance its transition from coal to renewable energy. Institutional investors, looking for sustainable portfolios, buy these bonds—creating a cycle of positive environmental impact and financial returns.
5. Benefits of ESG Investing and Green Finance
5.1 For Investors
Better risk management (climate, legal, and reputational).
Potential for long-term stable returns.
Alignment with future regulatory trends.
Access to innovative sectors like clean energy and sustainable tech.
5.2 For Companies
Lower cost of capital due to ESG-focused investors.
Stronger brand identity and customer loyalty.
Enhanced operational efficiency through sustainable practices.
Better compliance with environmental regulations.
5.3 For Society and the Environment
Reduced carbon emissions and pollution.
Promotion of clean energy and green technologies.
Improved labor conditions and community welfare.
More ethical and transparent corporate behavior.
6. Challenges and Criticisms
Despite rapid growth, ESG and green finance face several obstacles.
6.1 Greenwashing
Some companies exaggerate sustainability claims to attract investors. This undermines trust and calls for stricter reporting standards.
6.2 Lack of Standardization
Different ESG rating agencies use different methodologies, leading to inconsistent scores.
6.3 Data Quality Issues
Many companies do not disclose complete or accurate ESG data.
6.4 Balancing Returns vs Sustainability
Some investors believe ESG restrictions may limit short-term profits. However, long-term benefits are increasingly evident.
7. The Future Outlook
ESG investing and green finance are expected to dominate global markets.
Key trends include:
Mandatory climate disclosures by companies
Rise of sustainable index funds and ETFs
Growth in green bond markets
AI-driven ESG analytics
Government incentives for clean energy
Integration of biodiversity and natural capital into finance
Financial institutions, governments, and corporations are aligning capital flows with sustainability goals such as the Paris Agreement and UN SDGs.
Conclusion
ESG investing and green finance mark a new era where profits and purpose converge. Investors are no longer satisfied with traditional financial metrics; they want companies to deliver long-term value while safeguarding the environment and society. ESG frameworks help identify responsible businesses, and green finance mobilizes capital for sustainable projects. Together, they build a financial ecosystem that promotes resilience, ethical conduct, and environmental protection. As global challenges intensify, ESG and green finance will continue shaping the future of economic development—driving the world towards a greener, more inclusive, and more sustainable future.
Alphabet Inc. Shs A Cert Deposito Arg Repr 0.01724138 Shs
No trades
Trade ideas
The Crucial Role of Global Trade1. Economic Growth and Development
The most immediate and apparent role of global trade is its contribution to economic growth. Trade enables countries to specialize in producing goods and services in which they have a comparative advantage—a concept introduced by economist David Ricardo. Comparative advantage means that countries can produce certain products more efficiently than others. For instance, a country with abundant fertile land may focus on agriculture, while a technologically advanced nation may concentrate on electronics or software development. By exchanging these goods and services, countries can maximize efficiency and output, leading to higher GDPs and improved living standards.
Global trade also promotes industrial diversification. By participating in international markets, nations are incentivized to develop new industries, upgrade technology, and improve infrastructure. Emerging economies, such as China and India, have leveraged trade to transform their economic landscapes, moving from agrarian-based systems to industrial and service-driven economies within decades. Furthermore, trade contributes to employment generation by creating new jobs in export-oriented sectors and associated industries like logistics, finance, and technology.
2. Access to Goods and Services
Global trade allows countries to access products that may be unavailable or too expensive domestically. This enhances consumer choice and ensures that people benefit from goods that would otherwise be out of reach. For example, tropical fruits like bananas or coffee can be enjoyed in regions with cold climates because of trade. Similarly, high-tech gadgets, pharmaceuticals, and machinery are often imported from countries with advanced technological capabilities.
By facilitating access to a broader range of goods and services, global trade also promotes competition. Domestic producers must innovate and improve quality to remain competitive against international competitors, ultimately benefiting consumers through better products and lower prices.
3. Technological Advancement and Innovation
Trade is not only about goods and services; it also facilitates the transfer of knowledge and technology. When countries engage in international trade, they often adopt new production techniques, management practices, and innovations from their trading partners. This exchange fosters technological diffusion, which can accelerate industrialization and modernization.
Multinational corporations (MNCs) play a pivotal role in this process. Through foreign direct investment (FDI), MNCs bring in advanced technology, management expertise, and capital, stimulating local economies and raising productivity. For instance, the entry of foreign automotive companies into emerging markets has often led to the adoption of cutting-edge manufacturing techniques, quality standards, and research and development capabilities in those regions.
4. Enhancing International Relations
Global trade serves as a bridge between nations, fostering interdependence and cooperation. Countries that trade extensively are less likely to engage in conflict because their economies are mutually connected. This concept, often referred to as the "commercial peace theory," suggests that trade creates incentives for diplomatic resolution of disputes rather than resorting to military action.
Trade agreements and regional blocs, such as the European Union (EU), the North American Free Trade Agreement (NAFTA), now replaced by the United States-Mexico-Canada Agreement (USMCA), and the Association of Southeast Asian Nations (ASEAN), exemplify how economic interdependence can strengthen political and strategic relationships. These agreements provide frameworks for conflict resolution, promote political dialogue, and encourage harmonization of regulations and standards.
5. Global Supply Chains and Economic Resilience
In the modern global economy, trade underpins complex supply chains that span multiple continents. These supply chains allow producers to source raw materials from one country, manufacture components in another, and assemble final products elsewhere. Such interconnections increase efficiency, reduce costs, and enable countries to respond flexibly to demand fluctuations.
However, global trade also exposes economies to vulnerabilities, as seen during the COVID-19 pandemic when disruptions in supply chains caused shortages of essential goods worldwide. Despite these challenges, trade networks remain crucial for resilience, as they allow countries to diversify suppliers, maintain reserves, and adapt to changing conditions.
6. Reduction of Poverty and Inequality
Global trade has a significant role in poverty reduction, particularly in developing countries. Export-oriented growth strategies can create jobs, increase wages, and raise living standards. For instance, the export-led manufacturing boom in East Asia lifted millions of people out of poverty over the past few decades. By participating in global markets, developing nations can generate revenue to invest in education, healthcare, and infrastructure, creating a virtuous cycle of growth and development.
Moreover, trade can help reduce income inequality between nations by offering poorer countries opportunities to integrate into the global economy. While domestic inequality may persist, global trade can level the playing field by enabling developing countries to compete internationally and improve their citizens’ economic prospects.
7. Cultural Exchange and Global Understanding
Beyond economics, global trade promotes cultural exchange. The movement of goods, services, and people leads to the diffusion of ideas, lifestyles, and traditions. Products such as fashion, cuisine, music, and art often cross borders alongside commerce, fostering cultural appreciation and understanding. In a world facing global challenges such as climate change and pandemics, mutual understanding and cooperation are essential, and trade acts as a conduit for building these bridges.
8. Challenges and Considerations
While global trade offers immense benefits, it is not without challenges. Trade imbalances, protectionism, unfair competition, and exploitation of labor are pressing concerns. Additionally, overreliance on global markets can expose economies to external shocks, such as financial crises, political instability, or natural disasters in trading partner countries. Sustainable and fair trade practices, along with robust regulatory frameworks, are essential to ensure that trade remains a force for inclusive and long-term development.
Conclusion
Global trade is a fundamental driver of economic prosperity, technological advancement, cultural exchange, and international cooperation. It enables countries to specialize, innovate, and access a wider variety of goods and services. It promotes peace, enhances resilience through interconnected supply chains, and has the potential to reduce poverty and inequality worldwide. However, the benefits of trade must be balanced with policies that mitigate risks, ensure fairness, and promote sustainable development.
In the contemporary era, where globalization defines economic and social landscapes, the crucial role of global trade cannot be overstated. It remains not just an economic mechanism but a vital force shaping the trajectory of human progress, international relations, and global well-being.

Risks and Opportunities in the Global MarketOpportunities in the Global Market
Market Expansion and Revenue Growth
One of the primary opportunities in the global market is access to a much larger customer base. Companies can transcend domestic limitations and tap into emerging markets where consumer demand is growing rapidly. For example, markets in Asia, Africa, and Latin America offer a burgeoning middle class eager for goods, services, and technology, presenting massive revenue potential for multinational corporations. By diversifying geographically, businesses can reduce dependence on a single economy and enhance growth prospects.
Diversification of Investments
Global markets allow investors to diversify their portfolios across countries, sectors, and asset classes. Diversification reduces exposure to localized economic shocks and political instability. For instance, investing in equities, bonds, or commodities in different regions can balance risks arising from currency fluctuations, interest rate changes, or domestic policy shifts. This strategic allocation of resources can improve the risk-return profile of investments significantly.
Access to Innovation and Technology
Global integration fosters technological exchange and innovation. Companies can leverage global research and development networks, access advanced manufacturing technologies, and adopt best practices from international competitors. For emerging economies, collaboration with global firms can accelerate industrialization, improve efficiency, and enhance product quality. Likewise, global partnerships in sectors like artificial intelligence, renewable energy, and biotechnology create opportunities for breakthrough innovations that can reshape entire industries.
Economies of Scale and Cost Efficiency
Operating in the global market enables companies to achieve economies of scale. Large-scale production and sourcing from multiple countries often reduce costs, improve margins, and increase competitiveness. For instance, technology firms may design products in one country, source components from another, and sell worldwide, optimizing both production costs and logistics. Additionally, access to cheaper labor and raw materials in developing economies can further enhance profitability.
Financial and Capital Access
Global financial markets provide businesses and governments with access to diverse funding sources. Companies can raise capital through international stock exchanges, global bonds, or foreign direct investment. Governments can finance infrastructure and development projects through international loans or aid. This access to global capital allows for ambitious projects and long-term strategic investments that would otherwise be unattainable.
Strategic Partnerships and Alliances
The global market encourages cross-border collaborations. Strategic alliances, joint ventures, and mergers allow companies to enter new markets more efficiently and share risks. Partnerships with local firms also help navigate regulatory environments, cultural differences, and logistical challenges. Collaborative ventures often drive innovation, improve market penetration, and enhance brand credibility in foreign markets.
Risks in the Global Market
Economic Volatility and Financial Crises
Global markets are highly interconnected, making them susceptible to economic volatility. A crisis in one major economy can ripple across borders, affecting trade, investment, and employment worldwide. The 2008 financial crisis and the COVID-19 pandemic demonstrated how quickly global shocks can destabilize markets. Currency devaluations, stock market crashes, and sudden shifts in capital flows are persistent risks for investors and multinational companies.
Political and Geopolitical Risks
Political instability, trade disputes, and geopolitical tensions pose significant risks. Conflicts, sanctions, or changes in government policies can disrupt supply chains, inflate costs, and limit market access. For instance, trade wars between major economies may lead to tariffs, export restrictions, and reduced demand for goods. Political risk is particularly relevant for companies investing in emerging markets, where governance structures may be less predictable.
Regulatory and Compliance Challenges
Global operations require navigating a complex web of regulations, including taxation, labor laws, environmental standards, and data protection. Non-compliance can result in legal penalties, reputational damage, or operational shutdowns. Differences in regulations across countries also make standardization difficult, increasing operational costs and complexity. Companies must continuously monitor regulatory developments to mitigate compliance risks effectively.
Currency and Exchange Rate Risks
Engaging in international trade and investment exposes companies and investors to currency risk. Exchange rate fluctuations can impact profit margins, investment valuations, and competitiveness. For example, a strengthening domestic currency can make exports more expensive, reducing sales abroad. Conversely, a weakening currency may inflate the cost of imported raw materials. Hedging strategies, while useful, do not eliminate currency risk entirely.
Supply Chain Disruptions
Global supply chains are vulnerable to natural disasters, pandemics, labor strikes, and geopolitical tensions. Disruptions can delay production, increase costs, and reduce customer satisfaction. For example, the COVID-19 pandemic revealed the fragility of just-in-time supply chains, prompting companies to reconsider sourcing strategies and inventory management. Dependence on specific regions for critical components increases operational risks.
Technological and Cybersecurity Risks
While global markets offer access to technology, they also expose businesses to cybersecurity threats. Data breaches, intellectual property theft, and cyberattacks can lead to financial loss, reputational damage, and legal liabilities. Rapid technological changes also create the risk of obsolescence; companies that fail to innovate may lose competitive advantage. Protecting digital infrastructure and continuously adapting to technological trends is critical for global operations.
Cultural and Market Risks
Entering new markets involves understanding local consumer behavior, culture, and preferences. Misreading these factors can result in product failures, marketing missteps, and brand damage. Companies must adapt strategies to local contexts while balancing global standardization. Failure to address cultural sensitivities can hinder market acceptance and growth.
Balancing Risks and Opportunities
Navigating the global market requires a careful balance between seizing opportunities and mitigating risks. Strategies for achieving this balance include:
Diversification: Spread investments across multiple countries, sectors, and currencies.
Risk Management: Implement financial hedging, insurance, and contingency planning.
Strategic Alliances: Collaborate with local partners to reduce market entry risks.
Technology and Innovation: Invest in digital infrastructure, cybersecurity, and R&D.
Compliance and Governance: Maintain robust regulatory compliance and ethical standards.
Agility and Adaptation: Be flexible in responding to geopolitical, economic, and market changes.
Conclusion
The global market is a dynamic landscape characterized by immense opportunities and significant risks. Companies and investors that can navigate these complexities stand to gain from expanded markets, innovation, cost efficiencies, and diversified revenue streams. However, economic volatility, political uncertainties, regulatory complexities, and technological risks demand careful planning, proactive risk management, and strategic foresight. The key to success lies in balancing the pursuit of growth with robust safeguards, leveraging both global connectivity and local insight. In an increasingly interconnected world, the ability to adapt and innovate while managing risk will define the long-term winners in the global market.
GOOGL Stock Forming a BIG Pattern — Key Levels You MUST Watch!In this video, I break down a clear chart pattern forming on GOOGL (Alphabet) stock, using detailed technical analysis.
You’ll see exactly how the pattern developed, what levels matter right now, and where the stock could move next.
🔍 What’s Covered in This Analysis:
GOOGL’s current chart structure
Clear pattern formation (triangle / channel / flag / wedge — based on your chart)
Key support & resistance zones
Breakout / breakdown levels
Trend strength and momentum
Short-term price targets
Medium-term technical outlook
Risk levels & invalidation points
📈 Why This Matters
Alphabet (GOOGL) is showing a highly tradable technical setup, and understanding this chart pattern can help you spot the next big move before it happens.
Perfect for:
Day traders
Swing traders
Long-term technical investors
Anyone following large-cap tech stocks

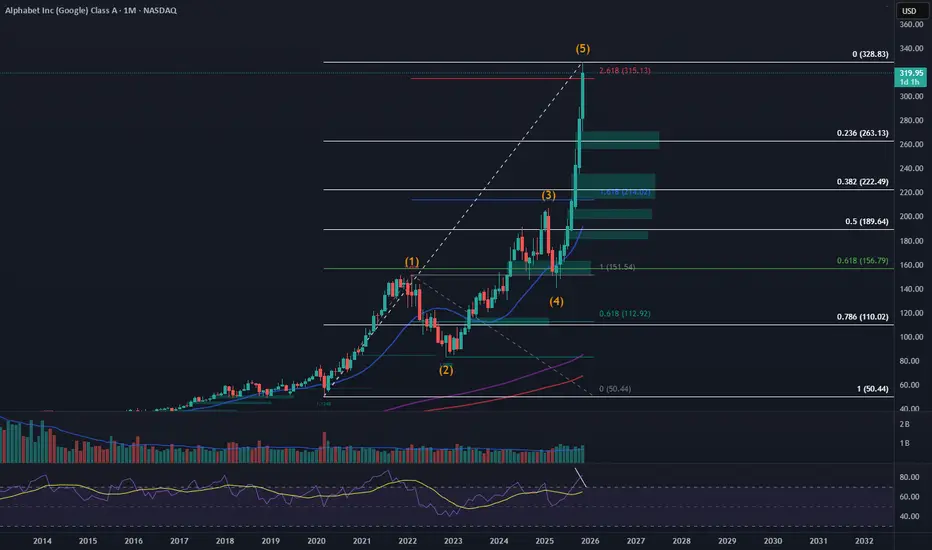
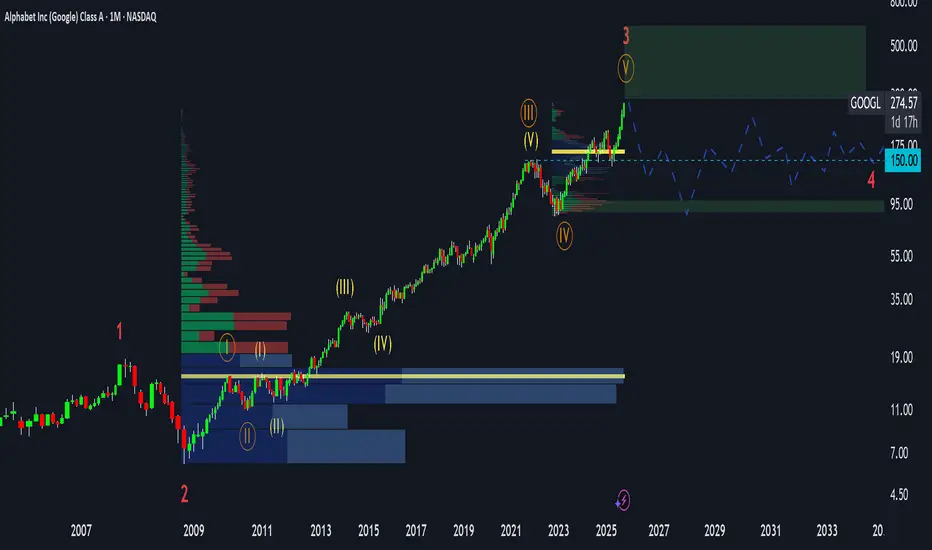
Alphabet (GOOGL) – Completing a Major Elliott Wave Cycle at 2.61Alphabet has reached the 2.618 Fibonacci extension of the entire macro impulsive structure, marking a potential completion of Wave (5) on the monthly timeframe. Price extended aggressively from the Wave (4) low and is now interacting with a historically significant Fibonacci exhaustion zone.
RSI also shows signs of potential macro divergence in daiy timeframe.
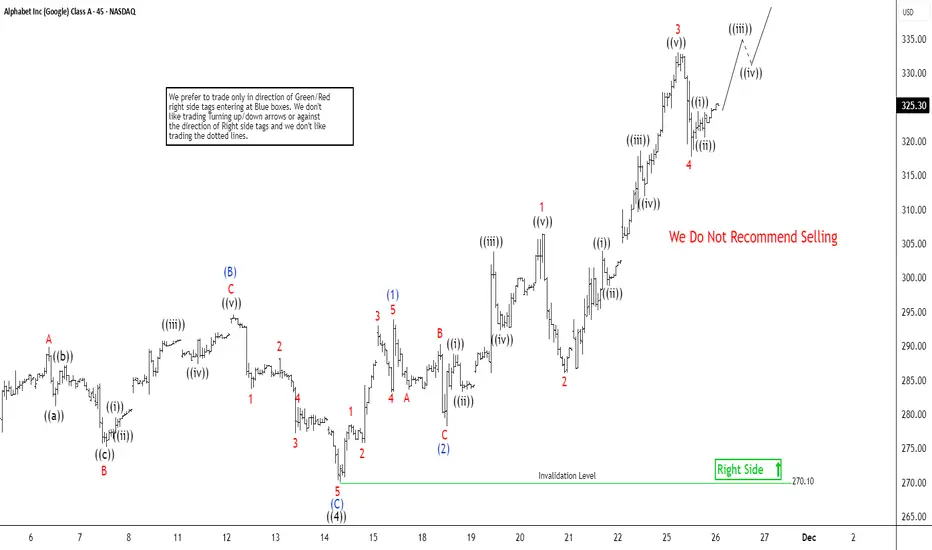
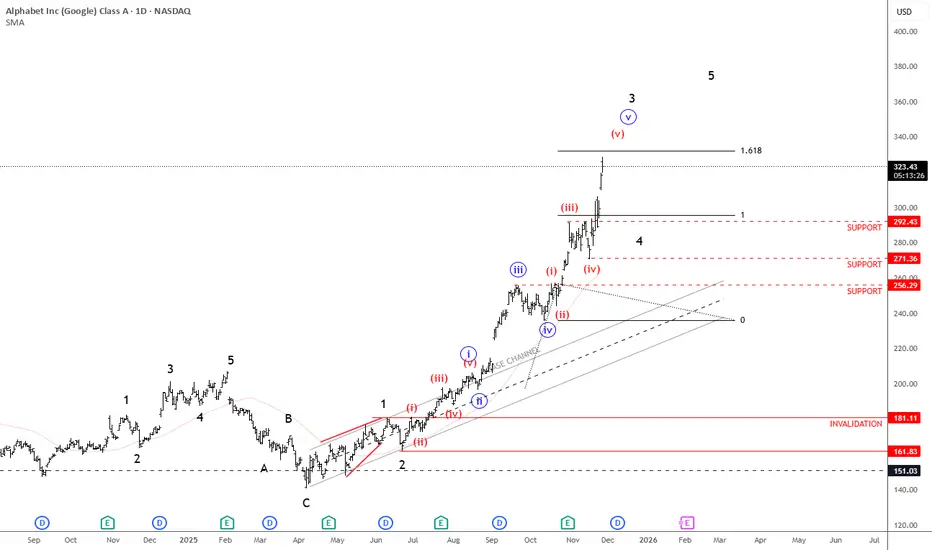
Google Stock (GOOGL) Approaches Historic Peak, $336 in SightThe short-term Elliott Wave view in Google (GOOGL) indicates that the stock is progressing within the final wave ((5)) of the impulsive rally that began from the April 2025 low. Wave ((4)) of this sequence concluded at $270.1, as reflected in the 45-minute chart. Following that completion, the stock resumed its advance toward new all-time highs, unfolding wave ((5)) as a five-wave impulse of lesser degree. From the termination of wave ((4)), wave (1) reached $293.95, while the corrective pullback in wave (2) settled at $278.2. The structure then nested higher into wave (3), reinforcing the bullish momentum.
From wave (2), wave 1 advanced to $306.42, followed by a modest dip in wave 2 that ended at $286.05. The third wave extended strongly, culminating at $332.98, before a corrective decline in wave 4 brought prices down to $317.65. The expectation now is for the stock to extend higher once more, completing wave 5 and thereby finalizing wave (3) of the larger degree. Afterward, a corrective phase in wave (4) should emerge, setting the stage for another rally in wave (5). This final advance would complete wave ((5)) and the broader cycle from the April 2025 low.
In the near term, as long as the pivotal support at $270.1 remains intact, dips are anticipated to find support within the typical three, seven, or eleven swing corrective structures. This suggests that the broader outlook continues to favor further upside, with each corrective phase offering opportunities for continuation of the bullish trend.
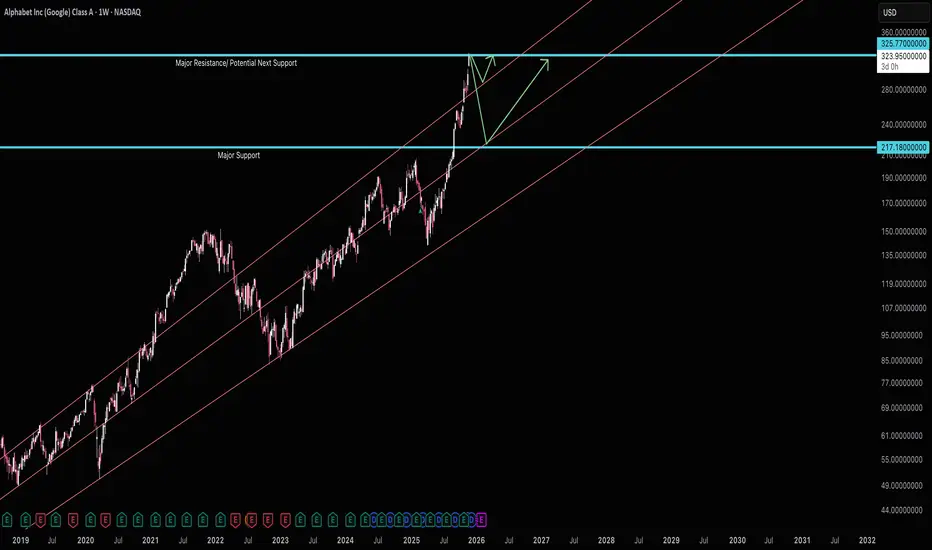
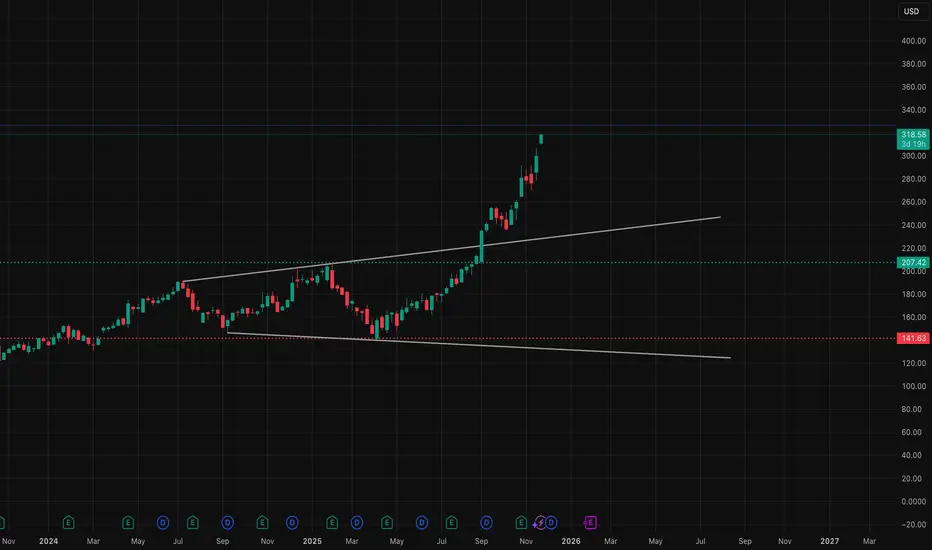
GOOG — Key Support 161; Bullish Extensions Toward 570.31Here’s a polished, TradingView-ready analysis in English — proofread and ready to publish — with key support set to 161 as you Alphabet (GOOG) is in a clear uptrend after a sustained bullish leg. Price is currently finding resistance near the short-term Fibonacci cluster, but the broader structure remains constructive while key support holds.
Key structural level: 161 — this is the primary long-term support / accumulation zone on the chart. As long as price stays well above 161, the bullish scenario stays valid.
Upside targets (Fibonacci extensions):
0.40 → 315.77 (near-term resistance)
0.50 → 358.19
0.618 → 408.20
0.75 → 464.25
0.90 → 527.89
Final target → 570.31
Price context: The market is showing momentum, but must break and hold above the immediate resistance cluster to accelerate the next extension. A series of higher highs and higher lows would confirm the continuation toward the targets above.
Alternative Scenario
If the current bullish reaction fails and selling pressure increases, expect a deeper retracement toward the structural support at 161. That zone represents the strongest demand area and liquidity base; a successful re-accumulation there would preserve the longer-term bullish thesis and improve reward-to-risk for buyers targeting the extension levels.

Got Microcaps?Sure the market is whipsawing up and down, the VIX is comparatively high, and the Head and Shoulders pattern on Bitcoin and SPY looms large. But... have you checked out IWC, the ETF that tracks an index of microcap stocks? They have performed in line with other indexes, but today this ETF is up two and a half percent, while QQQ and SPY are plodding higher at less than one percent.
Looking for setups on small caps and micro caps might be a worthwhile addition to your trading tactics from now until the end of the year.
GOOGL Long Alert: Katy AI Projects Upward Push AheadGOOGL QuantSignals Katy 1M Prediction 2025-11-25
Direction: LONG
Entry Price: ~$322.51
Target: ~$323.93
Stop Loss: ~$317.67
Confidence: ~55%
Trend: Neutral-to-slightly bullish
Volatility Estimate: ~24.1%
📊 TradingView Insights & Technical Context
According to recent Trade Ideas on TradingView:
GOOGL broke above a long-term ascending trendline resistance, which signals structural bullishness.
TradingView
+1
Some analysts highlight key resistance zones around $313–316 (or higher depending on update) and support around the $300 mark.
TradingView
+1
On the chart: price is in a consolidation/accumulation phase after previous strong trends. Some analyses suggest this phase precedes the next leg higher if key levels hold.
TradingView
+1
Fundamental driver: The company continues investing heavily in AI, cloud, infrastructure which supports the bullish narrative. (Though this is general market commentary, not specific to the trade setup).
⚠️ Risks & Considerations
Trend is labelled “Neutral” in your summary, so upside is modest. The target (~$323.93) is only ~0.5% above the entry — means limited upside relative to potential risk.
The quoted volatility (~24.1%) suggests the stock could move significantly, both up and down, so managing stop-loss is key.
Market technicals hint at major resistance zones; if the stock fails to clear them the upside could stall.
Even strong fundamentals don’t guarantee short-term movement especially when the trend is neutral or the trade horizon is short.
🧭 Why the Title Works
“Long Alert” is appropriate given the bullish bias, albeit moderate.
“Katy AI Projects Upward Push Ahead” links the trade to your AI-driven signal model (Katy AI) which adds thematic weight.
Alphabet Into $325 ResistanceGoogle/Alphabet has ripped through 217 and now at 325. The trouble with a fast move like this is there's heavy money looking for reversion to the mean. We are very far form any long term trend lines and up above the post-covid maximum trend line. Holding onto GOOG/GOOGL is highly risky here.
Major resistances like $217 almost always get checked back into so the risk of $217 is very high. I know google's revenue has been showing signs of accelerating, but not at fast enough rates that make me think it can fully avoid hitting 217.
So short resistance here 325 targeting 217.
Good luck!
Google Is In Strong Bullish Trend; Unfolding A Five-Wave ImpulseAlphabet (Google) is a huge tech company best known for its search engine, but it also makes things like Android, YouTube, Gmail, and cloud services. Google is pushing hard into AI and cloud computing. They’re rebuilding search with AI, making stronger chips, and growing Google Cloud fast. They’re also investing in long-term tech like self-driving cars and quantum computing.
Google is in a very strong uptrend as expected, but we can now count five waves up within the black wave three cycle from around 160. Ideally, the next pullback would be wave four, stabilizing near the previous fourth-wave area around 292–271. And once or if we see that kind of correction, that's when new buying opportunities could appear, but for now, it’s better to stay cautious since we may already be in the later stages of this cycle.
Highlights:
Trend: Strong uptrend, but nearing late stages of wave three
Potential: Pullback in wave four before continuation higher
Support: 292–271 zone
Invalidation: Below 200
Note: watch for a correction before new long setups
GOOGL long-term TAGoogle is strictly bullish on long-term, is one of the best survivors in tech sector at the moment during this market correction. But be aware of the negative divergence on mid-term, the negative correlation between price and volumes accumulation has been building up recently, which means eventually the correction will occur and then it could be a wise stock to pick up.

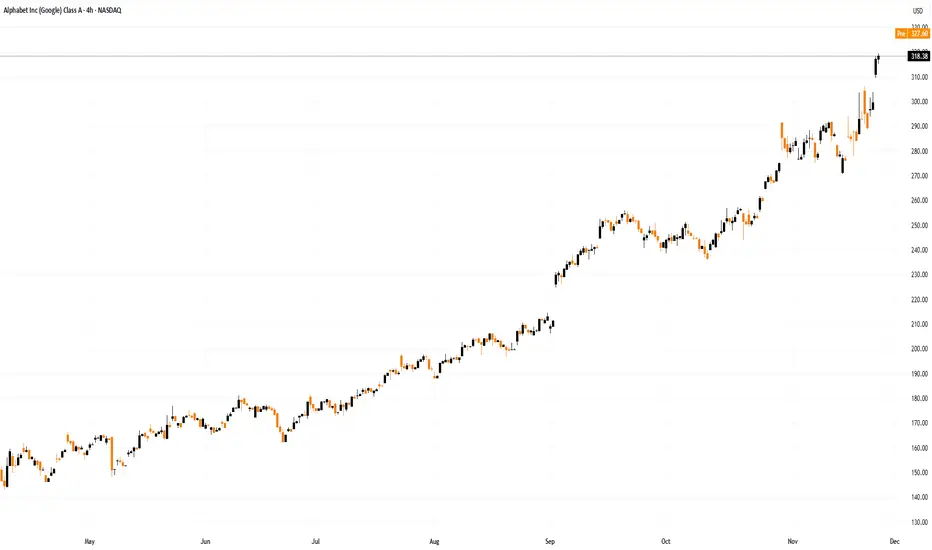
Alphabet (GOOGL) Shares Close Above $300 for the First TimeAlphabet (GOOGL) Shares Close Above $300 for the First Time
Charts show that Alphabet (GOOGL) shares have reached a record high, closing around $318. In doing so:
→ the price has surpassed the psychological $300 mark;
→ the stock has gained roughly 70% since the start of the year;
→ Larry Page has become the world’s second-richest person, after Elon Musk.
Why Have Alphabet Shares Risen?
The surge is explained by several factors, the most significant being news of strong performance in tests of the AI model Gemini, upgraded to version 3.0. In many benchmarks, it outperformed ChatGPT.
The rise in GOOGL’s share price seems to signal a shift in leadership in the “best AI” race — which could translate into higher sales of paid Gemini versions and increased revenue for Alphabet, which already exceeds analyst expectations, as confirmed by the report released in late October.
Technical Analysis of GOOGL Shares
Price movements have formed an ascending channel (shown in blue), originating in the summer of this year. Along the way, the price recently encountered resistance around:
→ $290: acting as a barrier following the earnings release;
→ $300: a psychological hurdle, as investors were hesitant to pay over three hundred dollars per share.
These levels had kept the price in the lower half of the channel. Now, with GOOGL’s fundamentals strengthened, the stock has reached the channel’s median — typically a point where supply and demand balance. It is reasonable to assume that:
→ the bullish momentum may begin to ease;
→ in the event of a correction, the $290–300 zone may shift roles to act as support, reinforced by the channel’s lower boundary.
This article represents the opinion of the Companies operating under the FXOpen brand only. It is not to be construed as an offer, solicitation, or recommendation with respect to products and services provided by the Companies operating under the FXOpen brand, nor is it to be considered financial advice.
GOOGL skyrocketed with the launch of Gemini 3
The new LLM model, Gemini 3, unveiled last week, has garnered positive reviews. Salesforce founder Benioff, who used ChatGPT daily for three years, stated that after using Gemini 3 for about two hours, he has no intention of returning to ChatGPT. Google's share of the AI market has significantly increased, rising from 23.4% before the launch of Gemini to 30.1% afterward.
Altman is also wary of Gemini. Referring to Google's recent AI achievements, he acknowledged that the internal atmosphere at his company might be uneasy for some time and that Google could present a temporary economic headwind to the firm.
GOOGL maintains its steep uptrend, approaching the ascending channel’s upper bound and the resistance at 320.00. Diverging bullish EMAs point to a potential uptrend extension.
If GOOGL breaches above the channel's upper bound and 320.00, the price may advance toward the new high and psychological resistance at 330.00.
Conversely, if GOOGL fails to close above 320.00, the price may temporarily retreat toward the following support at 300.00.

GOOGL Breaking Out Again? Key Levels This WeekWeekly timeframe:
GOOGL is in one of the strongest momentum runs in the market right now. Price just pushed above the previous weekly resistance around 315 and is now trading in open space with very little historical supply until the 325–330 zone. The weekly structure is still a clean higher-high, higher-low sequence with strong trend continuation. As long as price holds above 295, this weekly bullish trend remains intact. The only concern here is the speed of the move — this candle is extended and approaching the upper channel line, which often leads to a short-term pullback before continuation.
Daily timeframe:
The daily chart shows a clear breakout from the rising channel after a BOS move and retest. Buyers defended the 300 area multiple times, creating a strong demand zone below. Current price is sitting inside a small supply zone around 320–327, which has potential to reject short-term, especially after a fast run. If buyers maintain control above 310, continuation toward 330 is likely. A rejection back under 310 opens the door toward 300–295 demand for a healthier pullback.
1-hour timeframe:
Short-term momentum still favors upside, but price looks stretched. The last push created a BOS into supply, and volume is slowing. If 315 holds as intraday support, we could see another attempt toward 325–330. If 315 fails, watch 310 first, then 305 for deeper retracement levels.
GEX sentiment:
Options positioning is supporting the bullish scenario. The highest positive GEX levels sit around 320–330, acting as a magnet. Below, the strongest put support sits near 295. This creates a favored range between 310 and 325 for the short term. As long as price stays above 310, market makers have incentive to keep price elevated.
My thoughts:
GOOGL remains one of the cleanest trending names right now. The weekly structure suggests continuation, but the lower timeframes show exhaustion. Best opportunities likely come from pullbacks rather than chasing highs. Watching for either a breakout retest above 320 or a dip toward 310 for a higher low setup.
Conclusion:
Bullish overall trend
Upside target 325–330
Support zone 310–305
Major support 295
Disclaimer:
This analysis is for educational purposes only and does not constitute financial advice. Always do your own research and manage your risk before trading.
W. BUFFETT GOES 'GOOGLE'. DOES IT WORTH TO FOLLOW HIM AT PEAKSWarren Buffett has recently led Berkshire Hathaway to buy around $5 billion in Alphabet stock NASDAQ:GOOGL during the third quarter of 2025, making Alphabet one of Berkshire’s top ten holdings and sparking renewed interest in whether following Buffett’s move makes sense at today’s stock highs.
Technical Analysis
Alphabet is currently in a well-defined uptrend, with its price above short-term moving averages and an RSI near 60, indicating bullish momentum but no overbought signals.
Price action shows consolidation near highs (around $283–$290), pointing to the potential for a breakout, particularly with increasing volume on up days, which is a sign of institutional accumulation.
Critical technical levels: $260 (major support), $283–$290 (resistance zone). If the stock holds above $260 (Q3 2025 peaks), the underlying trend appears robust, but any reversal signals near resistance should be watched closely.
Momentum indicators (RSI, MACD) and stable volume profile suggest sustained optimism but prudent risk management is advised in case sentiment shifts.
Fundamental Analysis
Alphabet boasts strong recent earnings, with robust year-over-year growth in revenue and profit, especially from AI and Cloud businesses. Analyst consensus remains bullish, supported by upward revisions in price targets.
Valuation: Currently trading at roughly $284 per share, Alphabet’s price-to-earnings (P/E) ratio sits around 28, which is relatively attractive for a company growing earnings per share (EPS) at over 17% per year and maintaining high margins (ROE 32%, ROA 23%).
Intrinsic value estimates (base case) place fair value closer to $180, suggesting the stock is technically overvalued on traditional models, though AI/cloud potential and ecosystem advantages could justify a premium.
Key strengths: Dominant data ecosystem (Search, Android, Chrome, Gmail), world-leading AI research (DeepMind, Gemini), and a healthy balance sheet (minimal debt, strong free cash flow).
Risks: Heavy reliance on ad revenue, potential regulatory headwinds (especially in the EU), and risk of AI-driven disruption to legacy business lines.
Does It Worth to Follow Buffett at the Google' Peak?
Buffett’s purchase signals confidence in Alphabet’s long-term moat and ability to transition to AI-driven growth, despite current valuations appearing rich by historical standards.
Technically, the uptrend has not shown signs of exhaustion, and volume patterns indicate continued market accumulation. But buying near technical resistance always carries risk of short-term pullback.
Fundamentally, Alphabet’s growth engines, profitability, and fortress balance sheet remain appealing. However, potential macroeconomic and regulatory shocks are real, and intrinsic valuations suggest caution for value-focused investors.
Beta-relative testing
We have examined Google stock in AU measure (one stock value in grams of gold). The graph below indicates on major long term upside trend, with a possible nearly 60% further upward potential is such measurement.
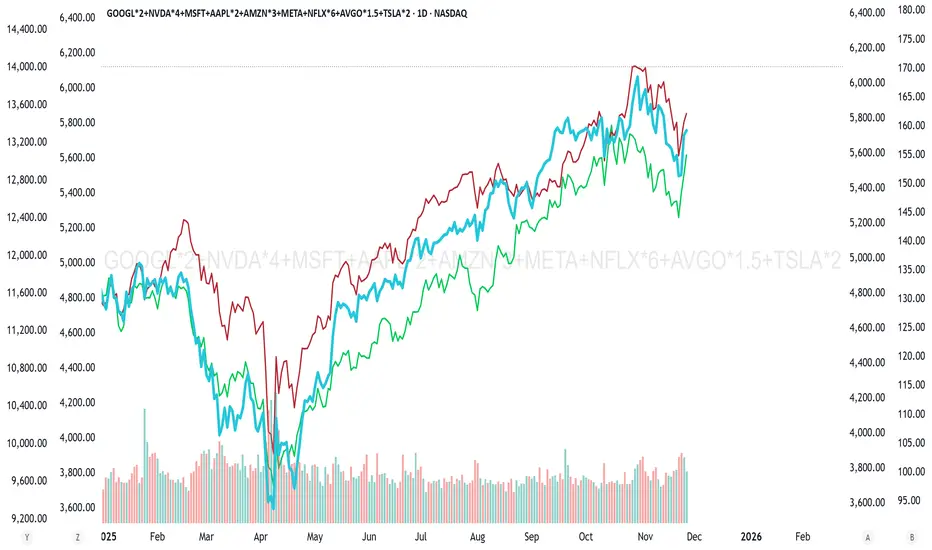
We have also tested Google stock in a measure of Nasdaq-100 (in example below NASDAQ:QQQ has been used; both - Google stock and QQQ - were used in 'total return' format).
Well, right now we can consider that multi-year 'flat regime' finally goes to breakthrough.
In conclusion, following Buffett now is technically supported by trend and recent accumulation, and fundamentally underpinned by growth, but it means accepting a premium and faithfully betting that Alphabet’s evolving AI/assets will deliver above-model returns over time.

GOOGL watch $313-316: Major Resistance zone could mark a TOPGOOGL has been flying high on the success of Gemini.
Just hit a major resistance zone at $313.21-316.33
Looking for a Dip-to-Fib like $294.08 or below to buy.

Alphabet Inc. (Google) bullish momentum poised for another break
Current Price: $292.69
Direction: LONG
Confidence Level: 78%
Targets:
- T1 = $300.00
- T2 = $310.00
Stop Levels:
- S1 = $288.00
- S2 = $283.50
**Wisdom of Professional Traders:**
The collective voice of professional traders is leaning strongly bullish on Alphabet this week. Multiple traders highlighted that Google has been the standout among mega-cap tech stocks, often closing at or near all-time highs and holding above key moving averages while peers like Meta, Nvidia, and Tesla saw significant weakness. Across the trader community, there is recurring focus on upside potential driven by the successful Gemini 3 AI launch, dominance in advertising, and significant institutional buying interest, including Warren Buffett's investment. Several traders also pointed out bullish options flow targeting higher strikes into $310–$320.
**Key Insights:**
Here’s what stands out to me: Google isn’t just keeping pace in the AI race—traders see it as taking the lead. The Gemini 3 model’s performance against OpenAI’s ChatGPT has fueled enthusiasm, with the market viewing Alphabet as a “long-term AI winner” capable of both innovation and profitable deployment. Multiple traders mentioned that it remains one of the few big tech names above its 55-day moving average, reflecting technical strength. Heavy call buying, including multi-million-dollar long-term positions, signals strong conviction from big money players aiming well above the current price.
What’s interesting is how resilient Google’s price action has been. Even in weeks where the broader market dipped, it often bucked the trend. Some pros warned about valuation stretch, but they still favored upside in the near term given the momentum and relative strength. This week’s key battleground is the $300 level, cited repeatedly as a resistance-to-break point that could open a pathway toward $310.
**Recent Performance:**
Last week, Google surged more than 8% to notch fresh record highs, driven by AI-related headlines and outperformance in the Communication Services sector. It repeatedly tested the $298–$300 zone, with Friday's close firmly above $292 after a brief pullback. Price action has shown higher highs and higher lows, which traders are watching closely as a bullish structure. Dark pool and options activity has supported the move, with notable gamma exposure centered at the $300 strike.
**Expert Analysis:**
Several professional traders are reading the chart as a textbook bullish setup—breakout from consolidation, clean uptrend, and strong relative strength vs. the MAG7 cohort. Many are eyeing $300 as the near-term breakout trigger, with $310 next if momentum builds. The $288 zone is being watched as first key support, followed by the $283–$284 area, which aligns with short-term swing lows. Fundamental catalysts, like stronger AI monetization potential in advertising and cloud, are reinforcing the technical read.
**News Impact:**
Fresh headlines around Google’s integrated AI stack—Gemini 3, Nano Banana Pro, and in-house TPU acceleration—are creating a narrative of competitive advantage. The confirmed Berkshire Hathaway buy only strengthens market sentiment. With the Federal Reserve expected to hold or ease rates into year-end and AI-driven ad revenues projected to lift margins, sentiment gains further tailwind. This positive backdrop is amplifying trader conviction for a sustained push through resistance.
**Trading Recommendation:**
Here’s my take: I like the long side as long as price holds above $288 support this week. A break and hold over $300 could drive a quick run to $310 on momentum and follow-through buying. I’d size in moderately at current levels, add on a confirmed break above $300, and keep stops tight under $288 to limit downside risk. This setup offers a solid risk-reward, backed by both technical and fundamental strength.

Investors, Traders, and Policymakers in the Global Market1. Investors in the Global Market
Investors are individuals or institutions that allocate capital with the expectation of earning returns over time. They play a crucial role in providing long-term funds for companies, governments, and global economic growth.
Types of Investors
Retail Investors – Individuals investing in stocks, bonds, mutual funds, ETFs, or real estate. Their participation has increased globally due to online trading platforms and financial awareness.
Institutional Investors – Large entities such as:
Pension funds
Sovereign wealth funds
Insurance companies
Mutual funds
Hedge funds
Endowments
These investors manage trillions of dollars and have significant influence on asset prices.
Foreign Institutional Investors (FIIs) – Non-local institutions investing in global markets. FIIs affect exchange rates, liquidity, and capital flows.
Angel Investors & Venture Capital Firms – Provide capital to startups, influencing innovation and technological development.
Role of Investors
Capital Formation: Investors provide long-term capital that fuels business expansions, infrastructure projects, and technological advancement.
Market Depth and Liquidity: Institutional investors add liquidity, allowing efficient price discovery.
Risk Distribution: Through diversified portfolios, investors help redistribute economic and financial risks across the market.
Corporate Governance: Large shareholders influence company management and strategic decisions.
Economic Growth: Investments create jobs, improve productivity, and stimulate economies.
Investor Behaviour
Investor decisions are influenced by:
Expected returns
Interest rates
Geopolitical conditions
Macroeconomic indicators (GDP, inflation, fiscal policies)
Corporate earnings
Risk appetite
Long-term investors focus on stability and compounding, while others maximize returns through active asset allocation.
2. Traders in the Global Market
Traders are market participants who seek short-term profits from price movements of financial assets. Unlike investors who focus on long-term value, traders capitalize on volatility and momentum.
Types of Traders
Day Traders – Open and close trades within the same day.
Swing Traders – Hold positions for days to weeks based on trend patterns.
Scalpers – Execute dozens or hundreds of trades daily for small price differences.
Algorithmic & High-Frequency Traders – Use automated systems to trade large volumes within milliseconds.
Prop Traders – Trade using a firm’s capital to generate profits.
Arbitrage Traders – Exploit price differences between markets or assets.
Role of Traders
Providing Liquidity: Traders keep markets fluid, enabling buyers and sellers to transact easily.
Efficient Pricing: They quickly incorporate new information into asset prices.
Market Discipline: Through speculation and short selling, traders expose weak companies and overpriced assets.
Market Support During Volatility: During high volatility, traders provide counter-orders that reduce extreme price swings.
Tools Traders Use
Technical analysis (charts, indicators, patterns)
Fundamental analysis (earnings, news, macro data)
Algo-trading systems
Options, futures, commodities, currencies, crypto
Global market correlations (oil, gold, dollar index, bond yields)
Behavioural Aspects of Traders
High risk tolerance
Dependence on market psychology
Quick decision-making
Emphasis on timing rather than long-term value
Traders thrive on volatility; hence global uncertainties often create profitable opportunities.
3. Policymakers in the Global Market
Policymakers include governments, central banks, regulatory bodies, and international economic institutions. Their decisions shape the macroeconomic environment and influence market behaviour worldwide.
Key Policymakers
Central Banks – Such as the Federal Reserve (US), ECB (Eurozone), RBI (India), Bank of Japan, etc.
Government Fiscal Authorities – Ministries of finance, treasury departments.
Market Regulators – SEBI (India), SEC (USA), FCA (UK).
International Institutions – IMF, World Bank, BIS, WTO, OECD.
Trade and Commerce Departments – Regulate tariffs, quotas, and trade agreements.
Major Roles of Policymakers
Monetary Policy: Managing interest rates, money supply, and inflation.
Fiscal Policy: Government spending, taxation, incentives, or austerity measures.
Financial Regulation: Ensuring market transparency, stability, and investor protection.
Currency Management: Adjusting exchange rate policies to support trade competitiveness.
Crisis Management: Responding to recessions, banking failures, or market crashes.
Trade Policies: Deciding tariffs, sanctions, treaties, and economic partnerships.
Impact of Policymakers on Global Markets
Interest Rate Decisions: Affect borrowing costs, investment activity, and global capital flows.
Inflation Control: Rising inflation leads to tight monetary policy and volatility.
Geopolitical Policies: Sanctions, wars, and trade agreements influence commodities, currencies, and stock markets.
Regulatory Changes: New rules can attract or restrict investment.
Stimulus Packages: Boost consumption and liquidity during downturns.
Policymakers set the environment within which investors and traders operate.
4. Interactions Between Investors, Traders, and Policymakers
The global market functions through dynamic interactions among these three groups.
How Policymakers Influence Investors
Lower interest rates make equities and riskier assets attractive.
Fiscal stimulus boosts corporate earnings prospects.
Regulatory stability attracts long-term capital.
How Policymakers Influence Traders
Economic data releases (CPI, GDP, employment numbers) trigger high volatility.
Monetary policy decisions create price movements that traders profit from.
Unexpected announcements (rate hikes, sanctions) cause sharp market reactions.
How Investors Influence Policymakers
Large institutional investors can lobby governments for favorable tax laws or policies.
How Traders Influence Markets
Heavy trading can increase liquidity and drive short-term price trends, which investors may consider in their decisions.
Conclusion
Investors, traders, and policymakers form the backbone of the global financial system. Investors provide essential long-term capital and stability, traders add liquidity and efficiency through rapid transactions, and policymakers create the economic framework and maintain stability. Their combined actions shape global economic growth, determine market cycles, and influence asset prices worldwide. Understanding their roles helps anyone—from beginners to professionals—grasp how the global market operates and how financial decisions ripple across countries and economies.
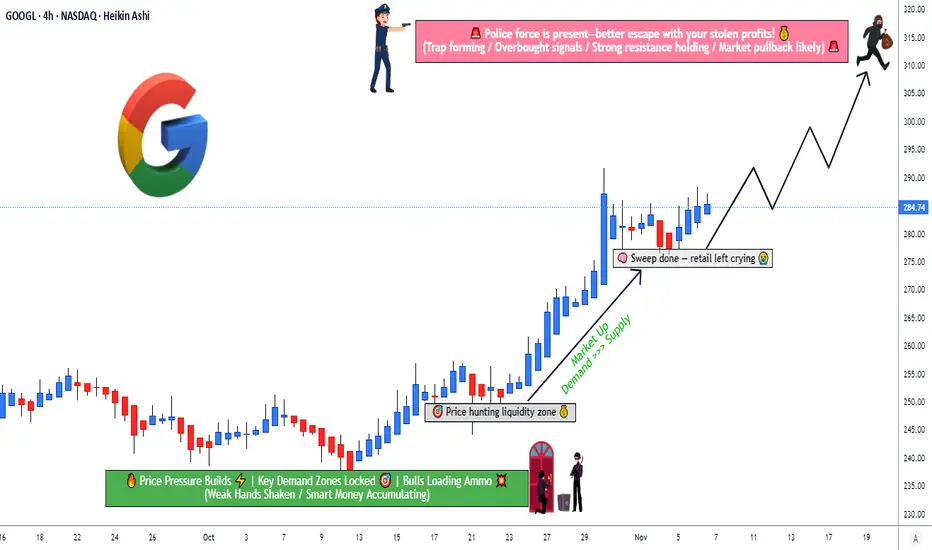
Can GOOGL Sustain Its Bullish Run Before 320 Resistance Hits?🎯 GOOGL HEIST: Operation Alphabet Escape Plan 💰
Alphabet Inc. (NASDAQ) - Swing Trade | Multi-Layer Entry Strategy
📊 THE SETUP
Sentiment: 🟢 BULLISH | Timeframe: Swing Trade | Risk Level: Medium
🎲 ENTRY STRATEGY: "THIEF LAYERING"
Strategic multi-level buy accumulation using limit orders
Layer-by-Layer Approach:
🔵 Layer 1: $270.00 (Initial entry - 30% position)
🔵 Layer 2: $275.00 (Support zone - 35% position)
🔵 Layer 3: $280.00 (Strength builder - 35% position)
Why This Works? Multiple entries reduce average cost basis and allow maximum capital efficiency. If price rejects higher, you've got fills at lower zones. If it pumps, you're already in! 💡
🛑 STOP LOSS PROTECTION
Hard Stop: 🚨 $265.00 (Below support structure)
This represents a 1.9% risk from Layer 1 entry — disciplined risk management at its finest.
⚠️ Risk Acknowledgment: Your stop loss, your rules. We're traders, not financial advisors. Adjust based on YOUR risk tolerance and account size. This is educational strategy sharing, not personalized financial advice.
🎖️ PROFIT TARGETS & ESCAPE ROUTES
Primary Target: 📈 $310.00
Strong resistance zone forming
Overbought conditions developing
Action: Take 50-60% profits here
Secondary Target: 🏆 $320.00
Police barricade zone (extreme resistance)
High trap probability at this level
Action: Scale out remaining 40-50% OR tighten stops to breakeven
Exit Philosophy: Greed kills traders. Take profits systematically. The best trade is one where you sleep well at night. 😴
⚠️ Profit Note: Your targets, your timing. Scale exits based on market conditions, volume confirmation, and YOUR comfort level.
🔗 RELATED PAIRS TO MONITOR (Correlation Watch)
🔵 NASDAQ:MSFT 📱 — High Correlation (Tech Sector) | If MSFT breaks down, GOOGL faces sector headwinds. Watch for divergence signals here first.
🔵 NASDAQ:QQQ 🔺 — 0.85+ Correlation (Nasdaq-100) | QQQ weakness = potential GOOGL pullback signal. This is your sector health check before entry.
🔵 AMEX:IWM 📊 — Inverse Correlation (Rotation Risk) | Russell 2000 strength = growth money leaving mega-caps. If small-caps pump, tech might cool off.
🔵 NASDAQ:TLT 💳 — Interest Rate Proxy | Rising bonds = tech pressure; falling bonds = tech friendly. Fed policy flows directly through here.
🔵 TVC:VIX 😰 — Volatility Index | VIX spike = risk-off, potential GOOGL liquidation. Above 20 = reduce position exposure.
Key Insight: Watch QQQ and MSFT first. They're your canary in the coal mine. If sector is weak, reconsider your entry conviction. 🚨
💎 STRATEGY SUMMARY
✅ Bullish bias with disciplined multi-entry accumulation
✅ Defined risk with hard stop at $265
✅ Staged profit-taking to lock gains systematically
✅ Correlation awareness prevents surprise sector rotations
🎬 FINAL THOUGHTS
Remember: This is the Thief Strategy™ — a fun, educational framework for swing trading, NOT financial advice. Trade at your own risk. Position sizing, stop losses, and profit targets should reflect YOUR unique situation, risk tolerance, and account size.
The heist only works if you ESCAPE with profits. Don't get caught holding the bag! 💼🚪
✨ If you find value in my analysis, a 👍 and 🚀 boost is much appreciated — it helps me share more setups with the community!
#GOOGL #AlphabetInc #SwingTrade #TechAnalysis #TradingStrategy #NASDAQ #TradingIdeas #MultiLayers #RiskManagement #Bullish #ThiefStrategy #TradingCommunity #TradingView #Technical #StockMarket
Blue Skies or Elevator Down?Currently trading inside a chop zone.
The repeated holds on the downtrend algo suggest this entire area has been accumulation around PWH/PMH. With the Berkshire stake and the negative sentiment floating around, it’s hard to know their exact cost basis — but the structure hints accumulation took place near the 50-day (around 285) and along the downtrend algo, with the upside trigger lining up at 302.65 and BPS levels at 306.89/312+.
Key levels I’m tracking:
• Low-Vol ST 1: 290.58
• Low-Vol ST 1b: 323.20
• Buy/Defense Zones: 285 • 290.58 • 295
I trade intraday — pure scalps. My entire approach is finding the pressure points where one side gets trapped and putting them against the wall.
I’m a trading assassin. I hunt bulls. I hunt bears. I survive the market.
I see the chart, and I act.

Is Google Entering Distribution? (GOOG, GOOGL Analysis)⚡ Overview
Recently, the charts of all major tech giants — Apple, Amazon, Google, Meta, and Microsoft — have started to look almost identical.
Each of them seems to be either topping out or entering what looks like a distribution phase.
In this post, I’ll share my technical and fundamental outlook on Google (GOOG, GOOGL), along with the key risks and price zones I’m watching as a trader.
💡 Fundamental View
From a fundamental perspective, Google still looks strong:
The P/E ratio has been growing steadily.
Revenue continues to rise.
The company has been aggressively buying back shares for years.
So fundamentally, this is not a bubble.
By Peter Lynch’s fair value formula, Google remains fairly valued, maybe even with a modest upside left.
However, strong fundamentals don’t always mean big growth ahead — especially when the market has already priced in perfection.
And that’s typically when the distribution phase begins.
📈 Technical View
According to Elliott Wave Theory, Google seems to be completing the fifth sub-wave within a larger third wave —
a structure that often marks the final stage before a distribution or correction phase.
On the long-term chart, price is now approaching the upper boundary of the rising channel,
with limited upside potential — possibly up to $430–$450, which represents the top zone.
Beyond that, the probability of continued growth drops sharply, while correction risk increases significantly.
⚙️ Market Structure
When analyzing the volume profile, the largest accumulation zone sits around $15 – $16 —
that’s where long-term investors entered 15 years ago.
Those early buyers are now sitting on massive unrealized profits,
and many are gradually distributing (selling) positions into current strength.
Meanwhile, retail traders often see the ongoing move as “more upside ahead.”
But in reality, this could be the final buying climax before a deeper correction.
🧩 Cycle Context
Interestingly, the same pattern is visible across Apple, Meta, Amazon, and Microsoft.
It’s not just about one stock — the entire Big Tech segment appears to be entering a similar maturity stage of the cycle.
That’s why I believe Google could soon transition from markup to distribution,
followed by a potential multi-quarter sideways or corrective phase.
💬 What’s your take? Do you think Google will reach $400 before correcting — or has the top already formed?
👇 Share your view in the comments.
Alphabet’s AI AwakeningAlphabet (Google) has been underestimated in the AI race, that’s changing fast. The launch of Gemini 3 marks a turning point, not just for the company, but for the broader narrative around who really leads the next phase of AI innovation.
Gemini 3 isn’t hype, it’s a credible, state-of-the-art model with multi-modal capabilities that challenge the best in class. Early reactions point to a system that doesn’t just generate, it reasons. For a company often seen as lagging behind OpenAI or Meta, this is a breakout moment. The stock is reacting. Google just punched through US$300 for the first time ever, with momentum that suggests this isn’t a one-off event, but the start of a re-rating.
What makes Google different is distribution. Unlike startups, it doesn’t need to chase users. Google Search, YouTube, Android, these are pipes already connected to billions of people.
Gemini isn’t stuck in a lab, it’s being embedded into products that are already part of everyday life. That gives it an unmatched scaling advantage. The AI becomes useful immediately, commercially viable, monetisable.
The market is starting to price in more than ads. Gemini opens doors, from enterprise AI in the cloud, to paid features, to deeper integration across devices. The optionality is massive. And unlike other players, Alphabet can afford to play a long game. It's well capitalised, profitable, and now it has product leadership.
It also has access to public markets, if it needs to raise more capital.
This is what makes it the dark horse. Peter Thiel also calls it the last mover advantage. Quietly positioned, now breaking out. If the current trajectory holds, Alphabet isn’t just participating in the AI boom, it’s shaping it.
For investors and traders, this isn’t about catching a trend, it’s about backing a giant that just woke up.
The forecasts provided herein are intended for informational purposes only and should not be construed as guarantees of future performance. This is an example only to enhance a consumer's understanding of the strategy being described above and is not to be taken as Blueberry Markets providing personal advice.
