Put Sale $HOODI would like to own HOOD at a lower price. Selling a PUT at my wished entry price, expiring this Friday
Trade ideas

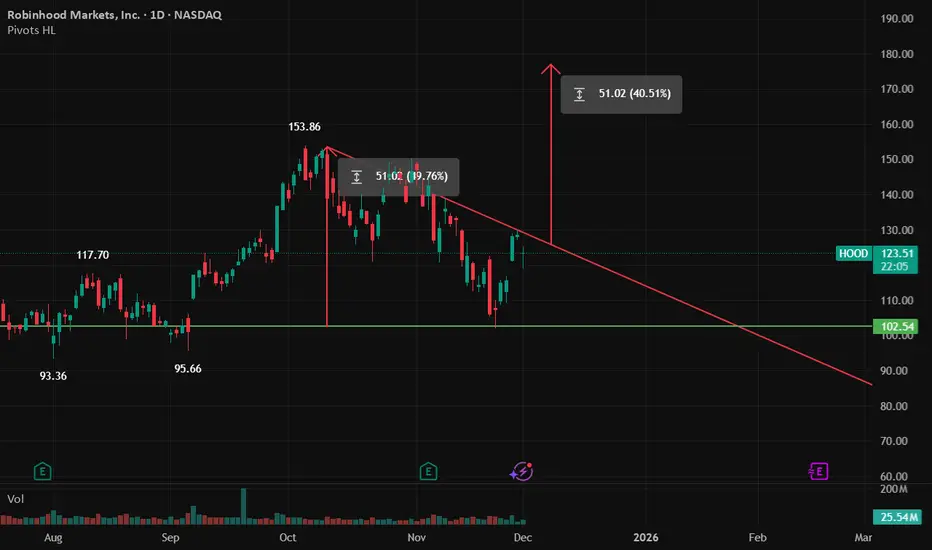
HOOD can go up in the next few daysNASDAQ:HOOD with a potential to go up by 40%+ if it will break this resistence
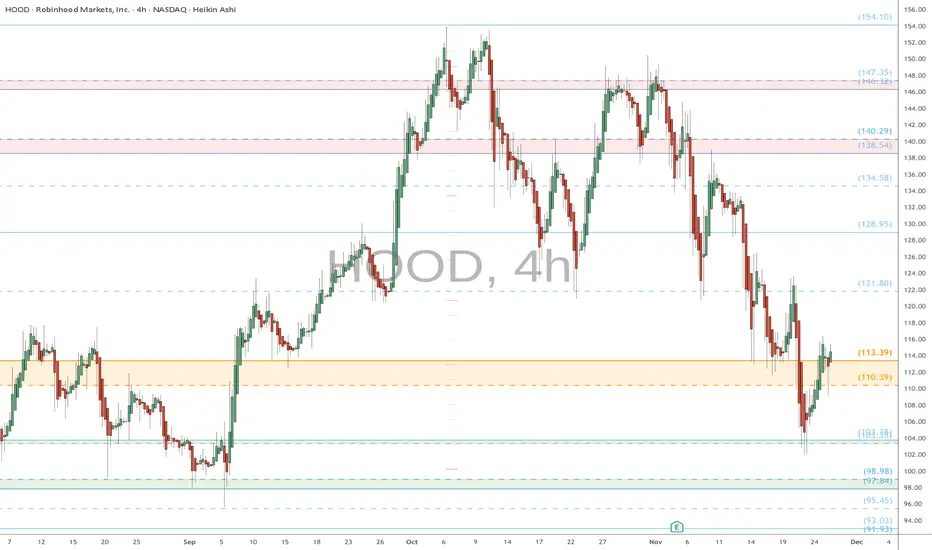
HOOD watch $110-113: Double Golden fib zone ideal BOTTOM signalHOOD may have finished an ABC correction.
Retesting Double Golden fibs at $110.39-113.39
This would be an ideal launchpad for next leg up.
.
See "Related Publications" for previous plots such as this PERFECT BREAKOUT:
Hit BOOST and FOLLOW for more such PRECISE and TIMELY charts.
========================================================
Opportunity buy at $78HOOD is likely to continue trending up following the green line, but there is a chance of $78. If it hits there get your options ready.
The main reason I'm looking for $78 is it completely skipped that area, yet a pullback and forming support was expected. That can absolutely happen, but if it goes back there that's where the opportunity is.
Good luck!

Katy AI Forecast for HOOD: Minimal Move ExpectedHOOD — QuantSignals Katy 1M Trading Brief (11/28)
🚀 Katy AI Stock Analysis
Symbol Analyzed: HOOD
Current Price: $128.58
📈 Katy Forecast
Final Prediction: $129.19 (+0.47%)
30-Min Target: $128.35 (-0.17%)
Trend: NEUTRAL
Confidence: 40% (Low)
Volatility: 17.2% (Elevated)
⚠️ Trade Signal
No trade generated — move size and confidence below threshold.
📊 Summary
Katy produced 0 actionable signals from 1 analysis.
HOOD remains directionless with low conviction and modest expected movement.

$NASDAQ:HOOD – 5 Waves done, ABC now (Long term roadmap)NASDAQ:HOOD has completed a clean 5-wave impulsive structure into the 153–160 all-time-high supply zone. After topping as Wave 5, price has begun pulling back, forming what appears to be the early stages of a larger ABC correction. Wave A looks completed near the 105 area, and the current move up is likely the developing Wave B retracement.
The B-wave bounce should run into resistance between 122 and 135, where weekly supply and Fibonacci retracements align. Once Wave B exhausts, price is expected to roll over into a Wave C decline, targeting the 80–85 demand zone, with a deeper stretch toward 73–76 if sellers remain strong.
Over the next 1–3 months, the chart favors a B-wave recovery followed by a C-wave drop. Over 6–12 months, if HOOD holds the 73-85 region and forms a higher low, a brand-new impulsive 5-wave bull cycle could begin. If the low fails, the entire bullish structure breaks, shifting the macro trend down.
Key Zones: NASDAQ:HOOD #HOOD
Weekly Supply (B-wave cap): 122 – 135
Monthly Base Support: 95 – 104
Primary C-Wave Demand: 80 – 85
Next leg up Invalidation Levels:
Deep C-Wave / Invalidation Floor: 73 – 76
Bullish Invalidation: Break and weekly hold above 153–160 cancels ABC
Bearish Invalidation: Weekly close below 73–76 kills the long-term bull count
#Robinhood #ElliottWave #ElliottWaveTheory #WaveAnalysis #ABCcorrection #TechnicalAnalysis #1WChart #StockMarketAnalysis #SwingTrading #PriceAction #SupplyDemand #TrendReversal #Investing #NASDAQ #TradingView

Is this the dip $HOOD bulls have been looking for?Is this the dip NASDAQ:HOOD bulls have been looking for?
Based on this company's financial technology innovation and the fact that they have 11 business lines that generated over $100M in annualized revenue, I am bullish on HOOD's future stock price trajectory.
After a great rally, HOOD has pulled back from $150 to $105, which I believe is an attractive buy. Idea would invalidate on a daily close below 90 which represents roughly a 15% stop loss.
My target for 2026 would be 170 and I can see this hitting $250 before 2028 if CEO Vlad continues to innovate and deliver on their product lines
Best of luck if tailing.

Robinhood: Wave 5 is GoRobinhood NASDAQ:HOOD has successfully completed the corrective Wave (4) phase on the daily chart and is now initiating the powerful final movement of the bullish cycle, Wave (5).
This critical initiation of the fifth wave projects the price beyond the Wave (3) high of $153. The initial key Fibonacci extension targets to watch are the 0.618 extension near $178 and the 0.786 extension near $199.
A move toward the 1.0 extension at $226 would signal a powerful extension of Wave (5). Sustained momentum above the key support zone confirms the start of this next leg.

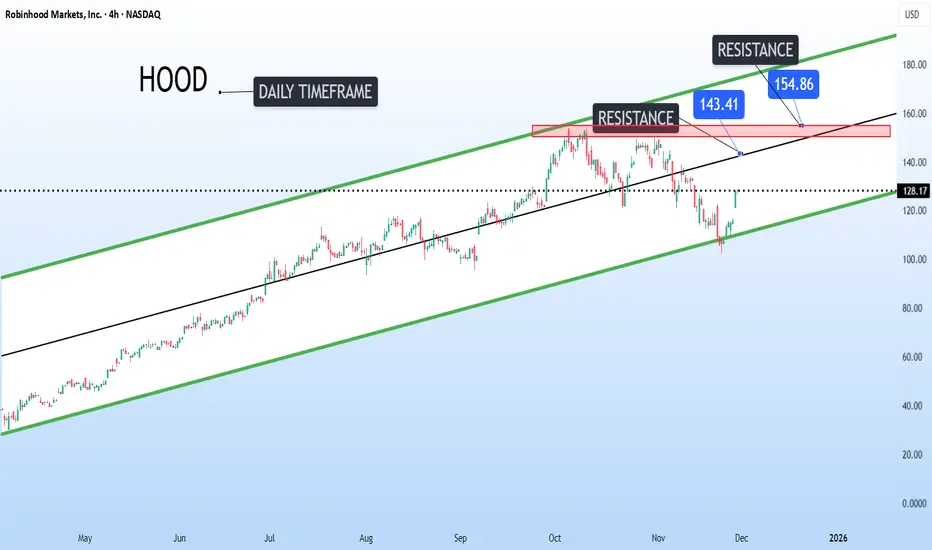
Robinhood is setting up for a major move on the daily chartRobinhood NASDAQ:HOOD is setting up for a major move on the daily chart.
Price action remains strong within the ascending channel.
The next area of possible resistance is around the mid-range of the channel near 143, depending on when it gets there.
If it breaks this level, the next resistance could be around 155.
HOOD Bearish Setup?HOOD on the daily chart has completed a clear bearish Market Structure Shift after its October peak. Price is now trading below the 20-day and 60-day moving averages (around 127.54 and 128.96), confirming short- to mid-term downside momentum, while resting on long-term support near the 120-day MA around 113.17. We’ve already seen price bounce off this zone, and with premarket now around 121, the earlier “bounce long” idea is effectively behind us.
From here, the primary plan is to fade strength into the former support turned resistance around 122.50. If price pushes into that zone and fails—confirmed by a bearish daily candle or a close back below 121.00—the short bias is favored. The first downside objective is a retest of the 110.00–113.00 area around the 120-day MA and recent lows. A clean break below 104.00 would open the door to a deeper move toward the psychological 100.00 level. Invalidation for the bearish view sits above 128.00, where a daily close would reclaim the 20- and 60-day MAs and negate the idea of simple rally-fades. This is a study, not financial advice. Manage risk and invalidations.
Thought of the Day 💡
Good trade ideas are built around “if–then” conditions, not predictions. Define the path, then wait for price to prove it.
--------------------------
Thanks for your support!
If you found this idea helpful or learned something new, drop a like 👍 and leave a comment, I’d love to hear your thoughts

ROBINHOOD HOOD Bearish Playbook — Thief on Duty!📉 ROBINHOOD MARKETS INC. (HOOD) — Bearish Profit Playbook
🔥 Swing / Day-Trade Thesis with Thief Layer Strategy
🧭 Market Context & Core Idea
The bearish outlook is confirmed after HULL Moving Average shows a downside breakout, signaling momentum shifting toward sellers. This forms the backbone of today’s playbook 📉⚔️.
The setup focuses on a layered entry (Thief Strategy) — a structured way of placing multiple limit orders at different price levels to average into premium zones with precision.
🎯 Plan: Bearish Setup with Thief-Style Layered Execution
This plan uses multiple SELL LIMIT layers, allowing flexibility and better control across volatility zones:
🔻 Layered Entry Zones (Sell Limit Layers)
125.00
120.00
115.00
110.00
(You may increase the number of layers based on your own approach — thief style is flexible.) 😎🧤
🛑 Stop-Loss (Thief SL)
SL @ 130.00
⚠️ Dear Ladies & Gentlemen (Thief OGs), this SL is not a recommendation — adjust your stop according to your own risk appetite. You make the money, you take it at your own risk.
🏁 Target Zone
The Moving Average is acting as strong support, and current structure suggests oversold conditions + a possible bullish trap scenario.
🎯 Target @ 92.00
⚠️ Dear Ladies & Gentlemen (Thief OGs), this TP is not fixed — targets must match your personal risk-to-reward logic. Manage wisely.
📊 Why This Setup Works (Key Technical Notes)
✨ HULL Moving Average breakout confirms bearish flow
✨ Multi-layer entries help capture stretched price spikes
✨ Oversold conditions hint at potential profit-taking zones
✨ Support zones + price traps increase snap-back volatility
✨ Ideal for swing/day-traders who prefer structured scaling
🔍 Related Pairs to Watch (Correlation Radar)
Tracking correlated or sentiment-linked assets helps understand broader flows:
🧩 Tech / Growth Sentiment Links:
NASDAQ:QQQ — reflects overall high-beta sentiment & liquidity
CBOE:ARKK — tracks innovation/growth appetite
NASDAQ:COIN — crypto-linked sentiment often spills into HOOD
NYSE:XYZ — fintech risk appetite correlation
NASDAQ:SOFI — retail-driven growth behavior overlaps with HOOD
🧲 Key Takeaways:
When growth ETFs weaken, HOOD typically accelerates momentum
Retail-heavy assets show higher reaction to volatility spikes
Watching these helps confirm whether HOOD’s breakdown has strength
✨ “If you find value in my analysis, a 👍 and 🚀 boost is much appreciated — it helps me share more setups with the community!”
Disclaimer: This is a thief-style trading strategy just for fun.

HOOD to $31Not in a straight line, but the general rule for a broken parabolic advance is an 80% decline

Robinhood - The third bearish crackdown!🏹Robinhood ( NASDAQ:HOOD ) will crash quite soon:
🔎Analysis summary:
Since we witnessed a major botton on Robinhood in 2023, this stock has been rallying about +1,600%. But always after a major +250% rally, Robinhood corrected at least -40%. Therefore it is quite likely that we will see another similar pattern playing out soon.
📝Levels to watch:
$150
SwingTraderPhil
SwingTrading.Simplified. | Investing.Simplified. | #LONGTERMVISION

HOOD & ROBN in BUY ZONEMy trading plan is very simple.
I buy or sell when at either of these events happen:
* Price tags the top or bottom of parallel channel zones
* Money flow volume spikes beyond it's Bollinger Bands
So...
Here's why I'm picking this symbol to do the thing.
Price in buying zone at bottom of channels
Money flow momentum is spiked negative and under at bottom of Bollinger Band
Entry at $120.50
Target is upper channel around $148 or moving average at $130
ROBN entry at $69.60, target $88 (MA) or $100 upper channel

HOOD Weekly Analysis – Past 6 months dataTicker: HOOD
POC = $99-$101
POE1 = $104 - $105.50
POE2 = $114.50 - $116
Plan: Buy if Monday closes with a green candle and high volume.

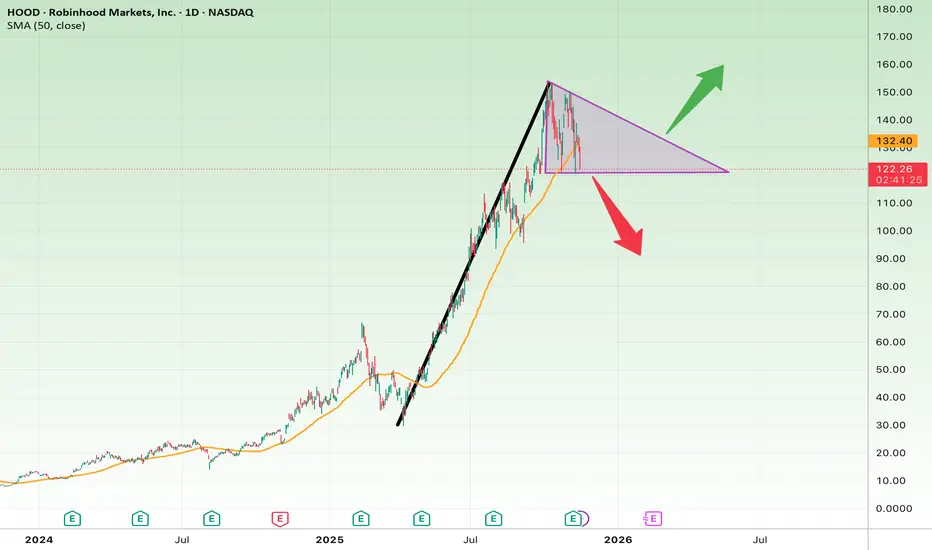
Robinhood at a Major TriangleHOOD formed a symmetrical triangle after a massive rally from ~$20 to ~$150. This consolidation now acts as a make-or-break zone.
Bullish Case:
• Break above $140 → continuation toward $160–$170
• Supported by the 50-day SMA at $111
Bearish Case:
• Drop below $120 → correction to $100–$85
Conclusion:
Robinhood is in a decisive consolidation. The breakout direction will define its next big move.
HOOD 1M AI Analysis – Neutral Trend🚀 HOOD – QuantSignals AI Analysis (1M Prediction)
Current Price: $133.27
Final Prediction: $133.08 (-0.14%)
30min Target: $132.79 (-0.36%)
Trend: Neutral
Confidence: 55%
Volatility: 32.2%
Summary:
1 stock analyzed (HOOD)
0 trade signals generated
The Market shows a neutral trend for HOOD in the near term. Small predicted movement and moderate confidence suggest holding or waiting for a clearer setup rather than taking a position.

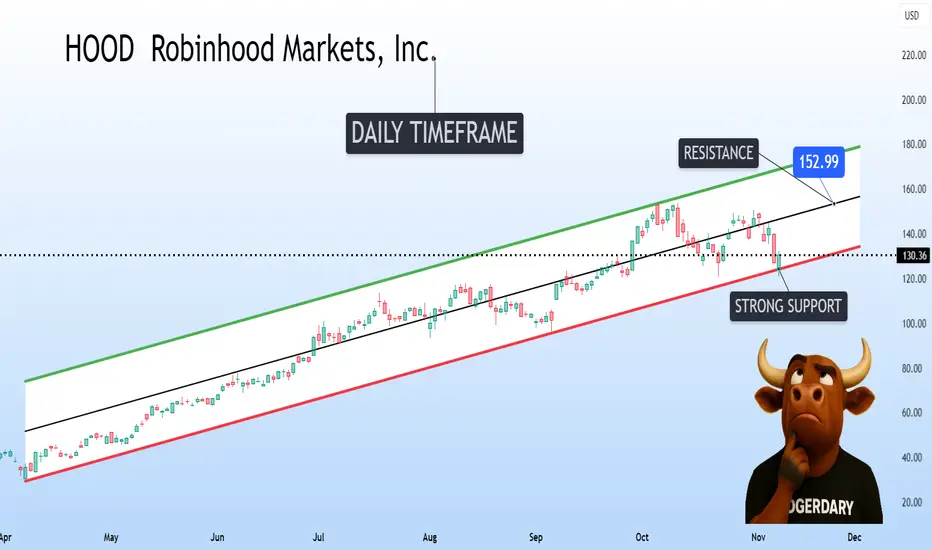
Robinhood is bouncing from the bottom of the channelRobinhood Markets NASDAQ:HOOD is 𝗯𝗼𝘂𝗻𝗰𝗶𝗻𝗴 𝗳𝗿𝗼𝗺 𝘁𝗵𝗲 𝗯𝗼𝘁𝘁𝗼𝗺 𝘀𝘂𝗽𝗽𝗼𝗿𝘁 𝗼𝗳 𝗶𝘁𝘀 𝗮𝘀𝗰𝗲𝗻𝗱𝗶𝗻𝗴 𝗰𝗵𝗮𝗻𝗻𝗲𝗹 on the daily timeframe.
This zone has consistently acted as strong support since April, and bulls are showing signs of defending it once again.
If momentum continues, 𝘁𝗵𝗲 𝗻𝗲𝘅𝘁 𝘁𝗮𝗿𝗴𝗲𝘁 𝗰𝗼𝘂𝗹𝗱 𝗯𝗲 𝘁𝗵𝗲 𝗺𝗶𝗱-𝗿𝗮𝗻𝗴𝗲 𝗻𝗲𝗮𝗿 $𝟭𝟱𝟯.
Hood techincal support I see exhaustion of sales in the stock, possible buying opportunity, as it is in the balance of the structure.

Robinhood (HOOD) | Explosive Q3 & Bullish Setup📊 Fundamental Highlights – Q3 2025
Robinhood NASDAQ:HOOD just posted blowout earnings for Q3:
🔼 Revenue up 100% YoY to $1.27B
💥 EPS up 259% YoY
📈 Total platform assets surged 119% to $333B
💸 Transaction-based revenues +129%, led by crypto, options & equities
💰 Net interest income +66% to $456M
🏦 Cash reserves > $4B
👑 Robinhood Gold users up 77% YoY to 3.9M
They also hinted at adding Bitcoin to the balance sheet, which could fuel major sentiment momentum in the coming quarters.
📐 Technical Setup
HOOD is currently trading above strong support near $113–$118. Price is consolidating in a healthy zone following the earnings spike.
🟢 Trade Idea
Entry Zone: $113–$118 (watch for reaction near support)
Targets (TP): $137 and $153
Stop Loss (SL): $105
Risk-reward is attractive with strong fundamentals and growing institutional interest. If markets hold, this could be a runner.
🔔 Watchlist Material – Stay alert for breakout confirmation or Bitcoin-related news from HOOD in upcoming quarters.

Robinhood Markets Inc. ($HOOD) Slides Despite Strong Q3 EarningsRobinhood Markets Inc. (Nasdaq: NASDAQ:HOOD ) shares declined even after the company delivered a solid earnings beat for Q3 2025, reflecting strong growth in trading and net interest revenues. The stock fell roughly 2.4% in after-hours trading, closing near $132, despite record profitability and user engagement metrics.
The brokerage platform reported earnings per share (EPS) of $0.61, surpassing analyst expectations of $0.51 and significantly higher than the $0.17 reported a year earlier. Quarterly net income soared to $556 million, up from $150 million last year, showcasing a robust rebound in retail trading activity.
Total net revenue for the quarter doubled year-over-year to $1.3 billion, exceeding Wall Street estimates of $1.2 billion. The growth was driven by a 128.8% surge in transaction-based revenue to $730 million, fueled by stronger activity in options, equities, and cryptocurrencies — up 50%, 132%, and 300%, respectively.
Net interest revenue also surged 66.4% to $456 million, supported by higher interest-earning assets and strong securities lending performance. Robinhood’s premium Gold membership base expanded 77% year-over-year to 3.9 million, contributing to a 100% jump in other revenues to $88 million.
However, rising expenses dampened the stock’s momentum. Total operating expenses climbed 31.5% to $639 million, while adjusted operating costs rose 34.8% to $535 million, as the company invested in technology, compliance, and user growth initiatives.
Technically, NASDAQ:HOOD remains above its long-term ascending trendline, with support near $128 and potential resistance at $154. The chart suggests a possible rebound toward previous highs if the stock holds its trendline support.
Overall, Robinhood’s Q3 results reaffirm its strong recovery trajectory, though short-term pressure from higher costs and market volatility has investors cautious.

Momentum QuantSignals AI Screener 2025-11-01Momentum QuantSignals AI Screener 2025-11-01
🎯 UNUSUAL OPTIONS ACTIVITY DETECTED
AI Momentum Scanner Results
🎯 TOP STOCK MOMENTUM OPPORTUNITIES
NASDAQ:PYPL - Score: 72/100
• Setup: Strong order imbalance (+66.7%) and tight spreads indicate institutional accumulation.
• Catalyst: High buying pressure breakout above $70.00 resistance.
• Target: $75.00 within 3 days.
• Options: $70 CALL exp 2025-11-07.
• Risk: Close below $68.50 invalidates setup.
NASDAQ:INTC - Score: 68/100
• Setup: High liquidity with +63.4% buying imbalance signaling momentum shift.
• Catalyst: Breakout above key $40.00 psychological level.
• Target: $42.50 within 4 days.
• Options: $40 CALL exp 2025-11-07.
• Risk: Failure to hold $39.50 support.
NASDAQ:SOFI - Score: 65/100
• Setup: Recent base formation with volume acceleration pattern.
• Catalyst: Break above $8.50 with expanding volume.
• Target: $9.25 within 5 days.
• Options: $8.50 CALL exp 2025-11-14.
• Risk: $8.20 support break.
NASDAQ:ARM - Score: 63/100
• Setup: Consolidation near highs with rising relative strength.
• Catalyst: Momentum continuation above $120.00.
• Target: $128.00 within 3 days.
• Options: $120 CALL exp 2025-11-07.
• Risk: $117.50 failure level.
NASDAQ:MARA - Score: 60/100
• Setup: Crypto-correlated momentum with volume spike.
• Catalyst: Bitcoin momentum breakout above $70,000.
• Target: $25.00 within 2 days.
• Options: $23 CALL exp 2025-11-07.
• Risk: $21.50 support break.
⚠️ Risk Management: Use 2-3% position sizing. Momentum can reverse quickly.
HOOD Bullish Breakout? Flag Continuation Toward 170/185HOOD’s 1D trend remains decisively up after a run from ~$70 to above $155, with price consolidating around $144.80 in what looks like a Bull Flag. The key supply is the recent peak near $155.40, while demand sits at prior resistance-turned-support around $125.75, broadly aligning with the MA60. Volatility has cooled, consistent with a maturing consolidation.
Primary path: look for a break-and-hold through the flag’s upper boundary near $150–$152, then a daily close > $155.50 to confirm continuation. If that triggers, the next objectives are the psychological $170 and a measured move toward $185. For positioning, conservative traders can wait for the close > $155.50; aggressive participants might stalk the $135–$138 pullback zone only with bullish confirmation. For breakout longs, a pragmatic invalidation sits beneath $147; for range-bound longs, below $132.
Alternative path: failure to reclaim $150–$152 and a daily close < $135 would warn the flag is failing, opening a deeper test toward $120. A decisive close below $125.75 would negate the broader bullish setup in the near term and shift bias bearish until reclaimed.
This is a study, not financial advice. Manage risk and invalidations.
