Short - pair trade pre $NVDA earnings In short, the price structure looks ugly for INTC. Top formation with a large gap looming below. Interesting structure for some bearish positions ahead of NVDA earnings. If NVDA falls we will see a ripple effect as the mkt is propped by this name. Circumvent the earnings premium on the NVDA chain with this pair trade. High RR set up , I am personally taking a small deep OTM position.
Not advice, merely technical observation. 🤙
Trade ideas

Intel CEO Takes Charge of AI Division After CTO Joins OpenAiIntel Corporation announced that Chief Executive Officer Lip-Bu Tan will now directly oversee the company’s artificial intelligence operations following the departure of Chief Technology Officer Sachin Katti, who has joined OpenAI. Katti will reportedly lead OpenAI’s compute infrastructure development — a vital role in powering artificial general intelligence (AGI) research and large-scale applications.
The move underscores the fierce competition for top AI talent as chipmakers and AI labs race to develop next-generation computing systems. Intel said in a statement that AI remains a top strategic priority, and the company is doubling down on executing its product roadmap for emerging workloads under Tan’s leadership. However, the transition adds pressure on Intel, which continues to struggle in its foundry business and faces tough competition from Nvidia and AMD in the AI chip segment.
Tan, who became CEO earlier this year, has been reshaping Intel’s leadership structure to accelerate innovation and streamline operations. Analysts view his direct involvement in AI as a signal that Intel aims to close the gap in high-performance computing and reposition itself as a key player in the AI hardware space.
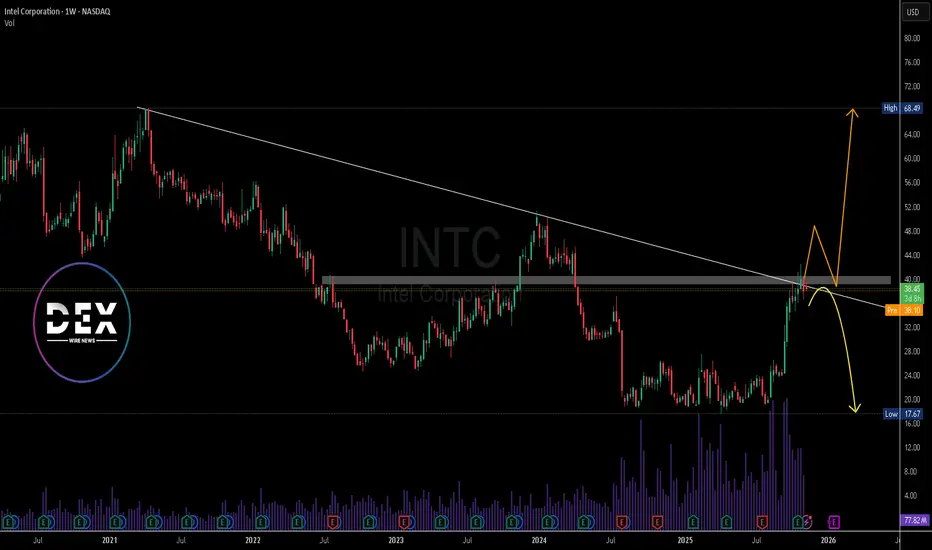
Technical Outlook:
Intel shares are currently trading around $38 after a sharp rally that broke a long-term downtrend line. The chart indicates the stock is now testing major resistance near the $40 level. A breakout and retest above this zone could pave the way for a move toward $68–$70, aligning with the bullish scenario shown. However, if the price fails to hold above the trendline, a correction back toward $28 or even $20 remains possible.
Investors are watching closely as Intel’s leadership changes and AI strategy could determine whether this breakout sustains or fades.
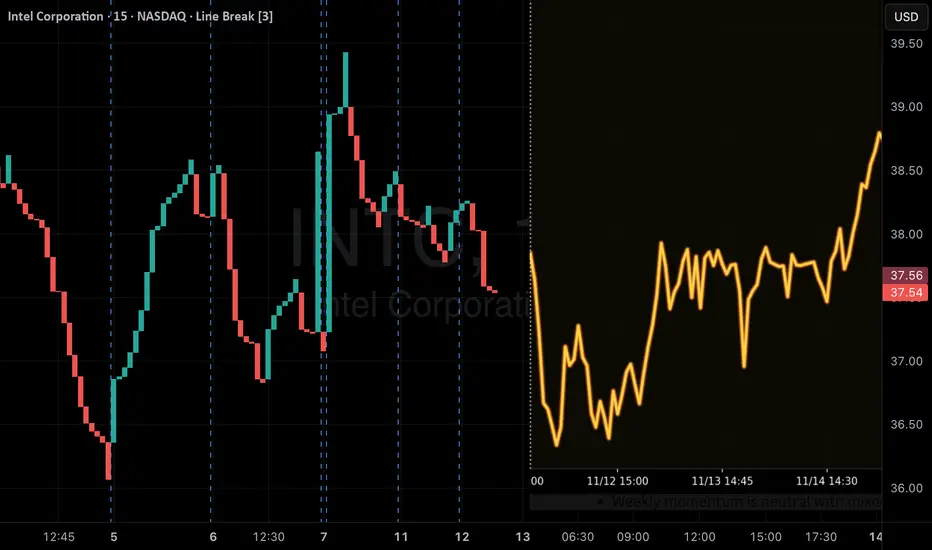
INTC QuantSignals V3 Weekly – Sensitive Opportunities! INTC Weekly PUT Options – 2025-11-12
Current Price: $37.80
Trend: Neutral with slight bearish bias
Weekly Momentum: Neutral (-0.60%)
Confidence: 58% | Conviction: Low
Volatility: Low in weekly signal; 15M series shows downward pressure
Trade Setup:
Direction: Buy Puts (Short)
Strike: $37.00
Entry Range: $1.07–$1.12
Target 1: $1.55 (+52%)
Target 2: $1.85 (+81%)
Stop Loss: $0.75 (-26%)
Expiry: 2025-11-14 (2 days)
Position Size: 2% portfolio (low-conviction trade)
Technical Insight:
Price below VWAP ($37.91) confirms selling pressure
EMA alignment is bearish
Weekly range position at 41.5% indicates room for downside to $36.80
Low volume (0.2x previous week) → may limit move magnitude
Options Flow:
Neutral bias; no unusual activity detected
Low gamma risk environment for weekly options
Risk Notes:
Katy AI summary: NEUTRAL, but 15M series shows consistent downward pressure → conflicting signals
LOW conviction: reduce trade size
Short timeframe → precise exit required by Thursday morning
Tight stop-loss recommended
TradingView-Style Summary Insight:
Bearish short-term momentum with potential downside to $36.80–$37.22
Low conviction → small position only
Watch for volume and timing to capture the potential continuation of the bearish trend.
pull back or just our imagination?INTC is consolidating; currently forming a double bottom on the 21 EMA. INTC must hold 37.13, if that support level fails, we might see 33.72. Stochastic and Stochastic RSI are both oversold and RSI is above 50. Please see chart for key levels. Breakout may determine short term trend condition.

INTC QuantSignals V3 Weekly 2025-11-05INTC QuantSignals V3 Weekly 2025-11-05
INTC Weekly Signal | 2025-11-05
• Direction: BUY CALLS | Confidence: 60%
• Expiry: 2025-11-07 (2 days)
• Strike Focus: $38.50
• Entry Range: $0.70
• Target 1: $1.15
• Stop Loss: $0.40
• Weekly Momentum: NEUTRAL (+0.63% 1W)
• Flow Intel: Neutral
• ⚠️ MODERATE RISK WARNING: Consider reducing position size due to moderate confidence level.
⚖️ Compliance: Educational commentary for QS Premium members only. No financial advice.
🎯 TRADE RECOMMENDATION
Direction: BUY CALLS
Confidence: 60%
Conviction Level: LOW
🧠 ANALYSIS SUMMARY
Katy AI Signal: Neutral (50% confidence) with $38.59 target (+0.8% from current), suggesting mild bullish bias with HOLD recommendation
Technical Analysis: Weekly momentum neutral but multi-week trend bullish (+3.99% over 2 weeks). EMA alignment confirms bullish uptrend. Current price at 49.4% weekly range suggests room for movement in either direction.
News Sentiment: Mixed - AI chip sector faces headwinds from China's foreign chip ban (bearish catalyst), but TSMC's North America expansion could benefit INTC long-term. Overall sector sentiment cautious after $500B AI stock wipeout.
Options Flow: Neutral positioning with no unusual activity detected. Low gamma risk provides cleaner price action. Put/Call ratio unavailable for directional bias confirmation.
Risk Level: HIGH - Low conviction due to Katy's neutral signal, mixed news catalysts, and only 2 days to expiry. Trade primarily based on weekly momentum continuation.
💰 TRADE SETUP
Expiry Date: 2025-11-07 (2 days)
Recommended Strike: $38.50
Entry Price: $0.68 - $0.71
Target 1: $1.15 (70% gain from entry)
Target 2: $1.45 (105% gain from entry)
Stop Loss: $0.40 (40% loss from entry)
Position Size: 2% of portfolio (reduced due to low conviction)
⚡ COMPETITIVE EDGE
Why This Trade: Captures weekly momentum continuation with balanced delta (0.
Image
QS Analyst
APP
— 4:06 PM
468) offering optimal risk/reward for short-duration play
Timing Advantage: Mid-week positioning allows capture of any Thursday/Friday institutional flows before expiry
Risk Mitigation: Tight stop loss protects against rapid time decay, strike selection provides moderate intrinsic value buffer
🚨 IMPORTANT NOTES
Extremely short duration - Only 2 days to expiry creates high time decay risk
Katy AI shows weak signal - Primary engine indicates neutral bias with only 50% confidence
Sector headwinds present - AI chip sector volatility could override technical bullish signals
Target reduced expectations - Conservative profit targets reflect low conviction environment
Exit by Thursday EOD recommended to avoid Friday gamma compression risks
📊 TRADE DETAILS 📊
🎯 Instrument: INTC
🔀 Direction: CALL (LONG)
🎯 Strike: 38.50
💵 Entry Price: 0.70
🎯 Profit Target: 1.15
🛑 Stop Loss: 0.40
📅 Expiry: 2025-11-07
📏 Size: 2.0
📈 Confidence: 60%
⏰ Entry Timing: N/A
🕒 Signal Time: 2025-11-05 19:06:41 EST
⚠️ MODERATE RISK WARNING: Consider reducing position size due to moderate confidence level.

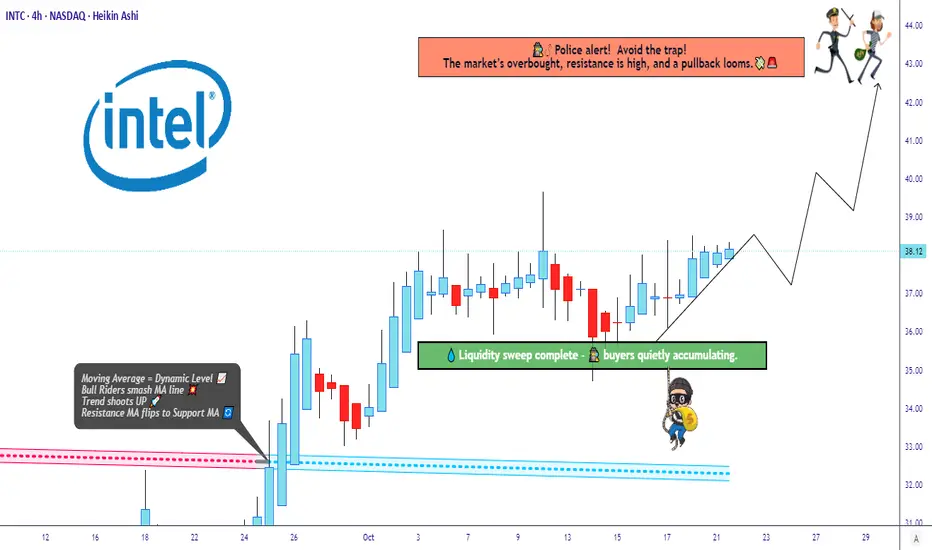
“Intel’s Bullish Structure Building Power for a Breakout Move!”🔥 INTC “Intel Corporation” – The Thief’s Profit Playbook 🕶️💰 (Swing/Day Trade Setup)
⚔️ Plan Overview – Bullish Setup with Thief Precision
The Thief Strategy is in play here — a smart layering entry method designed to steal optimal positions from impatient traders. 🕵️♂️
Our mission: Load, Layer, Loot, and Leave with Profits.
🎯 Entry Plan (Layering Method)
We’re layering multiple buy limits (thief-style) to catch value dips:
Buy Limit Layers: 35.00 💵 → 36.00 💵 → 37.00 💵
(⚙️ You can expand your layers based on your risk tolerance and style — thieves adapt fast.)
💡 Why Layer? Because a pro thief never rushes a vault — we break in step-by-step. This builds position strength while keeping entry efficiency.
🛡️ Stop Loss (Thief’s Escape Hatch)
📉 Stop Loss @34.00
💬 “Dear Ladies & Gentlemen (Thief OG’s) — I’m not recommending you set my SL. You’re the boss of your vault. Manage your own risk, grab the bag, and disappear in profits like a shadow.” 🌑💼
🚀 Target Zone (Profit Extraction Level)
🎯 Main Target: @43.00
📛 Police Barricade @44.00 — strong resistance zone + overbought region + potential bull trap.
🧠 Play it smart — escape clean with gains at 43.00 before the blue lights flash. 🚨
💬 “Dear Ladies & Gentlemen (Thief OG’s) — not recommending you follow my TP blindly. Make your own move, take your profit, and vanish like a ghost.” 👻💸
🧩 Technical Breakdown
Intel (INTC) forming a strong base accumulation near the $35–37 range.
Volume Profile shows liquidity pockets aligning with the layering zones.
RSI hovering mid-levels → room for upside before overbought conditions hit near $43–44.
EMA Confluence: Price reclaiming short-term EMA — early trend reversal signals in motion.
Fundamental Boost: Intel’s AI chip roadmap and cost-optimization headlines add bullish narrative momentum. ⚙️📈
🌍 Related Pairs to Watch (Correlation & Market Sync)
💠 NASDAQ:NVDA – Leader in AI semis; momentum correlation ~0.78 with INTC.
💠 NASDAQ:AMD – Similar sector swing potential; can mirror INTC lag-moves.
💠 NASDAQ:SMH (VanEck Semiconductor ETF) – Sector strength indicator. A breakout above resistance supports INTC’s upside.
💠 NASDAQ:QQQ / NASDAQ:NDX – Tech-heavy indices; bullish bias strengthens chip sector sentiment.
🧭 Correlation Tip: If NVDA or QQQ rallies strongly while INTC consolidates — that’s your thief’s golden signal to layer your entries quietly before the breakout sparks. ⚡
⚙️ Risk Management Wisdom
Never go all-in; layer your risk like a pro.
Keep your SL tight but mind flexible.
Respect zones — police don’t like thieves hanging around too long. 😎
✨ “If you find value in my analysis, a 👍 and 🚀 boost is much appreciated — it helps me share more setups with the community!”
📜 Disclaimer: This is a Thief-Style Trading Strategy shared for educational & fun purposes only. Not financial advice. Trade wisely — stay stealthy. 🕶️
#INTC #Intel #StockMarket #SwingTrade #DayTrading #ThiefStrategy #LayeredEntries #TechnicalAnalysis #NASDAQ #StocksToWatch #AIStocks #TradingViewCommunity #TradingViewEditorsPick #Semiconductors #NVDA #AMD #QQQ #ProfitPlaybook
$INTC - Best in the sector against Trump tariffsIntel is a semiconductor technology giant, renowned for its x86 processors that dominate the CPU segment, top revenue in Q2 2025 came from PC chips (Client Computing Group, ~$7.9B) and server/AI chips (Data Center & AI, ~$3.9B) . Other revenue includes foundry services ($4.4B) and legacy businesses ($1.1B).
But, for the last 4 years the company has experienced one disaster after another:
- Loss of Market Share & Intensified Competition vs AMDs Ryzen and NVIDIA AI GPUs has been major drivers for last 4 years of decline.
- Gross margin dropped to around 38–39% in 2024—a steep fall from pre‑pandemic levels above 60%, while NVIDIA maintained margins above 75%.
- Intel perpetually lagged in transitioning to advanced nodes (7 nm, 5 nm), resulting in costly delays and reduced competitiveness .
- Credit rating downgrade: In August 2025, Fitch downgraded Intel’s credit rating from BBB+ to BBB (negative outlook) due to weak demand and deteriorating profitability . S&P had already downgraded Intel to BB+, and Moody's also cut its rating in 2024 .
Recent events and price action show its time for a buy at these prices.
- Spin-off of Network & Edge (NEX) group: Intel announced the spin-off of its Network and Edge Group (NEX) into an independent entity focused on critical communications and networks, seeking external investors while retaining a major stake .
- Workforce reduction and factory cancellations: Intel confirmed layoffs of ~24,000 employees (~15% of workforce) and cancellation of chip plant projects in Germany and Poland . New CEO Lip-Bu Tan plans to cut the headcount to ~75,000 by year-end 2025 .
- Executive departures and internal reorganization: Three corporate VPs (Kaizad Mistry, Ryan Russell, Gary Patton) announced retirement from manufacturing operations amid deep restructuring . Intel also cut its manufacturing capacity planning and engineering teams as part of an efficiency-driven reorganization .
- Recent key products/services: Intel launched new Xeon 6 CPUs for AI workloads (e.g. Xeon 6776P) and is preparing Panther Lake CPUs (PCs) for 2025 . It also began 18A node production in Arizona and sold part of its Mobileye stake (~$922M) to boost liquidity .
Price/sales: Intel (0.80), AMD (10.3), NVIDIA (29.6), QCOM (3.68)
Wrap-Up
Intel's last four years have been marked by a series of structural, competitive, and strategic challenges—ranging from manufacturing delays to margin erosion and intense pressure from rivals like AMD and NVIDIA. Yet, the tide may be turning. With decisive actions like major cost-cutting initiatives, new AI-focused products, and progress in advanced node production, Intel is signaling a strategic pivot. Trading at a deep discount relative to peers based on the price-to-sales ratio, the stock reflects much of the past negativity. For investors seeking a long-term turnaround play in the semiconductor sector, now could be the moment to re-evaluate Intel’s potential.
Let’s see if this chip giant can turn the corner. Cheers!
Pablin

INTC Target Hit, Now Showing Another Bullish Setup!INTC - CURRENT PRICE : 41.53
My earlier INTC buy call has reached its projected targets. The previous analysis is shared below for reference.
Technical Highlights
1) New 52-week High – Price has broken into a fresh yearly high, confirming strong bullish momentum.
2) Pennant Breakout – The breakout from a bullish pennant pattern suggests continuation of the prior uptrend, with a potential target of $49 based on the pattern projection.
3) Golden Cross Intact – The 50-day EMA remains above the 200-day EMA, maintaining the long-term bullish bias.
4) RSI in Bullish Territory – RSI remains above 70, indicating strong momentum and persistent buying strength.
ENTRY PRICE : 40.00 - 42.00
FIRST TARGET : 45.00
SECOND TARGET : 49.00
SUPPORT : 36.43 (the low of 23 OCTOBER 2025 candle)

Next Volatility Period: Around November 5th
Hello, fellow traders!
Follow us to get the latest updates quickly.
Have a great day!
-------------------------------------
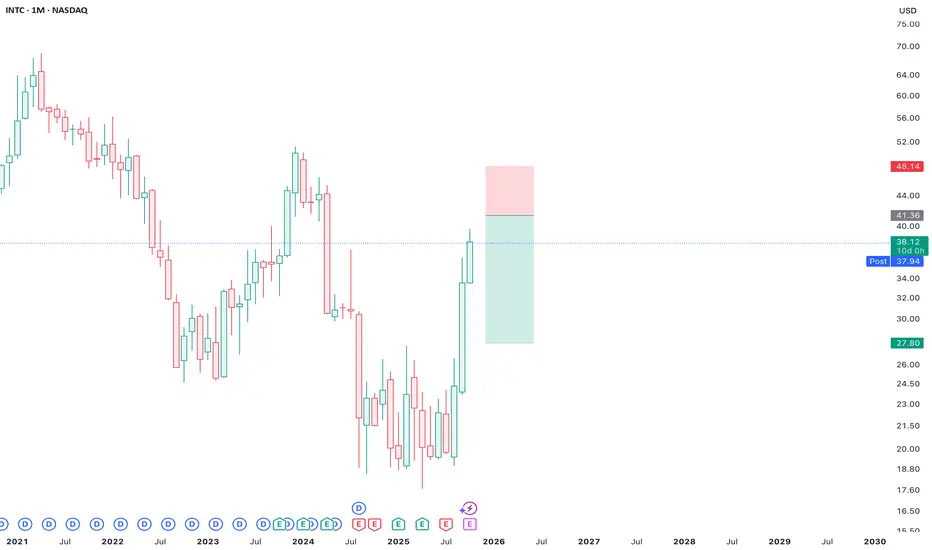
(INTC 1M Chart)
The price has broken above the 28.93 level, indicating a long-term uptrend.
The basic trading strategy is to buy in the DOM(-60) ~ HA-Low range and sell in the HA-High ~ DOM(60) range.
Accordingly, the resistance zones are 47.33-49.82 and 55.20-56.48.
The 47.33-49.82 range corresponds to the HA-High ~ DOM(60) range formed on the 12M chart.
Therefore, we should consider the overall resistance zone to be 47.33-56.48 and develop a response strategy.
-
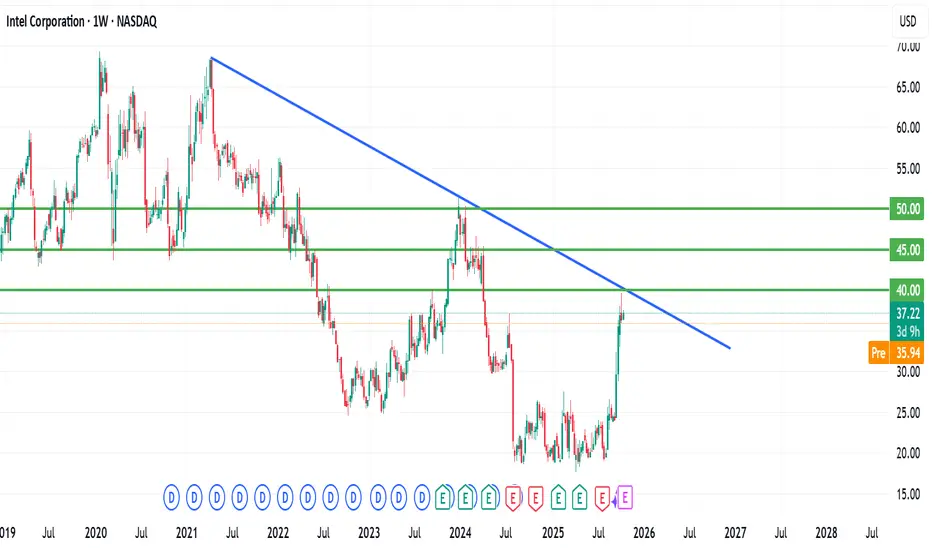
(1W chart)
We should examine whether the price can sustain above the downtrend line (1) and rise along the uptrend line (2).
Since the HA-High indicator on the 1W chart is formed at 45.36, the key question is whether the price can rise above 45.36 and maintain its position.
-
(1D chart)
If the upward trend fails along the uptrend line (2), we should check for support near 36.92.
If not, there's a chance the M-Signal indicator on the 1W chart will touch it.
If the price remains above the HA-High ~ DOM (60) range (35.50-36.92) on the 1D chart, a stepwise uptrend is likely.
However, the price must break above the HA-High ~ DOM (60) range on the 1W and 1M charts.
Therefore, the first hurdle is whether the price can rise above 45.36 and maintain its position.
The next period of volatility will be around November 5th.
After this period of volatility, we need to see if the price stays above the downtrend line (1) and rises along the uptrend line.
-
Thank you for reading.
We wish you successful trading.
--------------------------------------------------

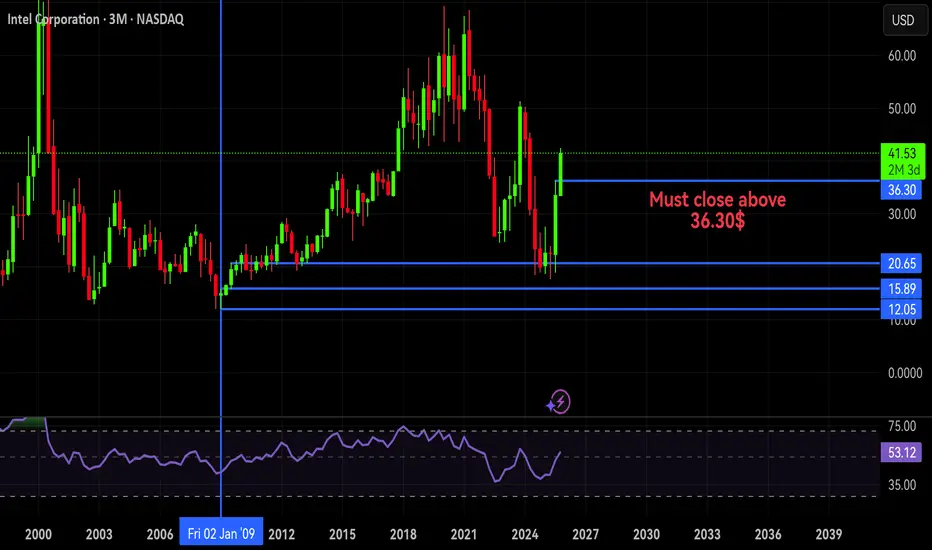
Intc 3 months chartIntel stock (INTC)
If it closes above the $36.30 level by the end of this year,
it will turn bullish 😉😉
Wish you a good catch! 🎣
Ahmad adly🃏
INTC Swing Long Conservative Trend Trade Conservative Trend Trade
+ long impulse
+ expanding T2 level
+ support level
+ unvolumed 2Sp
+ volumed test
+ below first bullish bar closed level entry
Calculated affordable virtual stop loss
1 to 2 R/R take profit
Daily Context
"+ long impulse
+ SOS level
+ support level
+ unvolumed Sp"
Monthly Context
"+ long impulse
+ SOS level
+ support level
+ 1/2 correction"
Give me a way better price at afterhours.
I just need my 2 R and I'm out!

INTC TO 115I could see NASDAQ:INTC getting to 115 in the next 2 years with all the rate cuts coming and AI investments. The U.S. government acquired a 9.9% stake in Intel, investing $8.9 billion in August.

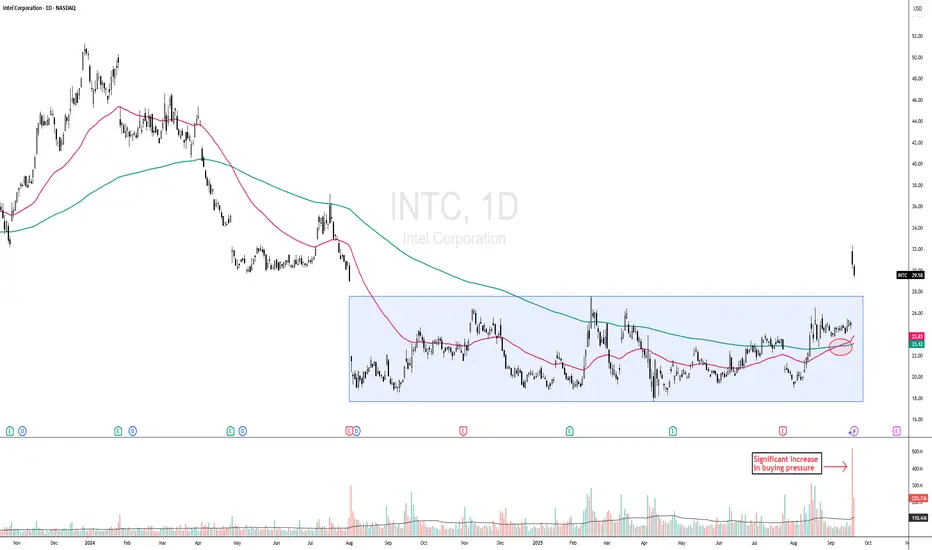
DOW THEORY PLAY - INTC CONFIRMS BREAKOUT FROM ACCUMULATION PHASEINTC - CURRENT PRICE : 29.58
Key Technical Highlights:
1. Breakout from Accumulation Phase with Strong Volume
Intel has successfully broken out of a prolonged sideways accumulation zone. The breakout is accompanied by significantly higher-than-average volume , indicating strong buying interest and institutional participation.
2. New 52-Week High Achieved
Price has breached the previous 52-week high, signaling bullish momentum and the potential start of a new price discovery phase. Historically, such breakouts often attract trend-following traders.
3. Golden Cross Formation (look at the red circle)
A Golden Cross has formed for the first time in a long period, where the 50-day EMA has crossed above the 200-day EMA — a classic long-term bullish confirmation. Notably, the last occurrence of this pattern was in July 2023 , making this the first reappearance in over two years, further reinforcing its significance as a potential turning point in market sentiment.
4. Dow Theory Alignment – Public Participation Phase
According to Dow Theory, this marks the second phase of a major uptrend — the Public Participation Phase — where broader market participants begin to enter following early accumulation by smart money. This phase typically sees strong price advances.
ENTRY PRICE : 28.00 - 30.00
FIRST TARGET : 35.00
SECOND TARGET : 42.00
SUPPORT : 25.00 (CUTLOSS below 25.00 on closing basis)
Note : This is related to point no 1. Markets have a tendency to "fall of their own weight." At bottoms, however, markets require a significant increase in buying pressure, reflected in greater volume, to launch a new bull market. A more technical way of looking at this difference is that a market can fall just from inertia. Lack of demand or buying interest on the part of traders is often enough to push a market lower; but a market does not go up on inertia. Prices only rise when demand exceeds supply and buyers are more aggressive than sellers.
Intel Q3 Results- Intel beats Q3 profit estimates as cost cuts, investments pay off
* Intel's cost-cutting boosts finances amid major investments
* Intel forecasts December-quarter revenue slightly below LSEG estimates
* Intel's stock has risen nearly 90% in 2025, outperforming Nvidia
* Shares surge in after-hours trading
Crucial Intel factors
* Intel was a struggling organization before the government accumulated substantial stakes
* Later, Nvidia had to invest in Intel, a rival company (I don't know if by force or will)
* Overall, Intel revived from "struggling to profit-making", that too beating the expectations in less than a quarter, the quarter (Q3), in which all the investments it got.
* Every time, Intel Stocks Jumped, benefiting the US Govt
Intel's stock surged more than +5% after reporting stronger-than-expected Q3 2025 earnings.
The stock is now trading near $40 per share for the first time since April 2024.
The Trump Administration is up nearly +100% on their Intel purchase since August.

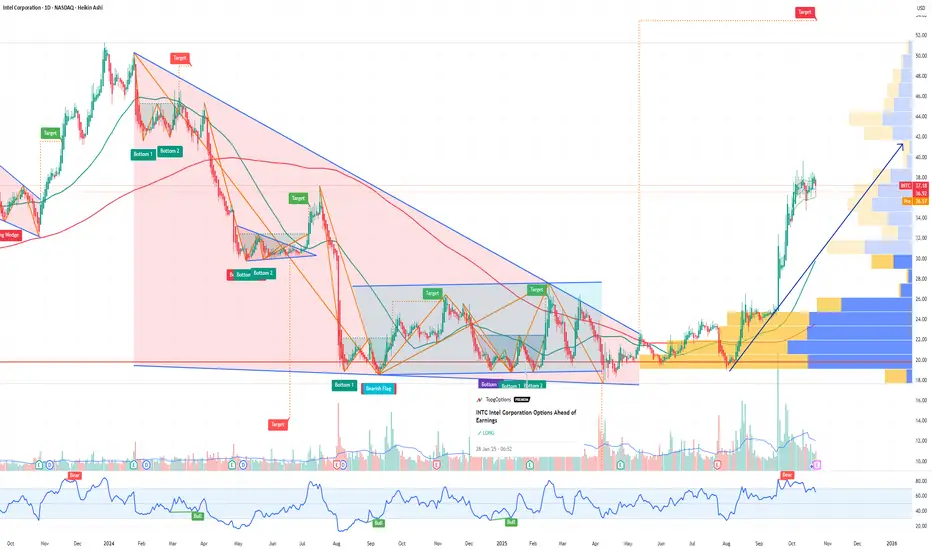
INTC Intel Corporation Options Ahead of EarningsIf you haven`t bought the dip on INTC:
Now analyzing the options chain and the chart patterns of INTC Intel Corporation prior to the earnings report this week,
I would consider purchasing the 48usd strike price Calls with
an expiration date of 2026-3-20,
for a premium of approximately $2.75.
If these options prove to be profitable prior to the earnings release, I would sell at least half of them.
INTCNot financial advice. The essence of investing & trading is the intelligent and patient preying on the greed, fear, impatience, addiction and ignorance of the majority. It's definitionally Darwinian.
What Intel's Chart Tells Us Ahead of This Week's EarningsIntel NASDAQ:INTC will report Q3 earnings this week at a time when the chip designer and aspiring foundry firm's shares have doubled in less than three months. What does INTC's chart and fundamental analysis show?
Let's take a look:
Intel's Fundamental Analysis
Intel plans to release its latest results on Thursday after the bell, but INTC under new CEO Lip-Bu Tan has become as well known for deal-making as it has for anything it does operationally.
The list of deals that INTC struck since just April is long.
First, Intel and Taiwan Semiconductor NYSE:TSM -- INTC's main rival in the silicon-wafer-foundry business -- agreed to form a U.S.-based joint venture to boost Intel's foundry operation. Plans called for TSM to own 20% of that business.
Then in August, the Trump administration converted what had been grant money from the federal government's CHIPS and Science Act and Secure Enclave program into the purchase of Intel equity. That gave the U.S. government a roughly 10% stake in the company that was valued at $8.9 billion at the time.
Shortly thereafter, Softbank OTC:SFTBY bought $2 billion of Intel stock, providing the firm with some much welcome capital.
And lastly, Nvidia NASDAQ:NVDA formed a strategic partnership with INTC in September and made a $5 billion investment in the company.
The idea is for the two potential rivals to collaborate in the co-development of products for data centers and personal computers. Intel will manufacture custom CPUs for Nvidia as part of the deal, as well combining Intel CPUs and Nvidia GPUs for use in artificial-intelligence-capable PCs.
All of those deals have helped push INTC stock up more than 100% in recent months, from an $18.97 intraday low on Aug. 1 to $38.10 as of Monday's close.
As for Intel's upcoming earnings, Wall Street expects the company to report zero adjusted earnings per share on roughly $13.1 billion of revenue.
While that would amount to a 1.3% year-over-year revenue contraction, the adjusted bottom line would compare well to Intel's $0.46 loss per share in Q3 2024.
Still, only two of the 31 sell-side analysts that I can find that cover Intel have revised their earnings estimates higher since the quarter began. By contrast, 25 have revised those numbers lower, while four have left their estimates unchanged.
Intel's Technical Analysis
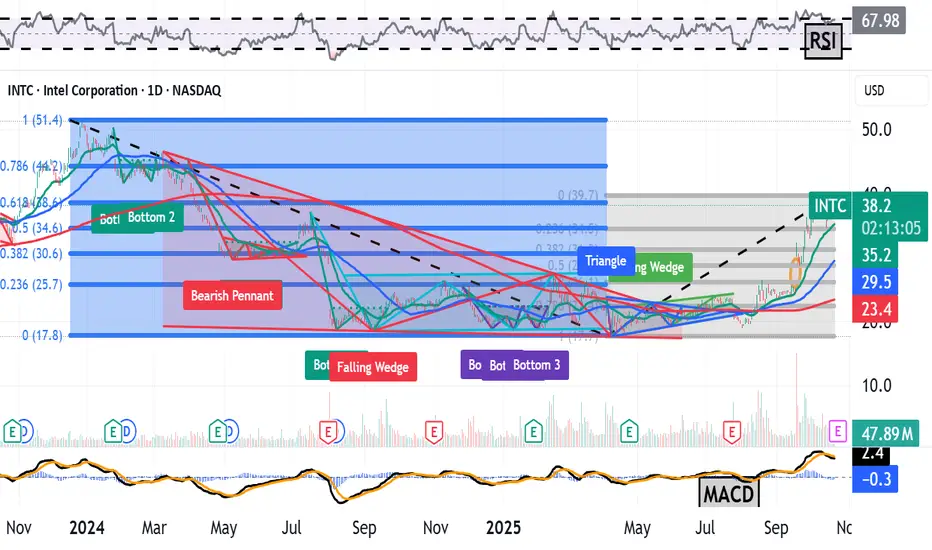
Next, let's look at INTC's two-year chart as of Friday afternoon:
Readers will see that Intel shares appear to be trading these days according to Fibonacci sequence retracement levels (the blue- and gray-shaded fields).
Laid under the shaded field, readers will also see a falling-wedge pattern of bullish reversal, marked with a blue box and jagged blue line.
From a technical perspective, this pattern set up Intel's July-to-September rally.
However, that rally ran out of gas very close to the 61.8% Fibonacci retracement level created by INTC's sell-off between December 2023 and April 2025. Still, the stock found support coming off of its September 2025 top at the 23.6% Fibonacci retracement level (one of the lines in the gray field at the chart's right).
Intel has since started to create a potential base of consolidation (i.e., a trading range) at close to its recent highs. The Fibonacci retracement levels are the pivots in both directions for this stock.
Meanwhile, Intel's secondary technical indicators look mixed.
On one hand, the stock's Relative Strength Index (the gray line at the chart's top) is coming out of a technically overbought condition and remains quite robust.
That said, Intel's daily Moving Average Convergence Divergence indicator (or "MACD," marked with black and gold lines and blue bars at the chart's bottom) is more equivocal.
The histogram of the stock's 9-day Exponential Moving Average (or "EMA," denoted by the blue bars) has moved below the zero-bound, which is usually a short-term bearish signal.
The 12-day-EMA (the black line) has crossed below the 26-day EMA (gold line), which is also normally a bearish sign. But both of those lines are still running above zero, which is bullish.
An Options Option
Add it all up and Intel's chart seems fairly neutral.
Some option traders who are looking to get long the stock but don't want to tie up too much capital might choose to employ a combination of a long call and a short put. Here's an example including option strikes related to pivot points indicated by Fibonacci levels:
-- Long one Oct 24 call with a $40 strike price (Intel's recent high) for about $1.30.
-- Short one Oct 24 put with a $34 strike (the above chart's indicated Fibonacci support level) for roughly $0.90.
Net Debit: $0.40.
Should Intel remain between $34 and $40 through the above options' expiration date, the trader will be out the $0.40 paid.
Alternatively, should the stock trade higher than $40 at expiration, the trader will be long 100 shares at a $40.40 net basis.
And should the shares trade below $34 at expiration, the trader will be long 100 shares at a $34.40 net basis.
(Moomoo Technologies Inc. Markets Commentator Stephen "Sarge" Guilfoyle was long INTC at the time of writing this column.)
This article discusses technical analysis, other approaches, including fundamental analysis, may offer very different views. The examples provided are for illustrative purposes only and are not intended to be reflective of the results you can expect to achieve. Specific security charts used are for illustrative purposes only and are not a recommendation, offer to sell, or a solicitation of an offer to buy any security. Past investment performance does not indicate or guarantee future success. Returns will vary, and all investments carry risks, including loss of principal. This content is also not a research report and is not intended to serve as the basis for any investment decision. The information contained in this article does not purport to be a complete description of the securities, markets, or developments referred to in this material. Moomoo and its affiliates make no representation or warranty as to the article's adequacy, completeness, accuracy or timeliness for any particular purpose of the above content. Furthermore, there is no guarantee that any statements, estimates, price targets, opinions or forecasts provided herein will prove to be correct.
Options trading is risky and not appropriate for everyone. Read the Options Disclosure Document ( j.moomoo.com ) before trading. Options are complex and you may quickly lose the entire investment. Supporting docs for any claims will be furnished upon request.
Options trading subject to eligibility requirements. Strategies available will depend on options level approved.
Maximum potential loss and profit for options are calculated based on the single leg or an entire multi-leg trade remaining intact until expiration with no option contracts being exercised or assigned. These figures do not account for a portion of a multi-leg strategy being changed or removed or the trader assuming a short or long position in the underlying stock at or before expiration. Therefore, it is possible to lose more than the theoretical max loss of a strategy.
Moomoo is a financial information and trading app offered by Moomoo Technologies Inc. In the U.S., investment products and services on Moomoo are offered by Moomoo Financial Inc., Member FINRA/SIPC.
TradingView is an independent third party not affiliated with Moomoo Financial Inc., Moomoo Technologies Inc., or its affiliates. Moomoo Financial Inc. and its affiliates do not endorse, represent or warrant the completeness and accuracy of the data and information available on the TradingView platform and are not responsible for any services provided by the third-party platform.
$INTC - Intel Corp - $32.02 Re-Entry - $44.93 PTNASDAQ:INTC broke out to $38.91 before running into the previous resistance leve and consolidating since. We're watching to see if it holds that mid-level (light blue) support or if it continues back to $32.02 for a Re-Entry & Hold to find support, push through $38.91 finally, to retest the $44.93 Levels again.

Intel - The parabolic bullrun!💸Intel ( NASDAQ:INTC ) rallies significantly:
🔎Analysis summary:
After Intel retested a major support a couple of months ago, we already witnessed an expected rally of about +100%. Considering that the next horizontal resistance is about +25% higher, a bullrun continuation remains totally likely. Intel just perfectly plays out.
📝Levels to watch:
$45
SwingTraderPhil
SwingTrading.Simplified. | Investing.Simplified. | #LONGTERMVISION

Top SidewaysBest EP : Between 35 - 36.65
RR ratio: 1:1.5
Sideways now might be due to QR incoming in 1 week.

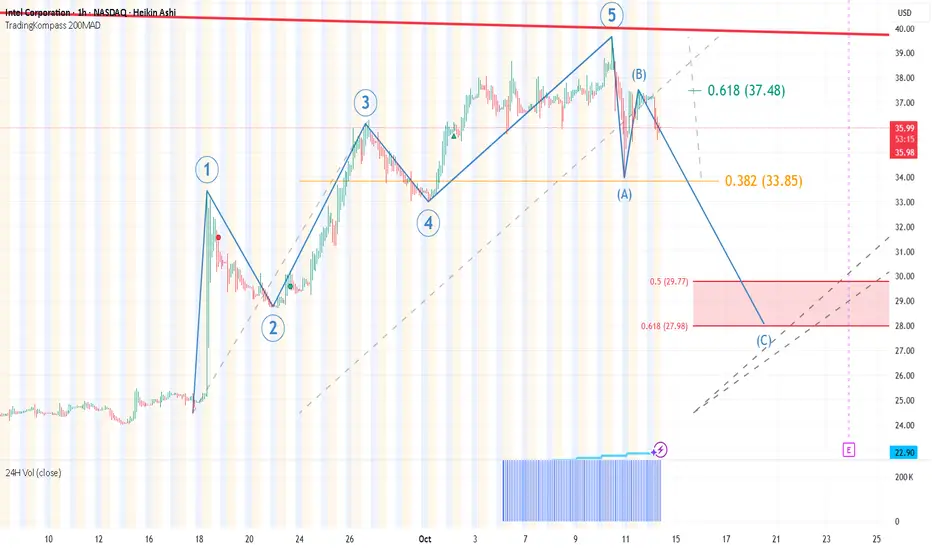
Correction Wave C on the way?Correction Wave C on the way?
Wick in Wave a hit the 0,382 fib lvl (33.85$)
Wave B correction to 0.618 lvl (37.48$)
Wave C might be underway to 27.98$
Intel Corporation (INTC) Technical Analysis: $40 Resistance zoneIntel Corporation (INTC) Technical Analysis: $40 Resistance Level
The $40 price level represents a critical resistance zone for Intel Corporation (INTC) shares, as evidenced by the stock's recent failed attempt to breach this threshold last week.
Despite broader market enthusiasm for AI-driven growth—benefiting many semiconductor peers—INTC has struggled to sustain upward momentum amid ongoing challenges in execution, competition from AMD and NVIDIA, and macroeconomic pressures on legacy chip demand.
Key Technical Observations
Resistance Confirmation: INTC approached $40 last week but encountered selling pressure, indicating strong overhead supply.
Broader Context: While the AI bubble has propelled sector gains, INTC's exposure remains limited due to delays in its foundry ambitions and slower adoption of AI-optimised chips. Recent earnings have highlighted margin compression, contributing to subdued momentum.
Forecast and Scenarios:
Bullish Breakout Potential: A decisive close above $40 on elevated volume, supported by positive catalysts such as strong quarterly guidance, advancements in Intel's 18A process node, or favourable U.S. CHIPS Act developments, could propel the stock toward targets of $45 & $50.
Bearish Risks:
Failure to break $40 may lead to another pullback.
This analysis is for informational purposes and not financial advice. Always conduct your own due diligence and consult a professional advisor. I welcome further discussion on INTC or related strategies.
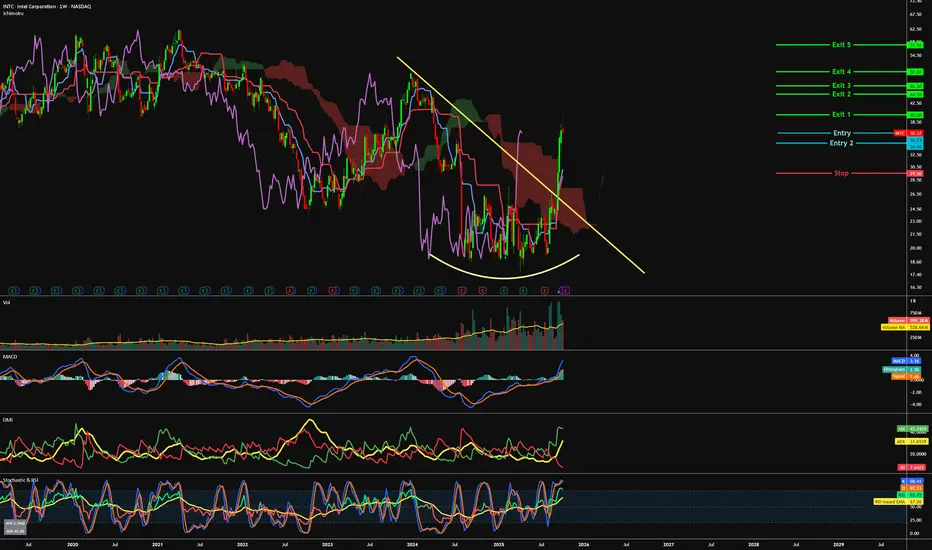
INTC - Returning to previous glory=======
Volume
=======
-Increasing
==========
Price Action
==========
- rounding bottom noticed
- broken downtrend line of 2 years
- Weak selling pressure
=================
Technical Indicators
=================
- Ichimoku
>>> price above cloud
>>> Green kumo budding
>>> Tenken + Chiku - above clouds and moving away
>>> Kijun - Above clouds and moving away
=========
Oscillators
=========
- MACD bullish
- DMI bullish
- StochRSI, bullish
=========
Conclusion
=========
- short to long term breakout swing
- price may reverse at current level, to enter spot or wait for pullback at entry 2.