Trade ideas
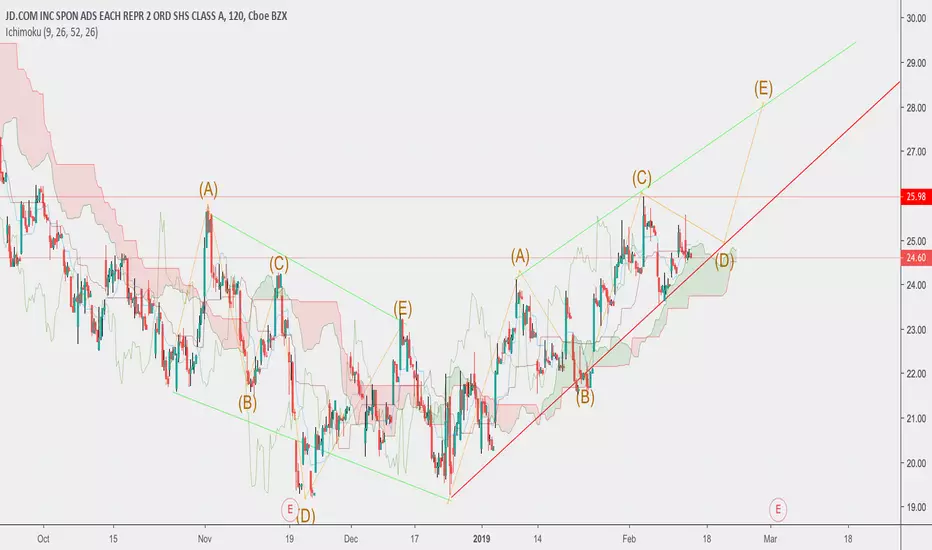
JD: After a long 5 wave down, JD has recovered with a Leading Diagonal which is close to completion. A typical 73.6% retracement should follow

JD.com - completed H&S bottomBeaten down JD.com finally completed its double headed H&S bottom. Proper volume for the shoulder and heads with decisive price action on breakout. Would have liked to see more volume on breakout. Earnings is one major factor that can ruin the trade in one day.

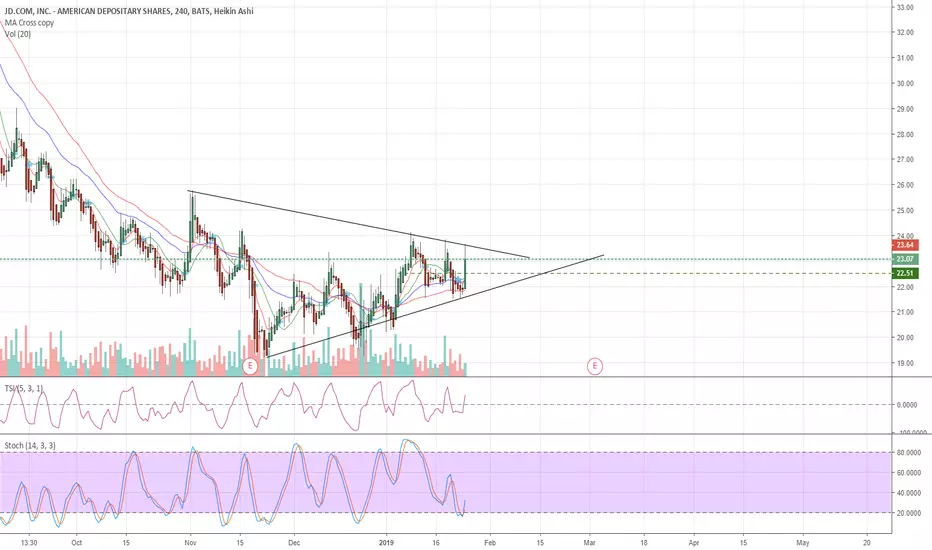
JD getting ready to launchJD looks ready to move higher. Looks ready to break higher to me. Retested and recovered the lower trend line, TSI above zero, Stoch moving out of oversold. 4hr chart shown, but price is above significant MAs.
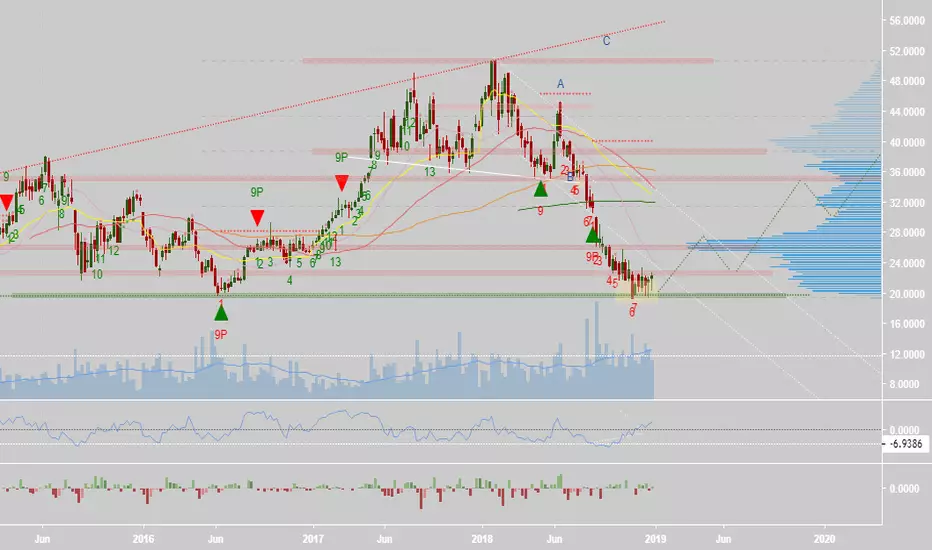
JD getting ready to breakout towards $30?Similar to other Chinese stocks, JD has been beaten down over the last year. However, it appears she wants to push higher out of this downtrend to a potential target of $30 per share, or the 200 day sma. I like $29 per share first since that's 1/3 back on the big weekly sell off.
The weekly chart:
Earnings are on March 3, 2019 according to Trading View so buying might occur leading up into the report.
My plan is to enter $25 March calls for $1.40 stop limit with a stop of $0.40. Risking $200 so 2 contracts. I like where the stop is placed just below all the bullish candles that had similar lows. If JD does break out, I will look to take half off at $29 per share and trail the remaining contract.
Cheers!

JD.com - H&S BottomA double headed H&S bottom formation is almost completed in JD.com after a long decline esp. in chinese stocks. As usual, high volume on the two heads and lower volume on the right shoulder. Just need that decisive upside break on high volume.


Head and shoulder pattern fulfillmentJD has fulfilled its first down side target after breaking down from the big head and shoulder's pattern.
It is likely for it to retrace higher to build energy for the second leg down. After a big topping formation, there is usually two legs to the down side. Now it is time to wait patiently for the corrective structure to form and then trade again on the short side.

Weekly view $JD chart. We bottomed out ? Next week we will get some news from trade deal from Beijing. $JD
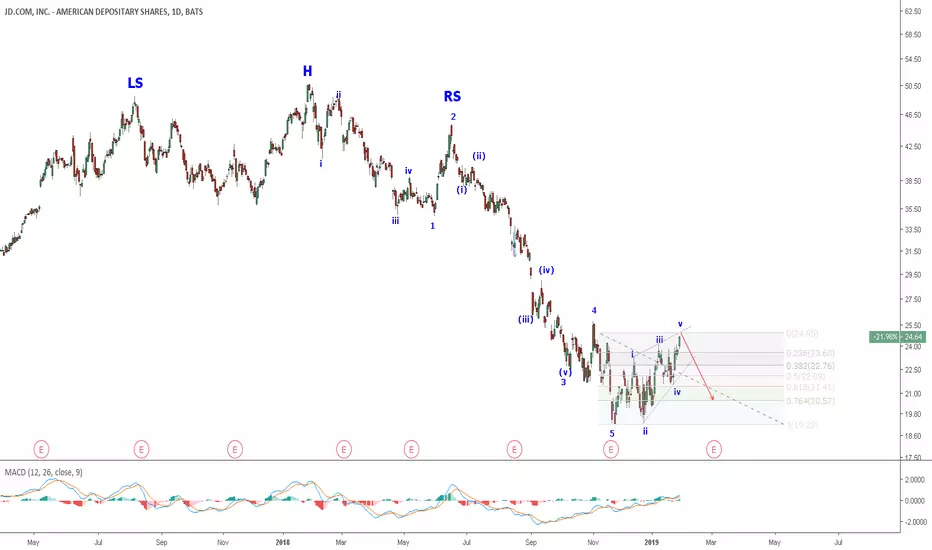
JD: Breached neckline of HnS and went below wave 1, thereby Confirming wave 3 down. Wave 4 cannot encroach into wave 1. Wave 5 is the target of the HnS.


JD conter trend not workingDescribe the trade. What you see? There will be bouce from support and price will advance to the resistance
What have I done well for this trade? there was good determine a smaler trend and according to this targets
What can I take away to help with later trades? I was under ustimate the influence of the longer trend

JD GOING FOR THE COMPLETION OF THIS HARMONIC PATTERN?JD has made an higher low on this last price action. If the price holds this level i'm expecting one more wave up to complete this harmonic pattern. Bullish divergence on 4h chart.

JD Bullish RSI DivergenceNote: This is not an investment advice but my opinion alone. Please feel free to comment.
JD has been picking up steam since it reached its IPO level. As you can see from the RSI that buyers came in even though it was setting a new low which is a bullish signal. It also went above the resistance line and it if can stay above that, I see it getting to the 200 EMA. One way to get there quicker is if the charges against JD CEO gets dropped.
On the reverse side if the stock price drops below the resistance line then we could lower.

JD.com trading at a blatant valuation discountOne of the trends taking place in my portfolio is an increased weighting in China's technology sector.
Amid the trade-driven pessimism over China, clamp down on digital assets and increased control over online content China's economy is trading at a blatant valuation discount to the U.S.
Within the last few months the BAT stocks Baidu BIDU , Alibaba BABA and Tencent TCEHY have been among the biggest losers.
The recent arrest of JD CEO Richard Liu has caused JD stocks to tumble further relative to its e-commerce peers and is now almost 50% off its 52-week high. I view this as a risk-reward profile that is heavily tilted in favor of the bull.
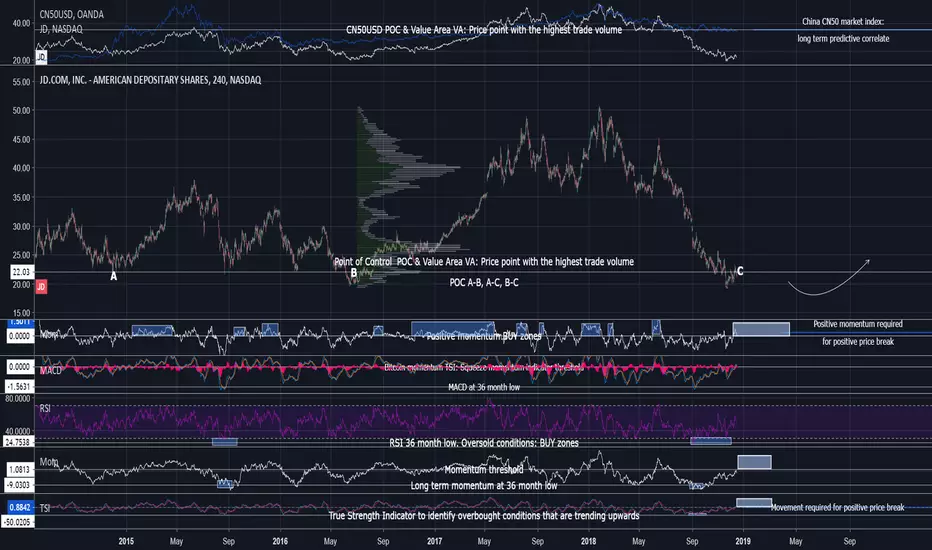
All indicators explained on the graph

#TRADE 2 - jd.com strong long term caseThe chinese market has been hit hard since the trade war began and jd.com has been no exception. The stock is almost at an all-time-low and therefore has a huge rebount potential!
There is a strong RSI bullish divergence and the sellers doesn't have much ammonition left. I predict this stock to be one of the winners of 2019.
Please don't forget to give a like if you appreciate this :)

JD.inc Long IdeaHi guys ! Post my recent idea for a long position at JD.com. Technicaly the Vortex Index tends to crossover because -VI reached high oversold levels and it is a solid signal for a trend swing. Also the bottom bollinger points no further breakout. Also ADX tend to find a direction. From a fundamental scope the recent Trump- Xi "deal" could boost the stock and trading for higher prices . My target is at 36$, whats yours? Hope you find it usefull

Has JD found a bottomOne of the casualties of the US/China trade war has been JD. Long term it has now touched 19-20 for a bottom three times. Will it hold? I think the company has a lot going for it. But investors have been super bearish on Chinese tech these past 6 months or so. I think this will depend more on negotiation and escalation of trade war than technical analysis.
