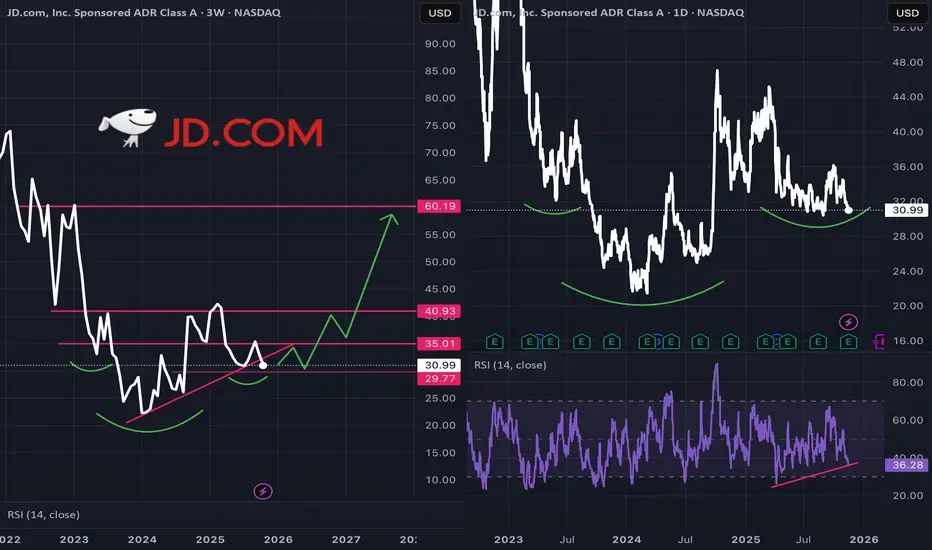
JD.com large cap value worth buying nowJD.com just beat earnings showing an ability to adapt to the current environment in China.
Simultaneously we see calls for Chinese policy makers to continue stimulating the consumer to ward off a very dangerous deflationary death spiral.
I'm reaching a bit here, but it we may be setting up a large
Next report date
—
Report period
—
EPS estimate
—
Revenue estimate
—
1.55 USD
5.77 B USD
161.68 B USD
2.68 B
About JD.com, Inc. Sponsored ADR Class A
Sector
Industry
CEO
Ran Xu
Website
Headquarters
Beijing
Founded
1998
ISIN
ARBCOM4601Y8
JD.com, Inc. is a technology-driven E-commerce company, which engages in the sale of electronics products and general merchandise products, including audio, video products, and books. It operates in the following segments: JD Retail, JD Logistics, and New Businesses. The JD Retail segment offers online retail, online marketplace, and marketing services. The JD Logistics segment includes internal and external logistics businesses. The New Businesses segment is composed of JD Property, Jingxi, overseas businesses and technology initiatives. The company was founded on June 18, 1998, by Qiang Dong Liu and is headquartered in Beijing, China.
Related stocks
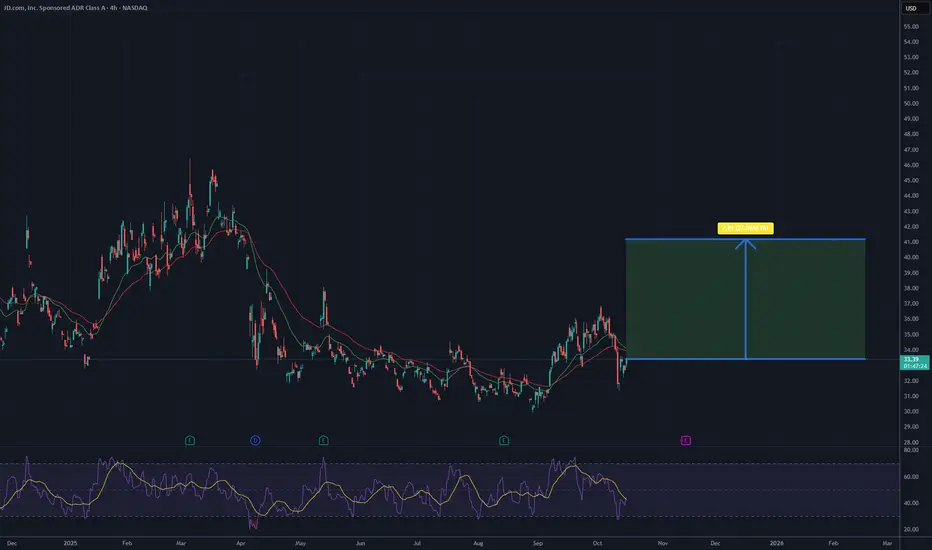
JD - Structure is Shifting! Why and How we breakoutThe algorithms are setting JD up for one of two outcomes — a move toward $45+ or a continuation lower. But based on the current structure, we’re seeing a full tapering cycle playing out, and that’s important.
Here’s the sequence so far:
1. Breakout of the HTF strong selling - Purple
This is al

Jd catalysts are in place for $43 Interestingly enough , the technicals are aligning perfectly for a sharp move in the coming 2-3 weeks for JD. The breakout of a large wedge , retest of the breakout and consolidation near the support are all bullish signs. The 1.618 fib extension for wave 3 takes it to about $43. Low and behold, thi

It's a time for JD - 20 % potential profitAs of October 15, 2025,the price of JD.com shares stands at approximately 33.36 USD, with a slight increase of 4.74% over the last 24 hours, though it has declined by 8.06% in the past week and 17.50% over the year. The chart indicates a downward trend from a peak of 50 USD in March 2025, but the pr
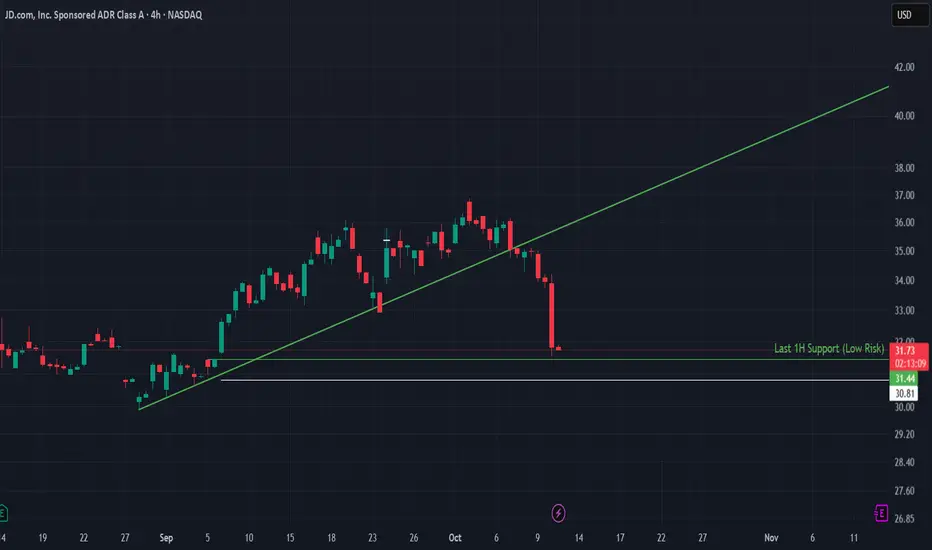
JD.com – Tariff Shock Meets Trendline BreakJD.com fell sharply after Donald Trump’s renewed tariff comments reignited fears of a potential U.S.–China trade war, putting Chinese equities under pressure.
From a technical standpoint, JD has broken below its short-term uptrend, which had been supporting the bullish move since early September. T
$JD Bullish Cypherpotential upside of 40%ish at $44.56/share as the first target if stock price reverses from this bullish cypher pattern.

JD: Looking for an up move/wave.From a technical point of view and based on WTW Concept, JD looks like it will go up after the completion of the needed structure.
We Trade Waves
WTW Team
Disclosure: We are part of Trade Nation's Influencer program and receive a monthly fee for using their TradingView charts in our analysis.
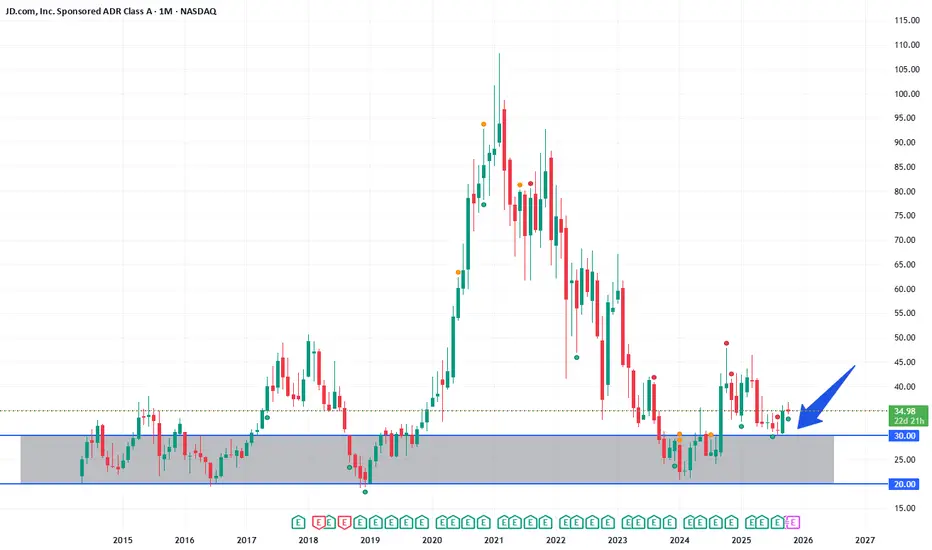
JD at good long term supportwith good financials and AI demand in future I think JD good investment for long term 1-3 years
sitting currently on long term support
Buy Zone between 20-30
I am not financial advisor
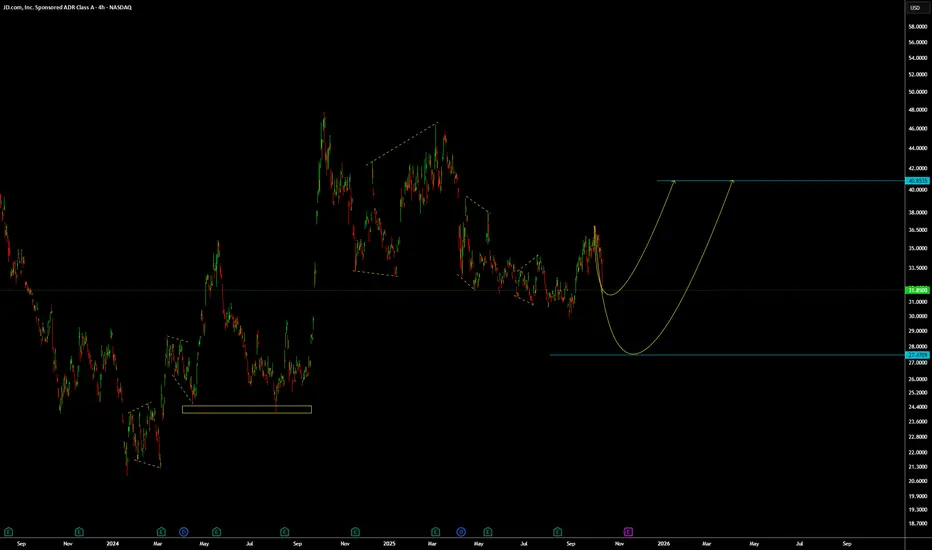
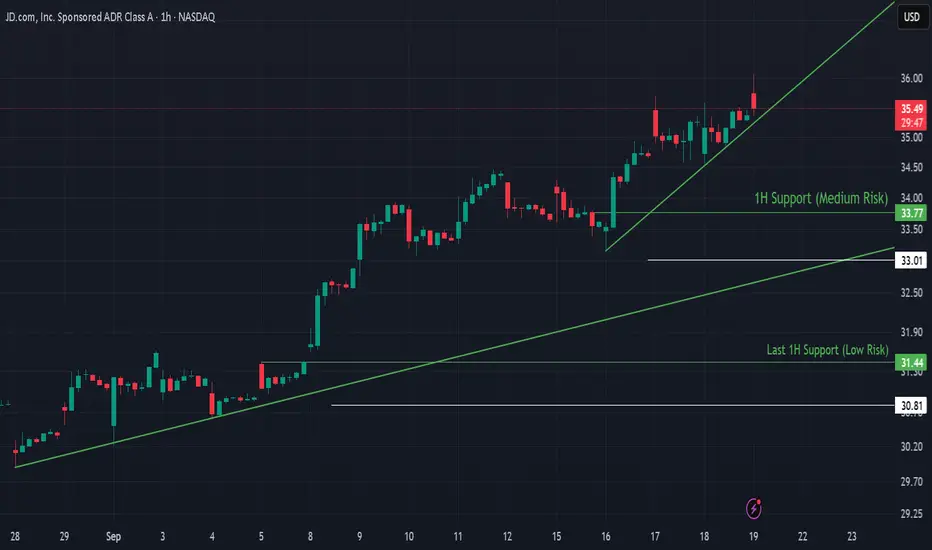
JD.com Building an Uptrend After Tariff-Driven DropJD.com (JD) has been recovering strongly after a sharp decline to $29.90 triggered by tariff war concerns. The stock is now building an uptrend, showing momentum with higher lows and stacked support levels.
🔍 Technical Analysis
Current Price: $35.65
Recent recovery followed a steep sell-off botto
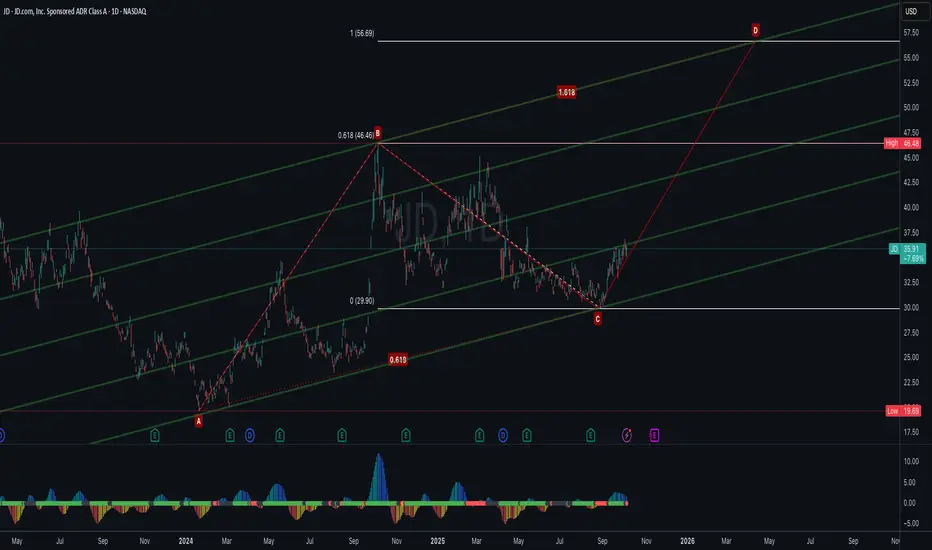
JD.com Bullish ABCD Harmonic Pattern SetupJD.com (JD) is forming a bullish ABCD harmonic pattern, with the current price advancing from point C toward the projected D completion zone. Based on the Fibonacci measurements, the AB=CD projection and 1.618 extension align near $56–57, suggesting a strong potential target area and confluence with
See all ideas
Summarizing what the indicators are suggesting.
Oscillators
Neutral
SellBuy
Strong sellStrong buy
Strong sellSellNeutralBuyStrong buy
Oscillators
Neutral
SellBuy
Strong sellStrong buy
Strong sellSellNeutralBuyStrong buy
Summary
Neutral
SellBuy
Strong sellStrong buy
Strong sellSellNeutralBuyStrong buy
Summary
Neutral
SellBuy
Strong sellStrong buy
Strong sellSellNeutralBuyStrong buy
Summary
Neutral
SellBuy
Strong sellStrong buy
Strong sellSellNeutralBuyStrong buy
Moving Averages
Neutral
SellBuy
Strong sellStrong buy
Strong sellSellNeutralBuyStrong buy
Moving Averages
Neutral
SellBuy
Strong sellStrong buy
Strong sellSellNeutralBuyStrong buy
Displays a symbol's price movements over previous years to identify recurring trends.
Curated watchlists where JDD is featured.
