Bullish on LACThe stock has been down on decreasing vol. The last two days, vol were dry up. It also failed to break down. A good risk: reward:
Stop below 6.37.
First target is 9.10 to fill the gap.
Trade ideas

LAC heads up at $10.84: Golden Genesis fib may give a Dip-to-FibLAC has been flying with the rare-earth sector.
Now approaching a Golden Genesis fib at $10.84
Look for a Dip-to-Fib or Break-n-Retest to engage.

LAC can breach 14$ and potentially doubleLithium Americas Corporation NYSE:LAC is in the news due to recent strategic developments, including government funding commitments that have boosted investor confidence. The technical chart shows a strong bullish pattern with a falling wedge breakout, supported by multiple buy signals and increasing volume—this suggests a powerful reversal from previous downtrends. The stock currently trades around $10, with a clear target near $16, indicating potential upside of more than 50%. Technical indicators such as Fibonacci retracements highlight important resistance levels, with $11.49 being a key intermediate level and the $16 target representing a natural price ceiling based on past highs. This confluence of positive fundamentals and chart structure supports the view that LAC could technically double in value if it sustains momentum above key support zones and capitalizes on ongoing project progress and catalytic news flows.

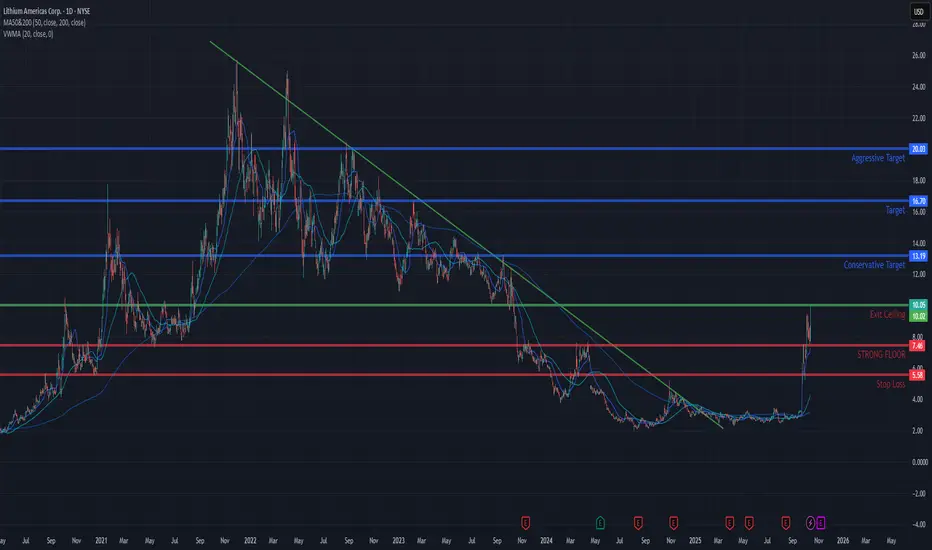
horizontal lines on LACLithium is important.
US wants to be american owned and built, so why wouldnt the US government back and support LAC?
With lithium becoming more and more important for batteries, not just for EV's, but for backup sources for DATACENTERS. this ticker popped as of recent convictions US will support rare earth minerals.
Goal is to pick up and load up shares in and around this zone along the strong floor.
The ceiling will need to confirm green a few candles before it can pop to one of the targets.
I do have a stop loss location, but i do not expect us to hit it.
this feels to me like an asymmetrical play
ONE FOR THE FUTURE (BUY TARGET AT 48.2)One for the future, buy and hold for targets at 48.2+/-
Price has completed one 13-year cycle and the first half of the next cycle will see a gradual bull trend completing the 7-year cycle.
Trade safe, goodluck

LAC🔍 Technical Analysis Overview
Ticker Unknown (Based on TradingView chart)
Current Price: ~$6.33
Chart Type: Long-term (Weekly candles)
📊 Key Technical Levels
✅ Support Zones
Major Support Zone: $4.27 – $5.20
This area has historically acted as a strong demand zone. Price has recently rebounded from this level, indicating strong buyer interest.
Trendline Support: A long-term ascending trendline (black) shows consistent higher lows, suggesting a long-term bullish structure still holds.
❌ Resistance Zones
First Resistance / Mid-Term Target: $11.22 – $12.72
Marked in red, this is a historical supply zone where price has reversed multiple times. It’s a major obstacle to break for further upside.
Long-Term Target / Major Resistance: $25.90 – $26.00
This is the long-term projected target based on historical highs and is the peak of the last major bull run. Achieving this level would represent significant upside potential (~+310%).
📈 Projected Price Path (Blue Zigzag Line)
The projected path suggests a bullish wave pattern, with potential pullbacks and consolidations along the way. The projection assumes:
Breakout above current consolidation zone ($6.33)
Gradual progression with healthy corrections
Retest of the $11–12.72 zone before major continuation
Final target: $25–26 over the long term (2–3 years)
🧠 Market Psychology & Volume Observation
Past high volatility (sharp rise and fall in 2021–2022) indicates speculative behavior or news-driven movement.
Recent low volatility and accumulation range suggest institutional interest or bottoming process.
🔁 Conclusion & Strategy
Short-Term View: Bullish bias above $6.00, targeting $8–9 as initial resistance before major zone at $11.22–$12.72.
Mid-Term View: Watch for price action near $12 zone; a break with volume confirms further upside.
Long-Term View: If structure holds and macro or fundamentals support it, potential exists for a long-term rally toward $25–26.
⚠️ Risk Management
Invalidation Level: Break below $4.27 may indicate bearish continuation.
Always use stop-loss and proper risk-to-reward ratios when trading or investing.

Watching $LAC Breakout: Gov’t Support Could Fuel Run HigherI’m bullish on $LAC. I've successfully traded this during the time of EV Hype and with some recent news development, this can get some tractions again. Here’s why I think this setup has teeth:
🔍 News Trigger
The U.S. government is negotiating an equity stake in Lithium Americas while it restructures a $2.3B DOE loan for Thacker Pass. NYSE:LAC ripped nearly +99% after hours on the announcement. This news ties directly into the Trump administration’s push to boost U.S. manufacturing by ramping investment from both domestic and international firms.
🏭 Bigger Picture: Manufacturing Push
Washington wants to anchor more of the EV supply chain inside U.S. borders. Lithium is critical, and Thacker Pass is one of the largest untapped reserves in North America.
The push isn’t without bumps: earlier this month, Hyundai and LG Energy’s EV battery plant in Georgia was hit with an immigration raid, forcing a construction halt and delaying its opening by months.
That context shows why Thacker Pass and U.S. lithium supply are so important — less reliance on foreign production, more control over supply chain timing.
📈 Why This Matters for NYSE:LAC
Government equity stake = financial backing + political weight. Reduces project risk, improves financing terms, and signals strong federal support.
Demand for lithium is set to rise with EV and storage adoption. With U.S. manufacturing policy pivoting harder to “homegrown supply,” NYSE:LAC stands to be a front-runner.
If execution holds, this could be a re-rating moment for the stock.
🛠 Trade Setup
Watch for NYSE:LAC to hold above breakout zones (around recent highs). Confirmation there is my entry cue.
Stop just under key support where buyers previously defended.
Upside targets: 30–50% higher if momentum continues and resistance clears.
⚠️ Risks
News is hot; if government terms sour or fall through, stock can retrace fast.
Permitting and cost overruns at Thacker Pass remain risks.
Lithium prices are cyclical — a sharp downturn could pressure margins.
✅ The TL;DR
U.S. government backing, Trump’s manufacturing agenda, and supply chain urgency all line up in NYSE:LAC ’s favor. This is a high-beta, high-risk play — but the narrative and chart are turning bullish.
Once again, always manage your risk.
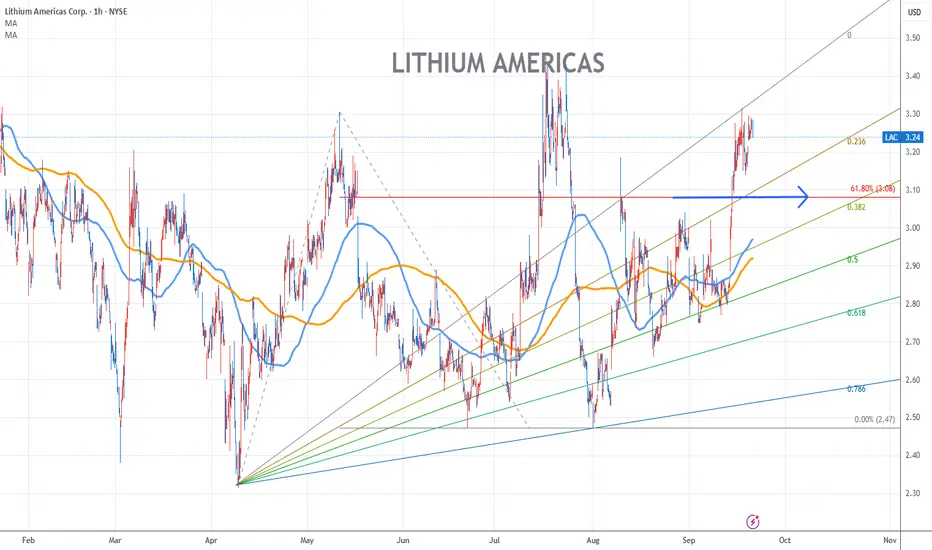
Lithium Americas Chart Fibonacci Analysis 092025Trading Idea
1) Find a FIBO slingshot
2) Check FIBO 61.80% level
3) Entry Point > 3.1/61.80%
Chart time frame:B
A) 15 min(1W-3M)
B) 1 hr(3M-6M)
C) 4 hr(6M-1year)
D) 1 day(1-3years)
Stock progress:A
A) Keep rising over 61.80% resistance
B) 61.80% resistance
C) 61.80% support
D) Hit the bottom
E) Hit the top
Stocks rise as they rise from support and fall from resistance. Our goal is to find a low support point and enter. It can be referred to as buying at the pullback point. The pullback point can be found with a Fibonacci extension of 61.80%. This is a step to find an entry-level position. 1) Find a triangle (Fibonacci Speed Fan Line) that connects the high (resistance) and low (support) points of the stock in progress, where it is continuously expressed as a Slingshot, 2) and create a Fibonacci extension level for the first rising wave from the start point of the slingshot pattern.
When the current price goes over the 61.80% level, that can be a good entry point, especially if the SMA 100 and 200 curves are gathered together at 61.80%, it is a very good entry point.
As a great help, TradingView provides these Fibonacci speed fan lines and extension levels with ease. So if you use the Fibonacci fan line, the extension level, and the SMA 100/200 curve well, you can find an entry point for the stock market. At least you have to enter at this low point to avoid trading failure, and if you are skilled at entering this low point, with the fibonacci6180 technique, your reading skill of to chart will be greatly improved.
If you want to do day trading, please set the time frame to 5 minutes or 15 minutes, and you will see many of the low points of rising stocks.
If you prefer long-term range trading, you can set the time frame to 1 hr or 1 day
Falling Wedge Breakout on Lithium Americas Corp. (LAC)LAC has just broken out of a falling wedge pattern, signaling a potential bullish continuation. The stock successfully crossed above the descending resistance line (red), supported by a rising trendline (green), which strengthens the bullish outlook.
Entry Point:
✅ Breakout confirmation above $2.90 area, where price closed above the wedge.
Profit Targets:
First Target: $3.31 (~13% from breakout)
Second Target: $3.60 (~12% further upside after $3.31)
Stop Loss:
Below $2.75, under the recent higher low and wedge support.
The breakout setup combined with strong upward momentum suggests a potential move into the $3.30–$3.60 resistance zone in the coming sessions.
Not financial advice. No responsibility for any actions taken.

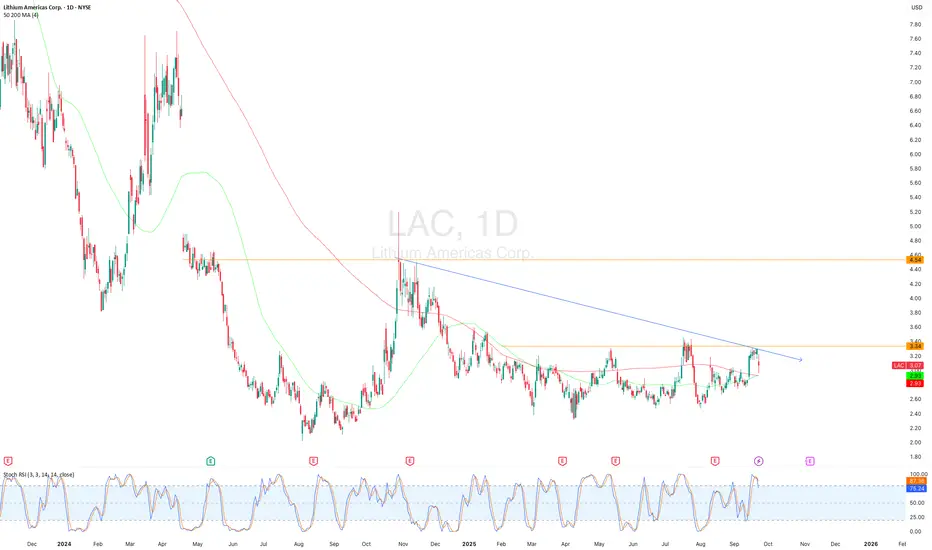
The trend line suggests that an upward move is likely soonIt looks like taking some profits around the 0.786 level (around 3.3) and 0.618 (around 4.18) could be a good move. As for the stop-loss, the previous low near 2.34 makes sense, which is about a 10% downside.
The trend line connecting the lows has been in place since way back in 2012, forming a long-standing channel — and if that holds, this area could be a really attractive entry point.
On top of that, the RSI has been showing a "Positive Divergence" pattern since December 2024, which adds even more weight to the bullish outlook.

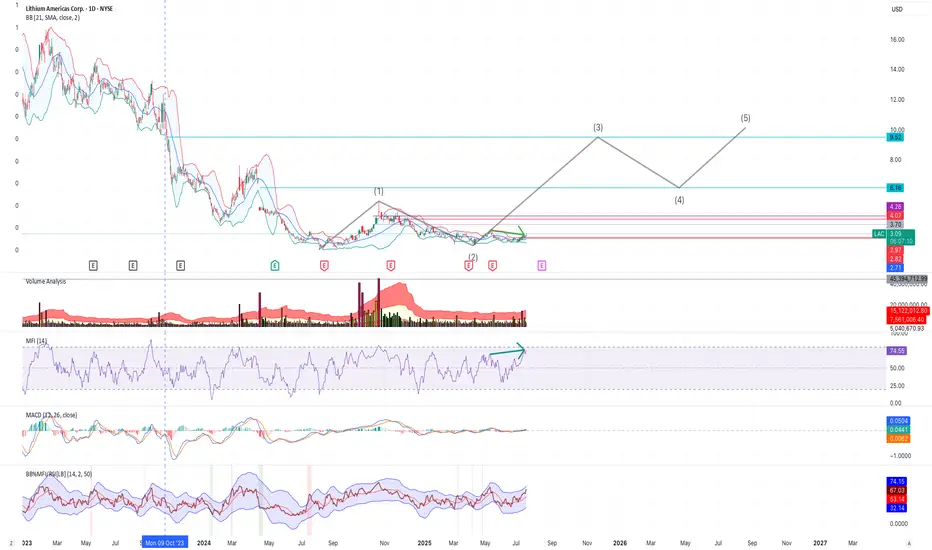
$LAC up from here: support, elliot wave, price actionI believe LAC may have begun its 3rd elliot wave, with a bottom at $2.33. There also appears to be nice recent strong base support around $2.80. In addition, there appears to be a deviation between price and money flow, as shown with the green arrows - with a potential correction available to push price beyond $3.30 very soon.
I have entered and will watch its daily action and volume with an upside expectation limit around $9-10, then a 4th wave down, etc. Of course, I am not a financial advisor and I have been wrong before and will be wrong again. I trade within this reality and control my risk.
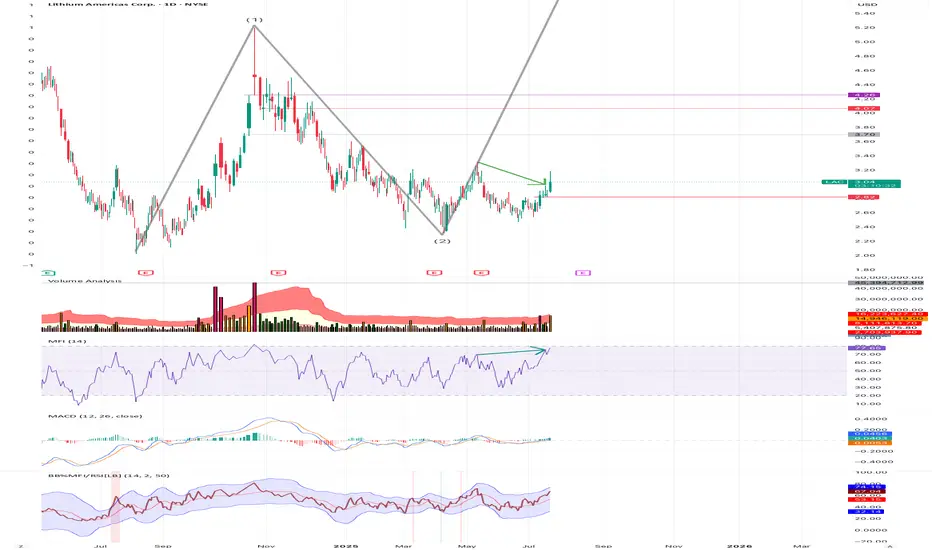
The 3rd Nevada Lithium Elliot WaveI believe LAC may have begun its 3rd elliot wave, with a bottom at $2.33. There also appears to be nice recent strong base support around $2.80. In addition, there appears to be a deviation between price and money flow, as shown with the green arrows - with a potential correction available to push price beyond $3.30 very soon.
I have entered and will watch its daily action and volume with an upside expectation limit around $9-10, then a 4th wave down, etc. Of course, I am not a financial advisor and I have been wrong before and will be wrong again. I trade within this reality and control my risk.
LAC (Lithium Americas Corp) – Bottom Reversal with Higher Low FoThe LAC stock chart suggests a confirmed bottom structure, supported by a clear higher low pattern—a strong technical signal that downward momentum has likely ended and a trend reversal may be underway.
After an extended downtrend, the price has formed a rounded bottom with two notable troughs, indicating accumulation and base building. The most recent low is higher than the previous one, marking a bullish higher low, which strengthens the case for a trend reversal.
Key Technical Signals:
Confirmed bottom: Rounded bottom pattern over the past several months.
Higher low: Recent price action has respected prior support and pushed higher, a bullish sign of strength.
Breakout zone: Price is currently challenging resistance in the ~$2.80–$3.00 range. A sustained move above this area would confirm bullish breakout momentum.
Upside targets:
First target: ~$4.49 (prior support turned resistance)
Second target: ~$5.19 (key historical resistance zone)
Trade Setup:
Entry: Current breakout attempt (~$2.85)
Stop-loss: Below recent higher low (~$2.43)
Risk-reward ratio: Favorable, targeting ~60–80% potential upside with limited downside risk.
Summary:
LAC is showing signs of a long-term trend reversal, with a confirmed bottom and bullish higher low. If momentum continues, a breakout rally toward previous resistance levels is likely. Traders may consider this a medium-term opportunity, with a solid technical foundation and clear upside targets.

Lithium Americas Corp. (LAC) - LongLong entry at 2,52 USD with a stop loss 1,98 USD.
Profit taking: 4,14 USD, 6,71 USD and 10,55 USD.

$LAC about to break out?I've been watching NYSE:LAC for a LONG time. I've traded this one in the past.
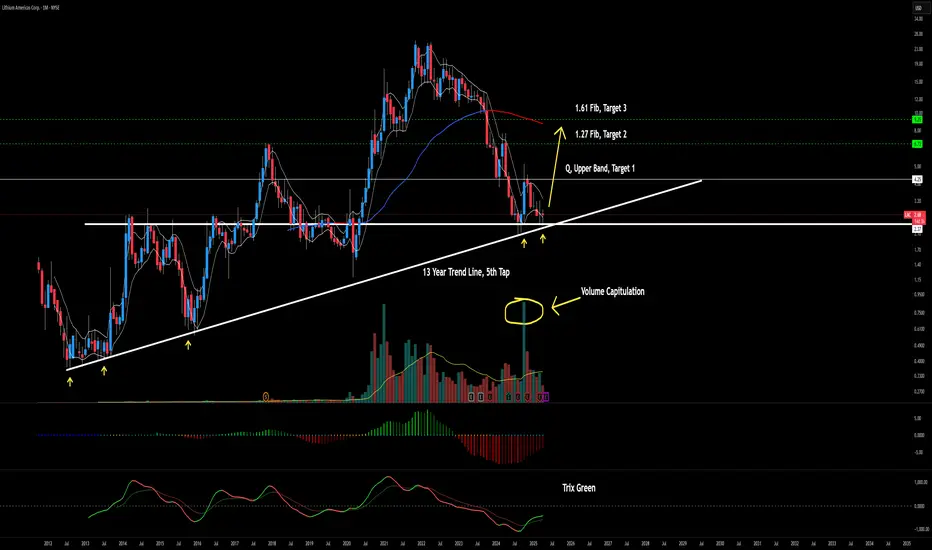
We fell all the way back to a major support zone from all time highs, and we also landed right on the long 13 year trend line for a 5th test.
Now, I typically dont take trades off trends that have been tested 4 times or more. But, in this case, our monthly trix is green, after hitting that trend and major support, and we also have volume capitulation showing up on the monthly chart, as well as the quarterly. (Not shown.)
As far as pattern, our initial break out move was a nice engulfing candle, and we did in face break the upper monthly band, the white moving averages that follow the tops and bottoms of the candles.
What you look for from here is a pull back to the opposite side of the bands, aka, the lower monthly band for a "first touch," this is where you enter, and is where I bought at $2.79.
First target is the upper quarterly band at $4.25. From there, you have the 1.27 Fib at $6.75, and the 1.61 at $9.25
I will likely exit 75% of my position at $6.25.
I feel like this one is worth watching. I will be really surprised to see this one fail from here.
Stay tuned.
BUY LACThis is a stock with big potential for value. A target of the all time high can net us 700% return. Manage Your risk and good luck

$spy $lac What if this is H&S BottomWhat if this is a H&S bottom in Lithium? Significant upside if so.


$LAC yieahhhyieahhhh
looking nice risk reward here.
A lot of confluences on the high volume area around $10.
Going to stop buying starbucks outside to move it instead to this bad boy.
Yieaahhh

LAC possible sequence ending? turnaround soon? Target 40+ usd?Following LAC for quiet a few years now; following its 3 count overall moves carefully, and waiting for a pullback. The Multi-year trend moving in a so called ABC structures, likely still forming an overall huge diagonal. It was roundabout at the 0.236 fib retracement for a possible wave 4, when fundamentals has been changed for LAC, primarly the company split and ongoing legal actions which made me wait for further draps, although a 0.236 retracement would have been acceptable.
Now, for the white scenario, it is possible we are ending the wave 4 pullback also as a big abc. Being an overall diagonal forming, for a wave 4 the 0.618 is also common, being said, it has almost reached it perfectly, so the risk-reward ratio is getting great for the very long term, to finish off wave 5 also as an abc to the upside, target would be primarly 40-55 usd, in a more bullish interpretation ~69 USD, LIKELY would take also several year (definetely not a few). Keep in mind with our current knowledge, the new mine's production likely ramping up in '26-'27.
fib support down at ~2.43, where the second small fib box upper support ~2.34 is an acceptable one IF there is no sustained, comfortable price actio break below.
For a bit more "bearish" scenario, we already finished of an "A" wave (orange route), either as a smaller diagonal, or I could make a case for a WXY as well, does not really matter. We are working now on orange circle B, which should be also an abc structure, in which we finished, or near to finish the (A) wave, and a correction should be imminent with a minimal upside target of 6.27 currently, but be aware it is a moving target, as price action evolves we might need to adjus that red resistance box. Standard support box is added for the orange route as well 0.9 usd being the last reliable support for a later evolving C wave.
On the 1h, 4h RSI and MACD has already built a nice divergence, on the daily it has started to built, early signs are there but not fully present. Weekly is coming up, towards ground levels. So far all the meaningful MA'S on the daily (9/21/50/52/180/200) was rejecting price action previously, currently trying to break above and close above the 9day SMA.
We do have a small head and shoulders pattern as well with a downtarget of ~2.29 which not neccessarly needs to be reached. This is the multi-year big picture, from this point forward switching from a weekly timeframe, to lower ones.

LAC & GM Team Up for Thacker Pass! Here I have NYSE:LAC on the Daily Chart!
NYSE:GM plans to contribute $625 Million and seeks to claim 38% of the Joint Venture!
This remarkable announcement this week seen the Price of NYSE:LAC hit 4-Month Highs after Breaking Above the Falling Resistance that was keeping it down.
The rally seems to be tamed by the Resistance Level and Low that was created in February but is now testing the Break of Falling Resistance for potential Support to keep pushing Price Higher!
If Price can Push through this area, we could see Price make a move for the Gap @ ( 4.9 - 6.37 ) then find Strong Resistane @ ( 6.83 - 7.65 )
Indicators:
- Price will need to test the 200 EMA in $4 range
- RSI is Above 50 (Bullish)
- Strong Bullish Volume with Breaking Candle suggests Valid Break
- BBTrend Printing Green Bars

LAC bull run happening This is a bullish pattern i see coming in many timeframes.
LAC is a lithium mining stock, located in Nevada and Oregon. GM NYSE:GM has already invested on October 16th 2024. Lac may be GM’s supplier for lithium. Please share thoughts.

LAC - Lithium is close for a reversalLithium Americas is a pure-play lithium producer. The firm owns one resource, Thacker Pass, that is located in northwest Nevada. Thacker Pass recently began construction and is expected to begin production in the mid- to late 2020s. Thacker Pass is one of the largest known lithium resources in the world. The project would be the first clay-based asset to enter production, and we estimate it will be in bottom half of the global cost curve. Management plans to develop Thacker Pass into a fully integrated lithium production site, with downstream refining capabilities on site, and will sell into the lithium chemical market.
Lithium has experienced a prolonged downphase, but a potential reversal is anticipated soon. This stock is viewed as a mid- to long-term hold.
Key Technical Levels:
Breakout Zone: $2.9 - 3.0
Action: If the stock breaks above this range with strong volume, it might signal a continuation of the upward trend.
Resistance Points:
$3.80
$4.50
$5.70
$6.50
$7.60
Surpassing these levels could signal a positive trend. Consider taking profits at these stages to realize gains.
Trading Strategy:
Take Profit (TP): Target 5.0 or at 10.80 to capitalize on the anticipated price gap closure.
Stop Loss (SL): Set at under $2.50 to mitigate potential losses.
Chart Analysis:
Please refer to the attached chart for detailed analysis of price trends and movements.
Trading Advisory:
Exercise caution and consider market conditions and your own risk tolerance when trading. It's advisable to conduct comprehensive research or consult with a financial advisor before engaging in trading activities.
Disclaimer: This content is for informational purposes only and should not be considered financial advice.
