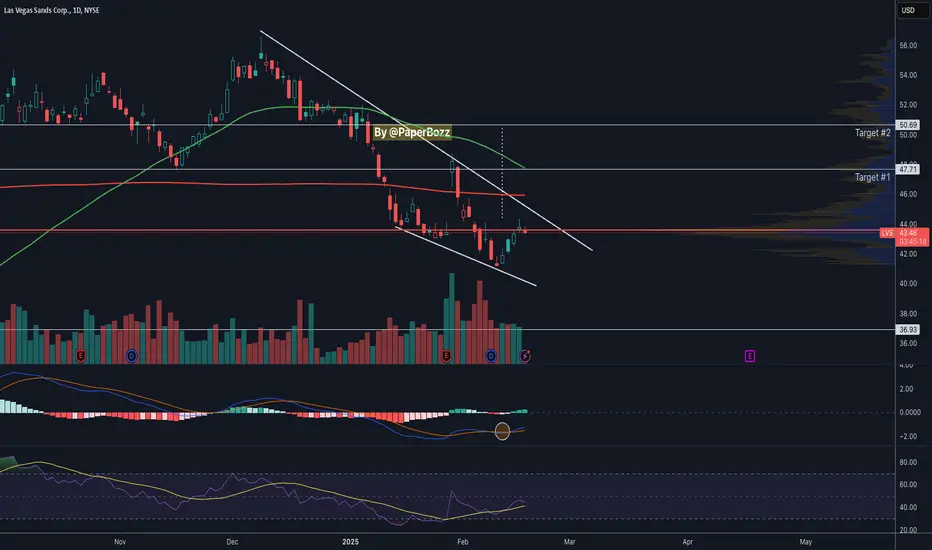
Las Vegas Sands | LVS | Long at $43.76Pros:
Earnings are forecast to grow 13.29% per year
Earnings grew by 18.4% over the past year
2.3% dividend yield
Cons:
Insider selling and exercising of options
Debt-to-equity ratio of 3.8x
Small price gap on the daily chart near $41 that may close prior to a move up.
If people can't buy houses, they will travel... thus, at $43.76, Las Vegas Sands NYSE:LVS is in a personal buy zone.
Targets
$50.00
$57.00
$59.00
Las Vegas Sands Corp Shs Cert Deposito Arg Repr 0.5 Sh
No trades
Trade ideas

"Gambling" on LVS this morning -- Long at 53.46,I was looking through my signals from last week this morning and I came across LVS. Now LVS isn't a lights out safe play, there is risk here and gambling is probably the right word to use in the title. However, good gambling, like good trading, is about pushing your chips to the middle of the table only when the odds favor you.
The signal actually came last week (as you can see from the final white arrow on the chart), but I wasn't ready to push my chips in then, so I let it go and kind of forgot about it for the rest of the week. But this morning, after 5 consecutive down days, which helps put the odds for a short term win in my favor, the risk/reward was good enough for me to ante up here.
We are, I think, at sort of an inflection point in the market overall. If things go south macro-wise, this could be a long, unpleasant trade. But, as Dec-Apr on the chart show, that doesn't mean money can't be made. Given that LVS has never produced a losing trade for me (the world will never run out of gamblers), I got in at a price around 3.5% below that last signal's break even level. What that suggests is that this should be a better than average return trade if I just hold to the recent signal's level. Again, after 5 straight down days, that puts me closer to seller exhaustion as well.
Nothing is guaranteed in the market, even when the history of LVS is 100% wins for me. But when you put the odds in your favor - in this case close to 100% both with a resilient system that pays even in declines, and using those sequential down days to my advantage, you tend to come out ahead. This is not an "all in" trade, however. There is dry powder available to take tactical advantage of any other signals if it does decline or the trade drags out - ALWAYS a good idea.
As always - this is intended as "edutainment" and my perspective on what I am or would be doing, not a recommendation for you to buy or sell. Act accordingly and invest at your own risk. DYOR and only make investments that make good financial sense for you in your current situation.

Las Vegas Sands May Show Signs of PeakingLas Vegas Sands bounced sharply in recent weeks, but some traders may think its longer-term downtrend will resume.
The first pattern on today’s chart is the decline from mid-December through early April. The casino stock retraced half that move before stalling. It also seems to be hitting resistance at a weekly close from March 21.
Second, the 50-day simple moving average (SMA) is under the 100-day SMA. Both are declining. That may be consistent with a longer-term downtrend.
Third, the stock has fallen back below its 8-day exponential moving average. That may suggest its short-term trend is no longer bullish.
Finally, stochastics are dipping from an overbought condition.
Check out TradingView's The Leap competition sponsored by TradeStation.
TradeStation has, for decades, advanced the trading industry, providing access to stocks, options and futures. If you're born to trade, we could be for you. See our Overview for more.
Past performance, whether actual or indicated by historical tests of strategies, is no guarantee of future performance or success. There is a possibility that you may sustain a loss equal to or greater than your entire investment regardless of which asset class you trade (equities, options or futures); therefore, you should not invest or risk money that you cannot afford to lose. Online trading is not suitable for all investors. View the document titled Characteristics and Risks of Standardized Options at www.TradeStation.com . Before trading any asset class, customers must read the relevant risk disclosure statements on www.TradeStation.com . System access and trade placement and execution may be delayed or fail due to market volatility and volume, quote delays, system and software errors, Internet traffic, outages and other factors.
Securities and futures trading is offered to self-directed customers by TradeStation Securities, Inc., a broker-dealer registered with the Securities and Exchange Commission and a futures commission merchant licensed with the Commodity Futures Trading Commission). TradeStation Securities is a member of the Financial Industry Regulatory Authority, the National Futures Association, and a number of exchanges.
TradeStation Securities, Inc. and TradeStation Technologies, Inc. are each wholly owned subsidiaries of TradeStation Group, Inc., both operating, and providing products and services, under the TradeStation brand and trademark. When applying for, or purchasing, accounts, subscriptions, products and services, it is important that you know which company you will be dealing with. Visit www.TradeStation.com for further important information explaining what this means.

Deep retracement reboundNYSE:LVS saw a strong rebound above 123.6% extension of 35.76-56.03. The stock saw a v-shaped rebound with stochastic showing oversold crossover signal. We believe there could be a minor correction before heading for the upside. Long-term target is at 58.00

$LVS - something to think aboutThe $35 to $30 area has only been broken once, during the 2008 global financial crisis. The company sold its US assets and now operates only in Macau and Singapore.

‘Death Cross’ in Las Vegas SandsLas Vegas Sands has been trying to overcome weakness in travel stocks, but some traders may see downside risk.
The first pattern on today’s chart is the December high around $56, slightly above the peak in February 2024. Its failure to break out could suggest the casino operator is trapped in a range.
Second, the August low of $36.62 may be viewed as the potential bottom of the range. Does that create a potential space below Monday’s close of $45.34?
Third, LVS has been unable to stay above either its 50-day simple moving average (SMA) or its 200-day SMA.
Finally, the 50-day SMA just formed a “death cross” below the 200-day SMA. That may suggest its longer-term trend is weakening.
TradeStation has, for decades, advanced the trading industry, providing access to stocks, options and futures. If you're born to trade, we could be for you. See our Overview for more.
Past performance, whether actual or indicated by historical tests of strategies, is no guarantee of future performance or success. There is a possibility that you may sustain a loss equal to or greater than your entire investment regardless of which asset class you trade (equities, options or futures); therefore, you should not invest or risk money that you cannot afford to lose. Online trading is not suitable for all investors. View the document titled Characteristics and Risks of Standardized Options at www.TradeStation.com . Before trading any asset class, customers must read the relevant risk disclosure statements on www.TradeStation.com . System access and trade placement and execution may be delayed or fail due to market volatility and volume, quote delays, system and software errors, Internet traffic, outages and other factors.
Securities and futures trading is offered to self-directed customers by TradeStation Securities, Inc., a broker-dealer registered with the Securities and Exchange Commission and a futures commission merchant licensed with the Commodity Futures Trading Commission). TradeStation Securities is a member of the Financial Industry Regulatory Authority, the National Futures Association, and a number of exchanges.
TradeStation Securities, Inc. and TradeStation Technologies, Inc. are each wholly owned subsidiaries of TradeStation Group, Inc., both operating, and providing products and services, under the TradeStation brand and trademark. When applying for, or purchasing, accounts, subscriptions, products and services, it is important that you know which company you will be dealing with. Visit www.TradeStation.com for further important information explaining what this means.

$LVS - Looks attractiveNYSE:LVS looks attractive. If the wedge plays out, it could hit $47 to $50 area.
As always, I share my opinions and trades. I'm not suggesting anyone follow my trades. You do you.
LVS to $48My trading plan is very simple.
I buy or sell when price tags the top or bottom of parallel channels.
I confirm when price hits Fibonacci levels.
So...
Here's why I'm picking this symbol to do the thing.
Price at bottom of channels (period 100 52 39 & 26)
Stochastic Momentum Index (SMI) at oversold level
VBSM is spiked negative and under Bollinger Band
Entry at $45.25
Target is $48 or channel top

$LVS with a bullish outlook following its earnings #StocksThe PEAD projected a bullish outlook for NYSE:LVS after a positive under reaction following its earnings release placing the stock in drift A with an expected accuracy of 77.78%.

the amount of gaps left behind..Price looks like it is being absorbed right now and unfortunetly it didnt hit my line on 55.64 no matter
I sold my shares at a great profit and now i am waiting for it to close at least some of the imbalances and retrace so i can buy again.
Chances are, buy the look of reduced volume and falling price, that a healthy retracement is to occur.
Remember, making money in the markets is to buy things for less than they are worth.
Yearly Vwap is within the gap and a nuke down can give us low vwap support
I'd be ready for any confluence
an RSI divergence is also spotted on the daily with lower volume

LVS SELL ++++LVS another stock trading like a biotech on china stimulus nonsense. Targets $49.19, $46.94 and possibly gap fill

Las Vegas Sands Corp. - LONGHere are the reasons for long:
1. Price has reached a bullish zone (MO)
2. Price made a flip
3. Bullish divergencve on RSI
4. Bullish Volume Confirmation
5. Bullish Candlestick pattern
Expected TP $49.5
SL $36.62 (aggresive) or $33.38

LVS Las Vegas Sands Options Ahead of EarningsIf you haven`t bought the dip on LVS:
Now analyzing the options chain and the chart patterns of LVS Las Vegas Sands prior to the earnings report this week,
I would consider purchasing the 40usd strike price Calls with
an expiration date of 2024-9-20,
for a premium of approximately $3.00.
If these options prove to be profitable prior to the earnings release, I would sell at least half of them.


LVS can increase in short-term but it will sleep very long time!1) I caught Chart Pattern which is called Symmetrical Triangle on RSI indicator. I drew a line and it shows that this security will sleep very long time to 2033. As you see resistance line of RSI worked very well in the past. It is coming from 2018 and it broke its resistance line already. RSI's 2 moving averages have not crossed yet and it is valid for sell sign.
2) In 2018 Momentum resistance line worked very well like RSI resistance line. I applied moving average on Momentum indicator as you see orange one(8 period SMA). Momentum has not crossed its moving average and it is valid for sell sign.
3) I drew Support line on CCI indicator. It touched 3 times and it is important support line. Also i applied moving average on CCI indicator(14 period WMA). It is valid for sell sign because CCI did not cross its moving average yet.
4) DMI indicator has 3 moving average. +DI(blue one), -DI(orange one) and ADX(red one). ADX is showing trend power not trend direction. It is very important and if it is less than 20, security has low volatility and it is going sideways.
5) Last one, i drew resistance and support line on prices and support line was touched 5 times and it is very important support line. Security can bounce from there. Also Resistance line must be broken soon if security will increase new level of prices.

Lang Target - 65$1. Supertrend positiv
2. Positiv squeeze indicator
3. Up Trend
Target & invalidation level marked in chart


$LVS - Can it breakout?NYSE:LVS Las Vegas Sands has been trading inside a descending broadening wedge.
The oscillators are trending up while the price is in consolidation. Closing above $50 will validate the wedge breakout and open the door to further upside potential.
Upside Targets:
$53
$56
$62
Downside risk:
$44 - $42


Las Vegas Sands Beats expectations Las Vegas Sands (LVS) shares are higher in after-hours trading after the casino operator beat third-quarter earnings expectations and announced it will be authorizing a $2 million buyback program.
Zions Bancorporation (ZION) shares are trading lower in extended hours as the company’s total third-quarter deposits came in lower than analysts expected.
Equifax (EFX) shares are down in after-hours as the company cut its full-year adjusted earnings per share guidance due to the mortgage market in the U.S. and foreign exchange impact.

LVS: Ride Long TradeThis trade was entered on the 14 Feb, I forgot to update it on here. At that point my LVS option trade was performing very well and moving somewhat independently from the broad market. However this changed on the Week of the 15 Feb when Retail and CPI results turned out stronger than expected.
I'm not exiting because I believe the hypothesis still holds and what we are seeing is a broad market reaction which should normalise and then we can make a clearer decision. I expect normalisation to happen on the week of the 7 Feb (Monday, 6 Feb is a bank holiday).
---- Trade Hypothesis ----
It looks like in the short term traders will be more concerned about interest rates and the impact it will have. The sentiment now seems to be that recession will be a soft landing. I think we need to trade on this optimism at least for the next month.
Lets look at categories with strong fundamentals where money might flow into given it’s stability
Resorts and Casinos especially LVS is prime because of China opening up. Most of LVS' casinos are based in Macau and one in Singapore. Similar to the travel industry, we should experience once again the spending power of China's tourism force
