Mastercard Picks Polygon for Self-Custody Identity UpgradeMastercard has expanded its Mastercard Crypto Credential program to self-custody wallets, and selected Polygon as the first blockchain network to support the rollout. Together with Polygon Labs and Mercuryo, Mastercard is introducing verified, username-style aliases that replace long wallet addresses, bringing a familiar, Web2-like UX to Web3 value transfers.
The upgrade enables users to link a self-custody wallet to a verified alias, receive assets using that username, and optionally mint a soulbound credential on Polygon. Mercuryo handles KYC onboarding and credential issuance, while Polygon provides the speed, reliability, and low-cost infrastructure required for identity and payments at global scale.
Polygon’s selection is driven by its enterprise-friendly architecture: sub-cent fees, instant settlement, high throughput, and no reorg risk following the recent Rio and Heimdall v2 upgrades. With stablecoin volume already in the billions monthly and strong penetration among neobanks and payment providers, Polygon is well-positioned to power next-generation digital identity and payment rails. The collaboration marks a major step toward mainstream-ready self-custody, intuitive, secure, and trusted.
Technical Outlook, Mastercard (MA)
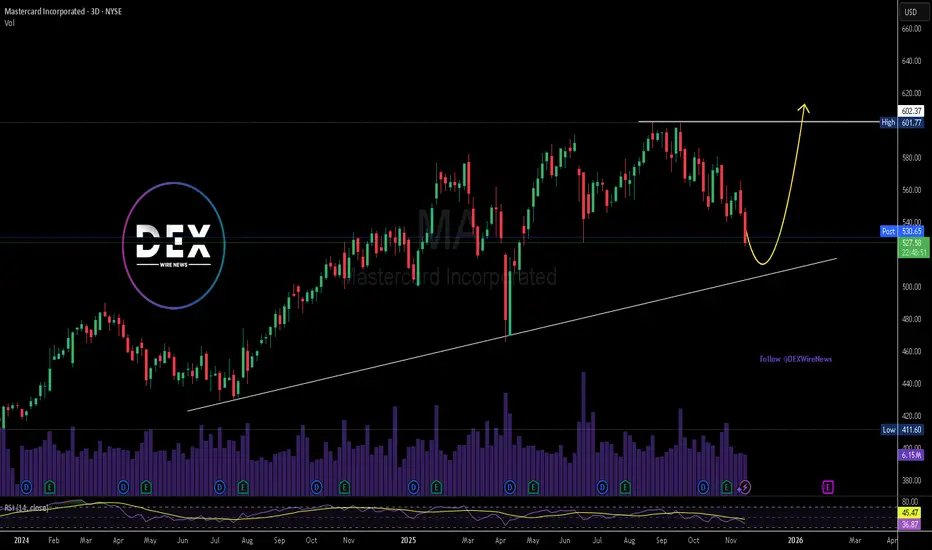
Mastercard’s stock is pulling back toward a multi-year ascending trendline, aligning with a major liquidity zone below the $527 low. The chart shows a potential sling low forming, with price rebounding from trendline support historically before rallying toward prior highs.
If bulls hold support, the next upside target is the $600–$602 resistance level. A breakout above this zone could open a path toward new all-time highs, aligning with improving sentiment around digital payments and Mastercard’s increasing involvement in blockchain infrastructure.
Momentum indicators signal near-term exhaustion, but the macro trend remains intact. A clean reaction from support could trigger a medium-term recovery.
Trade ideas
Mastercard Expands Fintech Footprint Through Globba Partnership Mastercard Inc. (NYSE: NYSE:MA ) continues to reinforce its leadership in global payment infrastructure with the launch of Globba™, a next-generation cross-border payment solution developed in collaboration with FNB and RMB Private Banking. Powered by Mastercard Move, the platform simplifies international money transfers for South Africans, offering fast, transparent, and traceable transactions to over 120 countries.
Fundamentally, this partnership highlights Mastercard’s growing footprint in Africa’s rapidly digitizing economy. The continent’s cross-border remittance flows have expanded sharply, with Mastercard research noting that 60% of South Africans sent money abroad in 2024, up from 59% in 2022. Globba™ integrates Mastercard Move’s reach across 200+ countries and 150+ currencies, reflecting the company’s commitment to inclusion and financial connectivity. This positions Mastercard as a key enabler in Africa’s G20-aligned modernization of payment systems, potentially driving new revenue streams in both consumer and B2B remittance corridors.
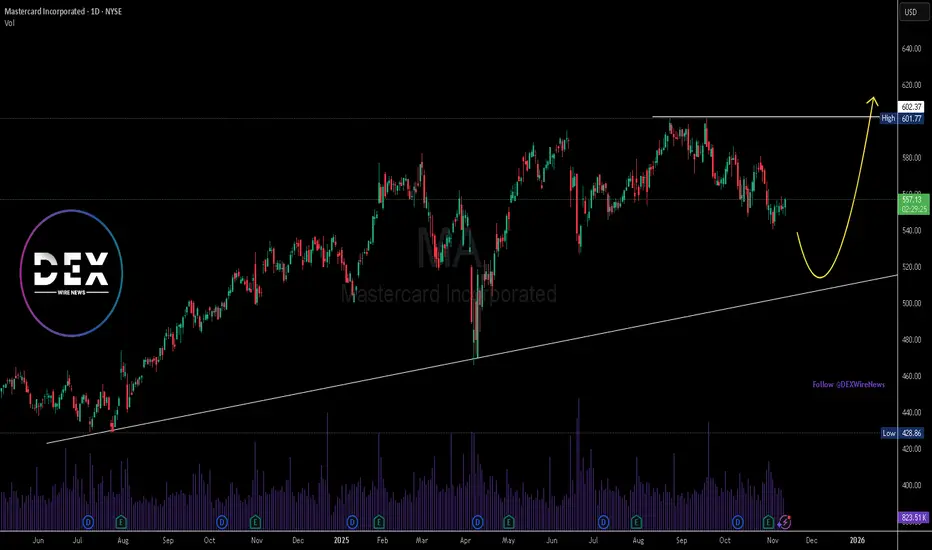
Technically, Mastercard’s stock ( NYSE:MA ) shows a strong long-term uptrend despite recent consolidation. The daily chart indicates support around the $510 zone, with a possible short-term pullback before rebounding toward resistance near $602, as outlined by the yellow projection curve in the chart. Sustaining above $540 could trigger bullish momentum, targeting a retest of all-time highs above $600. Rising volume and consistent higher lows underscore accumulation within a strong structural uptrend, suggesting long-term investors may see continued appreciation aligned with Mastercard’s expansion into emerging digital economies.
As Mastercard combines innovation with global scale, its fundamentals remain strong and its chart poised for potential breakout momentum into 2026.
Mastercard (MA) Hits Key Cycle Top — Correction Incoming!🧠 Mastercard (MA) — In-Depth Multi-Framework Market Analysis
Mastercard’s long bull run has matured into a classic Wave 5 exhaustion.
Multiple frameworks agree: a deep corrective phase is likely ahead.
Understanding market structure, smart money moves, and Fibonacci levels can help you navigate this reset .
🌀 Wave Theory & Elliott Wave Context
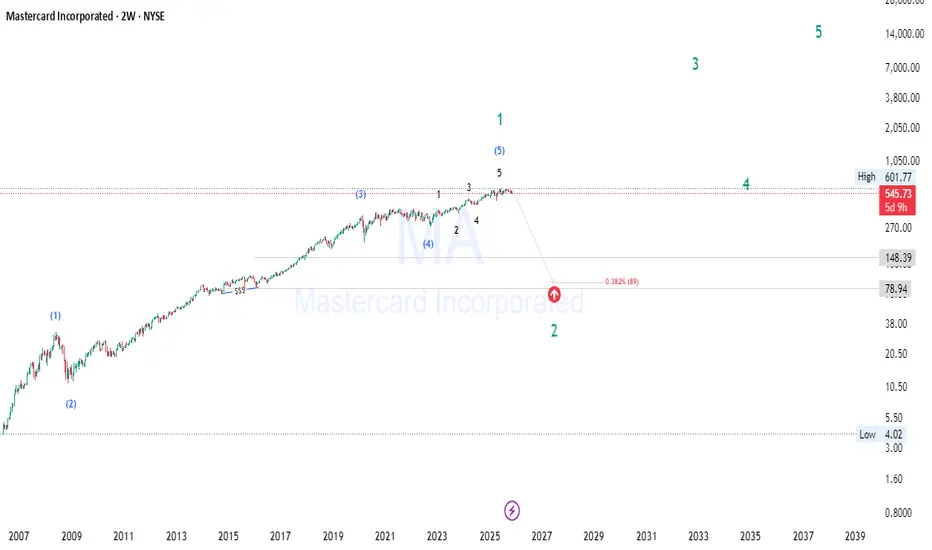
Mastercard’s chart shows a clear completed 5-wave impulsive structure spanning roughly 15+ years, typical of a major secular bull cycle. The small sub-waves within Wave 5 suggest final exhaustion:
Wave 5 ending near key Fibonacci extensions signals an exhaustion climax.
After such extended waves, expect a significant corrective ABC pattern or even a complex correction resetting much of the prior gains.
The correction here is likely a large Wave 2 on the higher degree, meaning the retracement could be deep and prolonged, typically lasting multiple years.
📉 Market Structure Breakdown & Key Price Action Signals
Price has failed to push to new highs with conviction, showing lower highs and a breakdown of previous support levels.
This breakdown in market structure suggests the shift from an accumulation or markup phase to distribution and markdown.
Multiple wick rejections and volume spikes near highs imply liquidity sweeps and stop hunts by institutions, signaling transfer of risk.
Price action shows signs of fatigue — smaller candles, overlapping bars, and diminished momentum — classic exhaustion signals.
🧠 Smart Money Concepts (SMC)
Institutional players often engineer liquidity grabs above key levels (stop hunts) to shake out retail participants.
The immediate reversal following those liquidity grabs is a hallmark of distribution , where "smart money" sells into retail enthusiasm.
The absence of strong demand at these levels reinforces the notion of a shift from bullish to bearish control.
📊 Fibonacci Retracement & Extension Levels
Wave 5 terminated near the 2.618 Fibonacci extension , an extreme but well-documented exhaustion zone for extended impulses.
The retracement target aligns with the 0.382 Fibonacci retracement (~$89–95) , the first major support for Wave 2 corrections.
More conservative estimates place support near 0.5–0.618 retracement , which historically mark deep correction zones in longer cycles.
These levels also coincide with significant prior consolidation zones, increasing their validity as support.
💼 Fundamental Context & Market Cycles
Mastercard’s underlying fundamentals remain solid, with strong revenue growth and market dominance.
However, market cycles are driven by liquidity and psychology — no fundamentally strong company is immune to price corrections during macro resets.
This correction could coincide with broader economic or sector rotation phases, impacting valuation multiples and capital flows.
🔮 Strategic Outlook & Trading Implications
Expect a multi-year correction phase , potentially volatile, with several retracements and consolidations along the way.
Patience is key: major Wave 2 corrections often shake out weak holders and reset risk/reward dynamics for the next bull phase (Wave 3).
Traders should look for confluence zones combining Fibonacci support, prior market structure, and volume profile for entries.
Watch for price action confirmation of a base formation before resuming a bullish stance.
💡 Key Takeaways for Traders
Long-term cycle completion means caution: avoid chasing new highs here.
Use Fibonacci and wave structure to anticipate price targets and exits.
Monitor volume and liquidity sweeps to identify distribution phases.
Be prepared for deep, sometimes painful corrections even in high-quality stocks.
Focus on risk management and position sizing during volatile cycle resets.
Stay ahead of the market — follow for advanced wave counts, Fibonacci setups, and smart money insights.
Comment 👇 your ticker to get a personalized deep-dive analysis next! 🚀
Disclaimer:
This analysis is for educational purposes only and does not constitute financial advice. Always conduct your own research and consult a professional before trading.
#Mastercard #MA #WaveTheory #ElliottWave #SmartMoneyConcepts #SMC #Fibonacci #MarketStructure #PriceAction #TradingView #TechnicalAnalysis #StocksToWatch #MarketCycles #LiquidityHunt #TradingEducation #InvestSmart #StockAnalysis
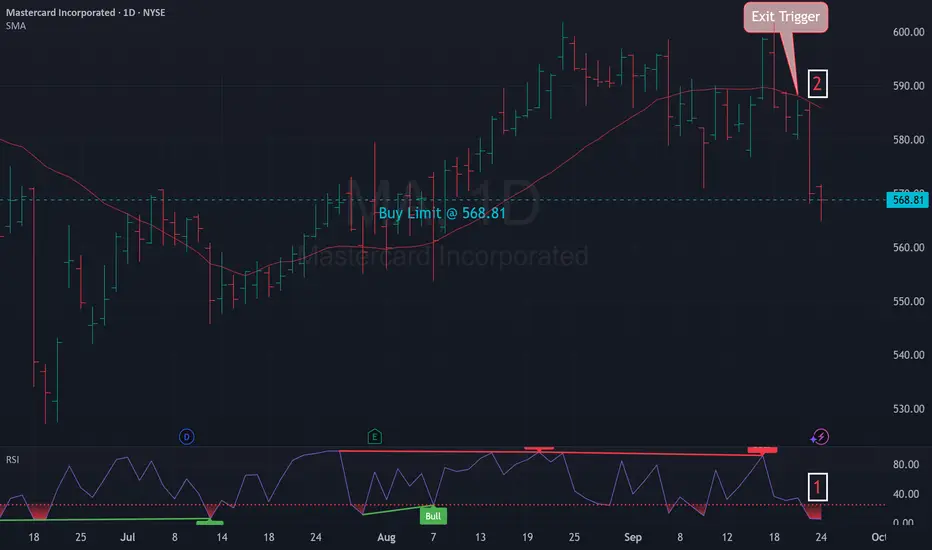
Mean Reversion Setup: MA1. RSI in oversold region
2. Price likely to rebound back the the mean
Trade Rules:
Entry Trigger - RSI has cross below oversold region, enter limit buy at close price
Exit Trigger - Close at market when close price cross above exit trigger (Red Line)

Mean Reversion Setup: MA1. RSI in oversold region
2. Price likely to rebound back the the mean
Trade Rules:
Entry Trigger - RSI has cross below oversold region, enter limit buy at close price
Exit Trigger - Close at market when close price cross above exit trigger (Red Line)
Mastercard Wave Analysis – 2 October 2025
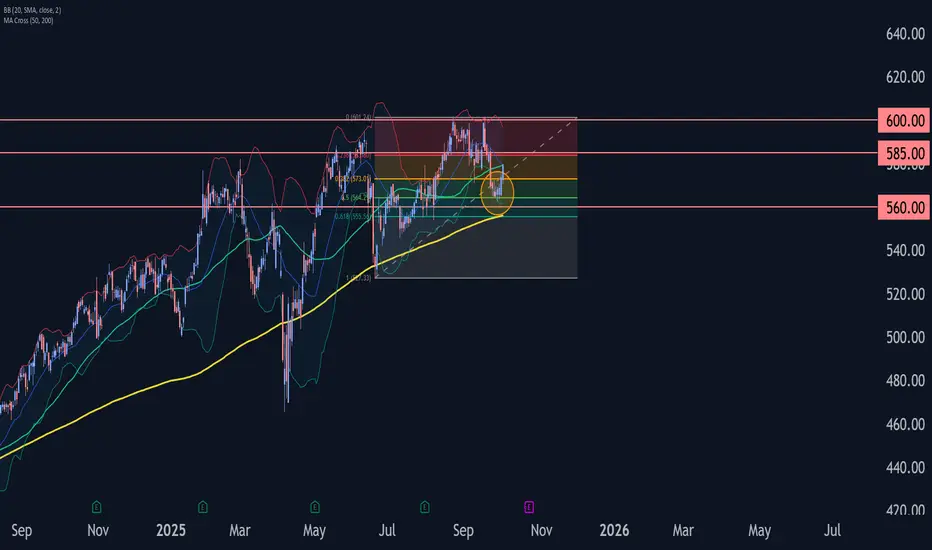
- Mastercard rising inside impulse wave 3
- Likely to rise to resistance levels 585.00 and 600.00
Mastercard continues to rise inside the impulse wave 3, which started earlier from the support area between the support level 560,00 (which has been reversing the price from July) and the lower daily Bollinger Band.
The support level 560,00 was strengthened by the 50% Fibonacci correction of the previous sharp upward impulse 1 from June.
Given the clear daily uptrend, Mastercard can be expected to rise to the next resistance levels 585.00 and 600.00 (which stopped earlier waves 1 and b).
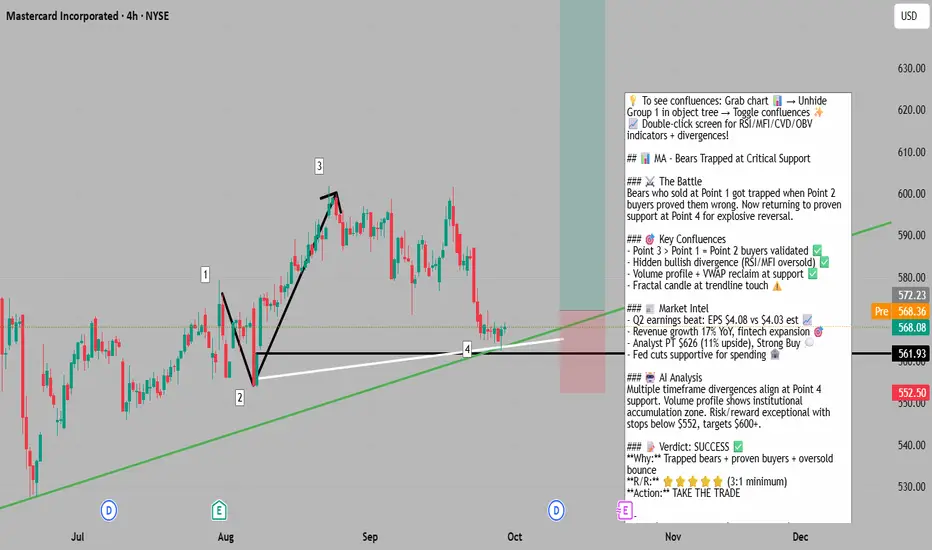
Bulls Trapped at Critical Support - Reversal Spring Loads💡 To see my confluences and/or linework: Step 1: Grab chart 📊, Step 2: Unhide Group 1 in object tree 🎯, Step 3: Hide and unhide specific confluences one by one ✨. Double-click the screen to reveal RSI, MFI, CVD, and OBV indicators alongside divergence markings! 📈
The Market Participant Battle:
Bears trapped selling at critical support (Point 1) got proven wrong when bulls defended Point 2, confirming genuine buying strength. At Point 4, we're returning to these proven buyers who successfully defended the selloff attempt. Price is expected to spring higher as trapped bears cover and new buyers recognize the strength of this support zone.
Confluences:
Confluence 1: The Number Pattern (1→4 Price Action)
Point 3 closes above Point 1, marking Point 2 buyers as proven market participants who successfully disproved the bearish thesis from Point 1. At Point 4, we're returning to this proven set of buyers. The trendline lands exactly at Point 4, which happens to be a fractal candle with divergence on lower timeframes. This isn't just support - it's a confluence of multiple technical validations.
Confluence 2: Hidden Bullish Divergence Cluster
Between Points 2→4, price forms a higher low while RSI and MFI make lower lows, creating hidden bullish divergence. Both RSI and MFI are oversold at Point 4, adding strength to the reversal signal. CVD shows bullish divergence as well, and all divergences become layered with divergence appearing on the candle level - a powerful multi-timeframe confirmation.
Confluence 3: Volume Profile & VWAP Dynamics
Anchored volume profile from Point 0 shows price dipped under the developing POC, just now closing back above - a bullish reclaim. Volume profile on the 1→2 swing shows price reacting precisely to the value area low. VWAP at Point 1 shows price pulled under the 1st deviation heading toward the 2nd, but pulled back and closed above the 1st deviation, showing seller weakness and buyer strength emerging.
Web Research Findings:
- Technical Analysis: MA currently at $567-583 range with strong support at $534, RSI at 42-60 (neutral to slightly oversold), MACD showing buy signals
- Recent News/Earnings: Q2 2025 earnings beat expectations (EPS $4.08 vs $4.03 est), net revenue growth 16-17% YoY, strong fintech partnerships with 11 new startups
- Analyst Sentiment: Strong Buy consensus with 35 analysts, average PT $626 (11% upside), highest PT $690 from UBS
- Data Releases & Economic Calendar: Q3 earnings on Oct 23, 2025 expected EPS $4.31
- Interest Rate Impact: Fed cut rates to 4.00-4.25% in Sept, two more cuts expected in 2025 - positive for consumer spending and MA transaction volumes
Layman's Summary:
Mastercard is showing strong business growth with revenues up 17% and beating earnings expectations. The stock found support exactly where technical patterns suggested buyers would step in. With the Fed cutting rates (making it cheaper to borrow and spend), consumer transactions should increase. Wall Street analysts love the stock with an average target 11% higher. The company is expanding aggressively in fintech and emerging markets. In simple terms: The business is growing fast, the stock is at a good technical entry point, and the economic environment is becoming more favorable for payment companies.
Machine Derived Information:
- Image 1: Daily chart showing Points 1-4 pattern with clear support zone at $561-566 - Significance: Strong institutional buying zone confirmed - AGREES ✔
- Image 2: Zoomed view highlighting volume profile and VWAP interactions - Significance: Multiple technical validations at current levels - AGREES ✔
- Image 3: Full pattern view with all confluences visible - Significance: Comprehensive bullish setup with risk/reward clearly defined - AGREES ✔
Actionable Machine Summary:
All technical indicators align bullishly at Point 4. The fractal candle formation, combined with oversold conditions on oscillators, hidden bullish divergence across multiple indicators, and volume profile support creates an extremely high-probability reversal zone. The fact that multiple timeframes show the same bullish signals increases confidence. Entry at current levels ($566-569) with stops below Point 2 ($552) offers excellent risk/reward targeting the $600+ resistance zone.
Conclusion:
Trade Prediction: SUCCESS
Confidence: High
The confluence of trapped bears at proven support, multiple divergences, volume profile dynamics, strong fundamentals (17% revenue growth), and favorable analyst sentiment creates a compelling long setup. With Fed rate cuts supporting consumer spending and MA's aggressive fintech expansion, both technicals and fundamentals align for upside. Risk/reward strongly favors longs with clear stop below $552 and targets at $600-620 range.
Mastercard Wave Analysis – 17 September 2025
- Mastercard broke daily down channel
- Likely to rise to resistance level 600.00
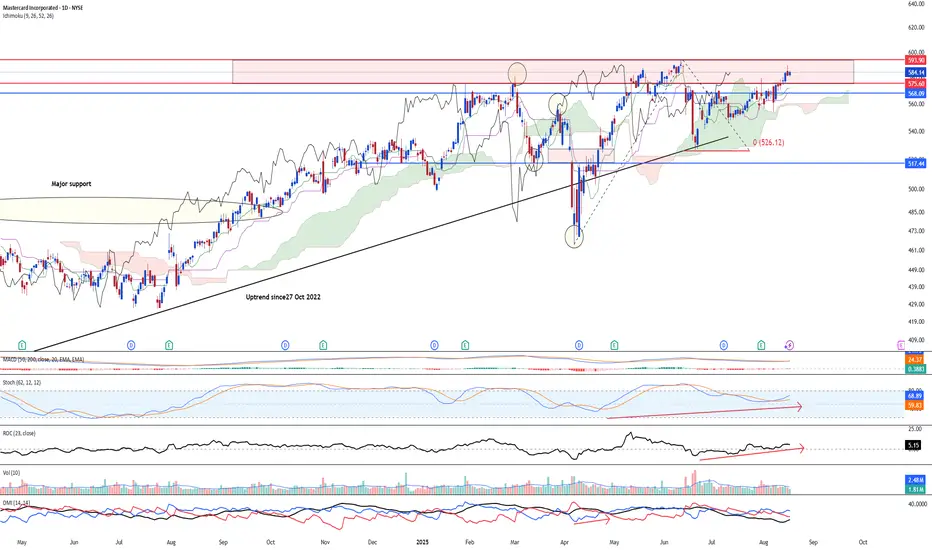
Mastercard recently broke the resistance trendline of the daily down channel from the end of August (which enclosed the previous minor ABC correction ii).
The breakout of this down channel continues the active impulse wave iii of the sharp impulse wave C from June.
Given the strong multi-month uptrend, Mastercard can be expected to rise to the next round resistance level 600.00 (top of wave i from the end of August).

Mastercard - Master your uptrend NYSE:MA is looking at a potential bullish upside after resuming back into its major uptrend line. With the resistance zone between 575.60-595.90 tested multiple times, the stock is looking at a weakening resistance zone, therefore increasing the probability of an upside break. MACD is looking at steady upside momentum. Stochastic just crossed above the 50-mid level and it indicate an resumption of an upside.
Target is at 672.oo over the longer-term period.
MASTERCARD Best Buy Entry Now, Target $577.50.
## 💳 MA Options Play: Weekly Bullish Setup with Caution!
**Mastercard (MA)** showing bullish momentum — but options flow says: “Proceed carefully.”
---
### 🟢 Bullish Signals (4/5 Models Agree):
* 📈 Weekly RSI uptrending
* 🔊 Strong weekly volume
* 🌀 Low volatility = cleaner setup
* 🧠 Multiple models (Grok, Claude, Llama, DeepSeek) lean BULLISH
### 🔴 Caution Flag:
* ⚠️ Bearish options flow detected (institutions possibly hedging)
---
### 🔍 Trade Setup:
**🎯 MA \$577.50 CALL**
* 💵 Entry: \$0.80
* 🎯 Target: \$1.20
* 🛑 Stop: \$0.40
* 📆 Expiry: Aug 5, 2025
* ⚖️ Risk: \~50% of premium
* 🕒 Entry: Market Open
---
### 🧠 Consensus Rating:
☑️ **Confidence: 65% (Moderate Bullish)**
☑️ Volume + RSI = Green Lights
☑️ Options flow = Yellow Light
---
### 🎯 Strategy Tip:
Small size. Quick exit. Watch options flow LIVE — if it shifts bullish, ride momentum. If not? Tight risk control.

Top 4 Buy Signals Lighting Up Mastercard (MA) 🚀 Top 4 Buy Signals Lighting Up Mastercard (MA) | Rocket Booster Strategy
Mastercard Inc. (MA) is showing explosive potential, and it’s not just one signal—it’s a whole confluence of confirmations. When
you align this much market momentum, you don’t ignore it. Let’s break down how Rocket Booster Strategy gives us a powerful buy indication on the daily chart.
🔍 The Confluence Setup
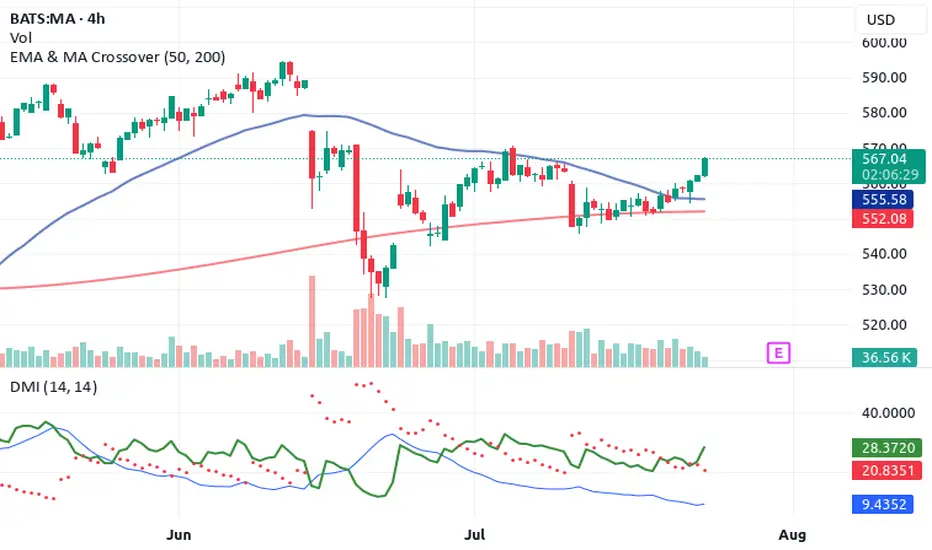
✅ 1. DMI Buy Signal
The Directional Movement Index (DMI) is in bull mode. ADX is
rising and the +DI is firmly above -DI. This shows the trend is not just alive—it’s gaining strength.
🔻 2. Volume Oscillator Pullback
While Volume Oscillator is down, this is seen as constructive and not bearish. It suggests a quiet zone before the thrust—just like fuel loading before a rocket launch.
Smart traders know: momentum can build silently.
💥 3. Awesome Oscillator = Strong Buy
The Awesome Oscillator is green and firing hard. We’ve seen a clear twin-peak bullish formation followed by a break above zero
—classic acceleration sign.
🕯️ 4. Rising Window (Japanese Candlestick Pattern)
A Rising Window—a bullish continuation gap—has formed. This is one of Steve Nison’s top continuation patterns. It signals strong
institutional conviction in this trend.
📈 What Does This Mean?
When DMI, AO, candlestick patterns, and our own Rocket Booster Strategy all point up, it’s time to pay attention. This setup is rare—and high-probability.
🧠 Rocket Booster Strategy Recap
This strategy uses 3 momentum alignment points:
High Momentum Indicator (like AO) in Buy Mode
Pattern Confirmation (Rising Window or Engulfing)
Volume Correction Before Breakout (Fuel Before Fire)
When all 3 click into place, we have ignition.
🎯 Final Thoughts
Mastercard is looking primed for takeoff on the daily timeframe. Whether you’re an investor or a swing trader, this chart is
speaking loud and clear. But as always, risk management is your co-pilot.
✅ Add it to your watchlist.
🚀 Simulate entries.
🧠 Trust the confluence.
Rocket Boost This Content To Learn More
Disclaimer: This is not financial advice. Always use a simulation/demo account before committing real capital. Trade responsibly.
Mean Reversion Trade: MA1. RSI in oversold region
2. Price likely to rebound back the the mean
Trade Rules:
Entry Trigger - RSI has cross below oversold region, enter limit buy at close price
Exit Trigger - Close at market when close price cross above exit trigger (Red step line)

MASTERCARD Best buy entry now. Target $625.Mastercard (MA) has been trading within almost a 3-year Channel Up that only broke (but recovered naturally) during Trump's trade war. Still, the 1W MA100 (green trend-line) contained the downfall, as it always had.
Normally the Bearish Legs of this pattern tend to find Support on the 1W MA50 (blue trend-line), as the latest one did 3 weeks ago. Now that the price is trading still on the 0.382 Fibonacci retracement level, it historically is the best buy opportunity, as per all previous Bullish Legs.
The Channel Up has always priced its Higher High (top) on at least the -0.236 Fibonacci extension. As a result, we are targeting $625.00 before the year ends.
-------------------------------------------------------------------------------
** Please LIKE 👍, FOLLOW ✅, SHARE 🙌 and COMMENT ✍ if you enjoy this idea! Also share your ideas and charts in the comments section below! This is best way to keep it relevant, support us, keep the content here free and allow the idea to reach as many people as possible. **
-------------------------------------------------------------------------------
💸💸💸💸💸💸
👇 👇 👇 👇 👇 👇

Mastercard Could Face ResistanceMastercard fell hard in June on the threat of stablecoin competition. Now, after a rebound, some traders may expect another push to the downside.
The first pattern on today’s chart is the selloff that began on June 13 when the Wall Street Journal reported that major retailers were considering stablecoins as an alternative to credit-card payment systems. Another drop came the following week after the U.S. Senate passed the GENIUS Act regulating stablecoins.
The stock recovered in the second half of June but it halted at the post-drop closing high of $569.45. Has new resistance emerged?
Third, prices could be stalling at the 50-day simple moving average. The 8-day exponential moving average (EMA) is additionally below the 21-day EMA. Those signals may reflect weakening intermediate- and short-term trends.
Fourth, stochastics have reached an overbought condition.
Finally, this month’s lower high could potentially represent the start of a new falling channel. Such a pattern could make investors expect a lower low closer to $500.
Check out TradingView's The Leap competition sponsored by TradeStation.
TradeStation has, for decades, advanced the trading industry, providing access to stocks, options and futures. If you're born to trade, we could be for you. See our Overview for more.
Past performance, whether actual or indicated by historical tests of strategies, is no guarantee of future performance or success. There is a possibility that you may sustain a loss equal to or greater than your entire investment regardless of which asset class you trade (equities, options or futures); therefore, you should not invest or risk money that you cannot afford to lose. Online trading is not suitable for all investors. View the document titled Characteristics and Risks of Standardized Options at www.TradeStation.com . Before trading any asset class, customers must read the relevant risk disclosure statements on www.TradeStation.com . System access and trade placement and execution may be delayed or fail due to market volatility and volume, quote delays, system and software errors, Internet traffic, outages and other factors.
Securities and futures trading is offered to self-directed customers by TradeStation Securities, Inc., a broker-dealer registered with the Securities and Exchange Commission and a futures commission merchant licensed with the Commodity Futures Trading Commission). TradeStation Securities is a member of the Financial Industry Regulatory Authority, the National Futures Association, and a number of exchanges.
TradeStation Securities, Inc. and TradeStation Technologies, Inc. are each wholly owned subsidiaries of TradeStation Group, Inc., both operating, and providing products and services, under the TradeStation brand and trademark. When applying for, or purchasing, accounts, subscriptions, products and services, it is important that you know which company you will be dealing with. Visit www.TradeStation.com for further important information explaining what this means.

Who will win? Crypto or Dollar?How Stablecoin Payments Can Hurt Visa & Mastercard
Bypassing the Interchange System
-Stablecoins allow peer-to-peer or business-to-consumer payments without using credit/debit card rails.
-Visa & Mastercard earn billions from interchange fees (0.1%–3% per transaction). If people pay directly via a stablecoin wallet (e.g. USDC, USDT), these fees vanish.
Faster, Cheaper Cross-Border Payments
-Traditional card transactions (especially international) can be slow and expensive.
-Stablecoins on blockchains like Solana or Ethereum L2s allow near-instant settlement with near-zero fees, reducing the demand for VisaNet and Mastercard systems.
Merchant Preference
-Merchants often pay 1–3% in processing fees to card networks.
-Accepting stablecoins directly = zero or minimal fees, increasing merchant pressure to move away from cards.
Fintech Adoption
-Companies like Stripe, PayPal, Shopify, and Square are integrating stablecoins.
-If these platforms offer cheaper stablecoin settlement options, users and merchants may shift away from traditional card use.
How Visa & Mastercard Could Defend or Adapt
Partner with Stablecoin Networks
-Both companies are already testing stablecoin payments:
-Visa is piloting USDC settlements on Solana and Ethereum.
-Mastercard partnered with Paxos and others to test blockchain-based settlements.
These moves show they're not ignoring the shift, but trying to build rails for stablecoins too.
Act as On-/Off-Ramps
-They can remain dominant as the entry and exit point between fiat and crypto (e.g. buying crypto with cards, or topping up crypto wallets).
-This maintains transaction volume even if some purchases happen in stablecoin.
Expand to B2B and API Infrastructure
-Visa and Mastercard are expanding into B2B transactions, open banking, and embedded finance APIs (e.g. Visa Direct, Mastercard Send).
-This diversifies revenue beyond retail card swipes.
Leverage Network Trust
-Stablecoins may lack consumer protection (fraud protection, chargebacks).
-Visa and Mastercard can market themselves as the trusted rails for consumers and businesses — especially in fraud-prone areas.
-Disclaimer: This analysis is for informational and educational purposes only and does not constitute financial advice, investment recommendation, or an offer to buy or sell any securities. Stock prices, valuations, and performance metrics are subject to change and may be outdated. Always conduct your own due diligence and consult with a licensed financial advisor before making investment decisions. The information presented may contain inaccuracies and should not be solely relied upon for financial decisions. I am not personally liable for your own losses, this is not financial advise.

Mastercard and Visa Shares Decline Due to Stablecoin BillMastercard (MA) and Visa (V) Shares Decline Due to Stablecoin Bill
Yesterday, we reported that the US Senate had passed the GENIUS stablecoin bill, which establishes a legal framework for regulating the stablecoin market. This development led to a sharp rise in the share price of cryptocurrency exchange Coinbase (COIN), while simultaneously putting pressure on Mastercard (MA) and Visa (V) shares.
According to media reports, market participants are concerned that stablecoins could pose serious competition to these companies, which earn revenue primarily from transaction fees. This serves as an example of how blockchain technology, with its low-cost features and high speed, could disrupt leaders in the traditional finance sector.
Technical Analysis of Mastercard (MA) Stock Chart
In May, MA shares formed an upward trend (shown in blue), but this was already broken by a strong downward move, accompanied by a wide bearish gap in the $575–$585 range.
Near the lower boundary of the channel, a contracting triangle pattern (shown in black) can be observed – this can be interpreted as a temporary balance between buyers and sellers. However, it didn’t last long: the widening spread of bearish candles (1 and 2) indicates growing selling pressure.
It’s possible that following a drop of over 9% from the June high, Mastercard (MA) shares might attract buyers betting on a short-term rebound. Nevertheless, in the longer term, developments related to the GENIUS bill could contribute to a continued downward trend.
This article represents the opinion of the Companies operating under the FXOpen brand only. It is not to be construed as an offer, solicitation, or recommendation with respect to products and services provided by the Companies operating under the FXOpen brand, nor is it to be considered financial advice.

A whole new type of cash back offer - LONG at 562.03I've posted ideas about MA before. I will continue posting buy ideas about MA until the final breath leaves my body. The average credit card APR is 24.3% - I think this trade can do better. Around 60% APR on average, with a good chance at 270%+ APR.
MA is in a multi-year uptrend, only 2 days removed from its all time high. Smoked today not because they lost their CEO or their business model is a failure, but because two historic enemies took shots at each other halfway across the world. While I won't completely ignore geopolitics, its effects are almost always transitory. I literally can't find a better reason to buy this as a short term blip in their long term story.
On a day where, when the whole market fell just over 1%, MA fell 4x that. I will take that gift and run wild with it. Historically, MA has never failed to produce a profitable trade for me, with an average gain of +.24% per trading day (that's 60% annualized). The average trade length has been 7 days and gained 1.7%.
However, using an additional filter, the per day returns for the last 25 trades have increased to +1.07% per trading day (270% annualized). That's 4x the old returns and almost 25x the long term average daily return of the S&P 500. The average trade length has shortened to 5.5 trading days and produced an increased average return of 2.45% as well.
Additional lots may be added if the signal is re-triggered before I close it. There is no specific profit target, but I will redeem my cash back offer and close any lot end of day when an exit signal is triggered and the lot is profitable.
As always - this is intended as "edutainment" and my perspective on what I am or would be doing, not a recommendation for you to buy or sell. Act accordingly and invest at your own risk. DYOR and only make investments that make good financial sense for you in your current situation.

MA another financial cup and handleMastercard is another name in the financial sector that is showing a cup and handle formation on the daily chart. Two price targets to break at $585.60 and the ATH of $588.45 and it's off to new highs.

Mastercard: Approaching the Top of Wave BMastercard has rebounded after a brief cooling period, and we now expect turquoise wave B to complete just below resistance at $620. Once that top is in, wave C should drive a meaningful retracement, ending with the low of magenta wave (4). Alternatively, if turquoise wave alt.(4) has already bottomed — which we estimate as a 40% probability — then a direct breakout above $620 would suggest a shift toward a much more aggressive advance. That path would take the stock straight into magenta wave (5), completing blue wave (I) with a strong rally.
📈 Over 190 precise analyses, clear entry points, and defined Target Zones - that's what we do.

MA is below 200MAMA is showing a peak and likely to stay bearish toward the 430 level. It's currently below the 200 MA, indicating a loss of momentum.

MASTERCARD: One more dip possible but long term target is $620.Mastercard is neutral on its 1D technical outlook (RSI = 52.317, MACD = -0.060, ADX = 29.709) having just recovered its 1D MA50 following the March 13th rebound. The pattern here is a Channel Up and March's bearish wave already hit the 0.382 Fibonacci retracement level much like the previous one did on May 1st 2024. That however went on to extend the decline to close to the 0.5 Fibonacci level and hit the 1D MA200. Consequently there is a chance of one more month of slow decline to the 1D MA200 but overall, this is a good enough level to buy again for the long term and aim for the -0.382 Fib extension (TP = 620.00).
## If you like our free content follow our profile to get more daily ideas. ##
## Comments and likes are greatly appreciated. ##

MA Stock: Support at $500-$510 after short-term pullbackMA stock's short-term momentum has weakened after pulling back from its all-time high of $582.23. However, its long-term and intermediate trends are still intact. The $500–$510 range, supported by the 200-day moving average, is an important support level for keeping the intermediate uptrend. If this level holds, MA stock could reach $630–$680 by the end of 2025.

MASTERCARD: Despite the CRASH!, good graph!! Attention!!
On January 30, the American payment services provider Mastercard presented results that far exceeded forecasts.
It earned 12,874 million dollars (12,351 million euros) in 2024, 15% more than the previous year. Net income reached 28,167 million dollars (27,023 million euros), 12.2% more.
Meanwhile, operating costs reached 12,585 million dollars (12,074 million euros), 13.5% more.
Mastercard CEO Michael Miebach commented on the results: “This quarter we have achieved good results, with net income growth of 14%, or 16% without taking into account currencies.”
He continued: “Our diverse capabilities in payments and services and solutions, including the acquisition of Recorded Future this quarter, set us apart and position us well for long-term growth, as we outlined at our investor day.”
-----------------------------------------------------------------------
---> What does it look like technically?
DESPITE THE STOCK MARKET CRASH we are immersed in due to the TRADE WAR, if we look at the chart, the trend is still clearly bullish and has not yet broken ANY important support that would put it in danger, therefore, EVERYTHING INDICATES THAT WE ARE FOUND WITH A GREAT OPPORTUNITY TO GO LONG, since the market has fallen a lot and it is logical to expect an upward correction in the next few days of the SP500 index, which will logically support the rise in the price of Mastercard.
Furthermore, the price today touched the 61.8% Fibonacci and respected it (DESPITE THE CRASH), which gives us another clue that the area is respected and is possibly the floor of the next bullish impulse.
--------------------------------------
Strategy to follow:
ENTRY: We will open 2 long positions if the H4 candle closes above 553
POSITION 1 (TP1): We close the first position in the 575 area (+4%)
--> Stop Loss at 530 (-4%).
--> Ratio 1:1
POSITION 2 (TP2): We open a Trailing Stop type position.
--> Initial dynamic Stop Loss at (-4%) (coinciding with the 530 of position 1).
--> We modify the dynamic Stop Loss to (-1%) when the price reaches TP1 (575).
-------------------------------------------
SET UP EXPLANATIONS
*** How do you know which 2 long positions to open? Let's take an example: If we want to invest 2,000 euros in the stock, what we do is divide that amount by 2, and instead of opening 1 position of 2,000, we will open 2 positions of 1,000 each.
*** What is a Trailing Stop? A Trailing Stop allows a trade to continue gaining value when the market price moves in a favorable direction, but automatically closes the trade if the market price suddenly moves in an unfavorable direction by a certain distance. That certain distance is the dynamic Stop Loss.
-->Example: IF the dynamic Stop Loss is at -1%, it means that if the price drops by -1%, the position will be closed. If the price rises, the Stop Loss also rises to maintain that -1% in the rises, therefore, the risk is increasingly lower until the position becomes profitable. In this way, very strong and stable price trends can be exploited, maximizing profits.
