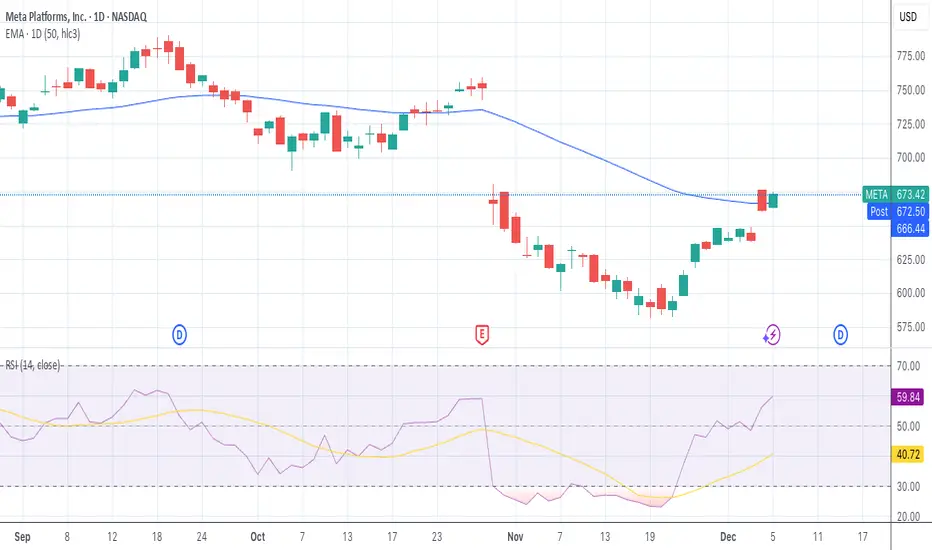
Meta came back on track ?Short Answer "Not Really"
however, the recent closing prices seem to remain below the 50‑day SMA, which suggests the trend is not clearly “recovered” yet.
In other words: there might be short‑term bullish momentum, but it’s not yet confirmed by a sustained close above the 50‑day average — the usual threshold many technicians watch.
Takeaway (technical): META seems to be in a sort of “neutral to slightly bullish long-term, but under pressure medium‑term” zone. It’s not decisively broken out — but if it climbs above and sustains above the 50‑day SMA, many technical analysts might view that as a bullish trigger.
Meta Platforms Inc Shs A Cert Deposito Arg Repr 0.041666666 Shs
No trades
Market insights
META Weekly QuantSignals Report — Bearish Bias DetectedMETA Weekly Trading Information
Ticker: META
Date: 2025-12-05
Model: QuantSignals V3 Weekly
Direction: BUY PUTS
Confidence: 58% (Medium)
Expiry: 2025-12-12 (7 days)
Strike Focus: $600
Entry Range: $0.15 – $0.17
Profit Target: $0.32
Stop Loss: $0.08
Weekly Momentum: NEUTRAL (-0.10%)
Options Flow: Bullish — PCR 0.32 (contrarian risk)
Risk Level: 🔴 HIGH (short-dated weekly / gamma risk)
⚠️ Katy vs LLM Conflict
LLM: BUY CALLS
Katy Prediction: BUY PUTS (-4.07% move)
Conflict Level: HIGH
➡️ Katy shows consistent bearish trajectory to $650.98.
🧠 Summary
META trades near weekly highs, showing MACD bearish divergence and Katy AI forecasting a steady decline through the week. Despite bullish options flow, sentiment may be overly optimistic. Best used as a small contrarian position due to high uncertainty.
Meta ( $META) Rises on New AI Publisher Deals & Key Support TestMeta Platforms (NASDAQ: META) gained fresh bullish momentum on Friday after announcing a series of high-profile AI content partnerships with major global publishers, including USA Today, CNN, Fox News, People Inc., The Daily Caller, Washington Examiner, and France’s Le Monde.
These agreements will enable Meta to feed real-time news updates into its AI chatbot ecosystem, deepening the company’s reach in the rapidly expanding AI-powered information market. While financial terms weren’t disclosed, the partnerships significantly elevate the quality, diversity, and timeliness of content available within Meta’s AI systems at a time when competition across the sector is intensifying.
The move also acts as a strategic counterbalance to headwinds surrounding mixed reception to Meta’s Llama 4 model and scaled-down spending on its metaverse ambitions. By redirecting resources toward AI assistants and core applications, Meta aims to strengthen engagement and remain competitive against rivals aggressively investing in similar publisher-driven content pipelines.
Analysts believe these partnerships could meaningfully enhance AI performance, improve user retention, and create new commercial pathways in Meta’s broader digital ecosystem.
Technical Analysis
The META chart reflects a healthy long-term bullish structure despite recent corrective pressure. Price has pulled back from the $796 high and is currently trading in the $670 region, with a deeper dip still possible.
The chart shows a rising trendline established since late 2023, currently aligning near the $580–$600 zone, which stands out as a high-probability support area. Should price retest this trendline and hold, META could rebound strongly toward the previous all-time high around $796, with potential continuation above that level upon breakout.

Waiting for correction. and then buy in declineIdeal buy price : 570
SL : 525
Target : 990, 1308
Manage your risk.
It is at trap zone. It can rise to 708 then it may be fallen to ideal price levels 570-550.
Let's see.

QuantSignals V3 META Forecast: Stay on the SidelinesMETA QuantSignals Katy 1M Prediction 2025-12-04
QuantSignals Katy AI Stock Analysis
Analyzed 1 stock(s): META
META Analysis
Current Price: $662.51
Final Prediction: $661.21 (-0.20%)
30min Target: $660.68 (-0.28%)
Trend: NEUTRAL
Confidence: 40.0%
Volatility: 113.0%
Summary: Generated 0 trade signals from 1 successful analyses out of 1 symbols.

META — Watching for a Potential GAP Closure.Hello Everyone, Followers,
META is the second one for Today.
After disappointing financial report, It created big GAP between 742 to 680 .
The GAP is still unfilled.
Then META has shown a solid rebound after weeks of heavy selling. The chart is now structured around one key element:
🔍 Chart Highlights
- Price is now broke the 631 and closed over this level. This level is now our new Support level.
- The GAP zone around 680–700 remains open and is a magnet if momentum continues.
- The long-term yellow trend support line held beautifully — buyers stepped exactly where they should.
-A push into the GAP zone is the logical next step if META holds above 630 - 631.
🔹 Outlook
- META has room to retest the GAP area near 700–720.
- A breakout above the 50 MA strengthens this scenario. (Green Line)
- A rejection could bring the price back toward 595.
🔹 My Plan
If META closes multiple days above 631, I expect continuation into the GAP region.
If it pulls back, 595 is my key support area to watch.
If you enjoy and like clean, simple analysis — follow me for more.
This is just my thinking and it is not invesment suggestion , please do not make any decision with my anaylsis.
Have a lovelly Sunday to all and Good Start a Week.
#META #SPX500 #NASDAQ

Patience pays off? Long METAI've been patient with META. I've been wanting to go long here since earnings, but I also wanted to see if we'd get closer to the lower trendline. Luckily I waited. But I'm at a point I don't want to wait longer to start my position/trade.
The reasons:
1. That lower trendline has held since October 2022. I might do something I rarely do which is set a stop loss somewhere like $530, just in case. But I think the bulls will jump back in here.
2. Look at the MACD. The last time it looked like this, Meta went on a run from $490 to about $750.
3. There's bullish divergence starting to appear in the RSI which is also oversold at 26.5
4. For the past 2 quarters, the POC is almost exactly where we are. This volume should at least slow the drop, and potentially work as a floor to bounce off of.
I'm not planning on holding this long term, but I will if I have to.
I just bought 25% of my trade and I'll DCA 3 more red days as long as it stays above the trend line. If it drops below the trendline, I'll hold and wait to see what happens with the structure.
I have 3 targes as usual:
Take Profit 1 = $650 (I think the 200day will be there) and I'll sell 50% of my position.
Take Profit 2 = $680 (there's some volume resistance there) and I'll sell 50% of my remaining position.
Take Profit 3 = $850 or if it touches the upper trendline.
Good luck!

Meta Wave Analysis – 3 December 2025
- Meta reversed from support zone
- Likely to rise to resistance level 700.00
Meta recently reversed up from the support zone between the round support level 600.00 and the support trendline of the daily Down Channel from July.
The upward reversal from this support zone started the active short-term impulse wave 1 of the intermediate impulse wave (C).
Meta can be expected to rise further to the next round resistance level 700.00 (former monthly low from July and October).

META - Weekly - Dealing With a Fibonacci LayerThe asset is currently at a crucial Fibonacci resistance layer, suggesting a near-term ceiling or range-bound trading zone, which complicates immediate price action, although the 200-day EMA appears to be the more reliable support level compared to the 100-day EMA. This technical caution is amplified by a pattern of decreased weekly volume since early 2024, mirroring the distribution phase seen before the July 2021 correction, which strongly indicates a likely, gradual correction to the $500 or potentially the $300 level. Fundamentally, the company remains robust in the long term due to strong annual net income and revenue growth, normal debt levels, and ample free cash flow and cash equivalents; however, the significant quarter-over-quarter drop in net income from Q2 2025 to Q3 2025 raises short-term skepticism about its immediate health, aligning with the bearish technical outlook for a substantial correction before the long-term fundamentals can drive the next major upswing.
Not financial advice, always do your due diligence
Leave a like👍 and/or comment💬.
We appreciate and value everyone's feedback!
- RoninAITrader

META — WEEK 49 TREND REPORTNASDAQ:META — WEEK 49 TREND REPORT
Ticker: NASDAQ:META — 12/02/2025 @ 647.10$
Timeframe: WEEKLY
This is a reactive structural classification of NASDAQ:META based on the weekly chart as of this timestamp. Price conditions are evaluated as they stand — nothing here is predictive or forward-assumptive.
⸻
1) Current Trend Condition
• Trend Duration: +9 weeks (Bearish)
• Trend Reversal Level (Bullish): 670.20$
• Trend Reversal Level (Bullish Confirmation): 688.75$
• Pullback Support: 645.90$
• Correction Support: 525.73$
⸻
2) Structure Health
• Retracement Phase:
Correction (approaching 61.8%)
• Position Status:
Unstable (price below both structural layers)
⸻
3) Temperature :
Cooling Phase
⸻
4) Momentum :
Bearish
⸻
5) Market Sentiment
Bearish
⸻
Author’s Note
This analysis is fully reactive, not predictive. Market conditions, trend structure, and behavior are classified as they appear in real time. The objective is to identify where directional shifts first occurred, where structural integrity remains intact, and where it would begin to weaken if key levels were breached.
Predictive analysis projects outcomes that do not exist yet. Without price confirmation, prediction is built on baseless assumptions. This framework avoids that entirely by responding only to verified structural changes and live conditions.
The levels shown simply identify where the current trend structure first shifted and where it would begin to lose integrity if breached. Recognizing these boundaries allows for clearer interpretation of market behavior without relying on forward guarantees, speculative projections, or unsupported assumptions.
⸻
Methodology Overview
This classification framework evaluates directional conditions using internal trend-interpretation logic that references price behavior relative to its structural layers. These relationships are used to identify when price movement aligns with the framework’s criteria for directional phases, transition points, or regime shifts. Visual elements or structural labels reflect these internal interpretations, rather than explicit trading signals or preset indicator crossovers. This framework is observational only and does not imply future outcomes.

The Impact of a Global Market Crash1. Economic Impact
The immediate economic consequences of a global market crash are often severe. Equity markets, commodity markets, and bond markets typically experience significant declines, undermining investor wealth and reducing consumer confidence. As stock prices plummet, households and businesses see a decline in their net worth, which can lead to reduced spending and investment. Since consumption and capital investment are core drivers of economic growth, the contraction in these areas can trigger a broader economic slowdown or even a recession.
A crash can also cause a tightening of credit conditions. Banks and financial institutions, facing losses on their investments and worried about counterparty risk, often become more risk-averse, reducing lending to businesses and consumers. This credit contraction further slows economic activity, as companies find it difficult to finance operations or expansion, and households struggle to secure loans for major purchases like homes and vehicles.
2. Impact on Financial Institutions
Financial institutions are directly impacted by a market crash, as the value of their holdings in equities, bonds, derivatives, and other financial instruments decline. Banks, hedge funds, insurance companies, and investment firms may incur massive losses, potentially leading to insolvency or bankruptcy. The interconnected nature of global finance means that the failure of one major institution can have a domino effect, threatening the stability of other financial entities. The 2008 global financial crisis exemplifies this, where the collapse of Lehman Brothers triggered panic across the banking sector and required coordinated government interventions.
Moreover, liquidity crises often accompany market crashes. When investors rush to sell assets, the markets may not have enough buyers, causing asset prices to fall even further. Financial institutions that rely on short-term funding or that have leveraged positions may find themselves unable to meet obligations, further exacerbating systemic risks.
3. Impact on Businesses
The effect of a global market crash extends beyond the financial sector into real-world business operations. Companies face declining stock prices, reduced access to capital, and a contraction in consumer demand. Many firms may be forced to delay expansion plans, cut costs, or lay off employees to preserve cash flow. Industries heavily reliant on discretionary spending, such as travel, luxury goods, and automobiles, are particularly vulnerable.
Global supply chains may also be disrupted. Firms may reduce production in response to decreased demand, which can create ripple effects across suppliers and manufacturers worldwide. Additionally, companies engaged in international trade may face currency volatility and reduced foreign investment, compounding the financial strain.
4. Impact on Governments and Fiscal Policy
Governments are not immune to the effects of a global market crash. Falling asset prices reduce tax revenues from capital gains, corporate profits, and wealth taxes. Lower revenues combined with increased public spending to stimulate the economy can strain government budgets and increase fiscal deficits. Governments may be forced to implement stimulus measures, such as interest rate cuts, quantitative easing, or direct fiscal support, to stabilize markets and prevent a deeper recession.
Central banks often play a critical role during a market crash, using monetary policy tools to provide liquidity, stabilize financial institutions, and encourage lending. However, prolonged crises may limit the effectiveness of these measures, especially if investor and consumer confidence remains low. Additionally, countries with high debt levels or weak economic fundamentals may face challenges in implementing effective countermeasures.
5. Impact on Investors and Households
Individual investors often experience significant financial losses during a global market crash. Retirement savings, investment portfolios, and other forms of personal wealth can erode rapidly, affecting long-term financial security. Panic selling is common, leading to further declines in asset prices. Investors with leveraged positions or exposure to high-risk assets may face margin calls or forced liquidation, amplifying losses.
Households may also experience indirect effects, such as rising unemployment, reduced wages, and limited access to credit. Economic uncertainty can lead to changes in consumption patterns, with families prioritizing essential spending and reducing discretionary expenditures. This reduction in consumption can feed back into the broader economic slowdown, creating a cycle of declining demand and increasing financial stress.
6. Global Trade and Investment
A market crash in one region can quickly spread to others due to globalization and financial interconnectedness. Capital flows may reverse, with foreign investors withdrawing from emerging markets to seek safety in developed economies, causing currency depreciation and financial instability in affected countries. International trade can decline as businesses postpone investment, and demand for imported goods falls. Cross-border investments and mergers may be canceled or delayed, reducing economic growth opportunities and increasing geopolitical tensions.
7. Psychological and Social Impact
Beyond tangible financial consequences, a global market crash can have significant psychological and social effects. Investor confidence and public sentiment often deteriorate, leading to fear-driven behavior in both markets and daily life. Anxiety about job security, savings, and retirement can influence consumer behavior, affecting spending and investment decisions. In severe cases, prolonged economic hardship can exacerbate social inequalities, trigger political unrest, and challenge social cohesion.
8. Long-Term Consequences and Recovery
The recovery from a global market crash can take months or even years, depending on the underlying causes and policy responses. Market crashes often prompt regulatory reforms aimed at strengthening financial systems and reducing systemic risks. For example, the 2008 financial crisis led to significant changes in banking regulation, risk management practices, and global oversight mechanisms.
However, repeated or prolonged market crashes can erode trust in financial institutions, government policy, and market mechanisms. Investors may become more risk-averse, reducing the flow of capital to businesses and slowing economic innovation. Long-term structural unemployment, reduced income growth, and increased debt burdens can persist well beyond the initial crash period.
9. Mitigation Strategies
While the effects of a global market crash are profound, there are strategies to mitigate risks and cushion the impact. Diversification of investment portfolios across asset classes, sectors, and geographies can reduce exposure to systemic shocks. Governments and central banks can implement preemptive regulatory and monetary measures to ensure liquidity and maintain financial stability. For businesses, maintaining strong balance sheets, prudent debt levels, and flexible operational strategies can enhance resilience.
Education and awareness are equally important. Investors who understand market cycles and maintain long-term investment perspectives are less likely to engage in panic selling, preserving wealth and contributing to overall market stability.
Conclusion
A global market crash is more than just a financial phenomenon—it is an economic, social, and psychological event with far-reaching consequences. From financial institutions to households, from governments to multinational corporations, the impact is pervasive, highlighting the interconnectedness of modern economies. While market crashes are inevitable over time due to economic cycles and external shocks, their severity and duration can be influenced by effective policy responses, prudent financial management, and a resilient global economic system. Understanding these impacts is crucial for investors, policymakers, and businesses alike, helping to navigate crises, protect wealth, and foster sustainable recovery.

META — Setting Up for a Potential 50% Upside?META (Weekly Chart) is showing a strong technical setup after a healthy multi-week correction. Price has bounced exactly from the long-term rising trendline + 100-WMA zone — a region that has historically acted as a strong accumulation area.
🔍 Key Bullish Signals
Bullish candle forming near structural support, indicating buyers stepping in.
Price holding above major MAs: 100W, and 200W → long-term trend intact.
MACD flattening near zero-line, often a precursor to a fresh weekly bullish crossover.
A bounce from the current trendline opens room to the next Fibonacci cluster at
~$980–$1,000, which is approximately +50% from current levels.
🎯 Upside Projection
Current Price: ~$648
Potential Target (Fib 2.618 extension): ~$990
➡️ Estimated Upside: ~50%
If META confirms a weekly close above the current range resistance, the path toward higher Fib zones becomes technically valid.

META QuantSignals V3 | Moderate Risk alretMETA Swing Signal — (2025-11-28)
Instrument: META
Direction: BUY CALLS 📈
Confidence: 60% (Medium)
Horizon / Expiry: 14 days → 2025-12-12
Strike Focus: $650.00
Entry Range: $12.50 – $13.50 (mid $13.00)
Target 1: $19.00 (+50%)
Target 2: $25.00 (+100%)
Stop Loss: $8.50 (-35%)
Position Size: 3% of portfolio
Risk Level: Moderate — sector volatility and mixed technical signals
Katy AI Signal
Bullish prediction targeting $680–$700 in 14 days
Strong AI sector momentum and technical breakout potential
Katy LLM Conflict: LLM recommended CALLS, but Katy chart shows PUTS (-8.40% predicted) — medium confidence
Technical Context
Current Price: $645.62 (near session high $646.25, above VWAP $606.50)
Support: $600–$610
Resistance: $650–$660
Momentum: Bullish after 6.93% intraday gain
Market Context: STRONG_BULLISH overall; SPY & QQQ bullish
Options Flow
Put/Call Ratio 0.73 → bullish sentiment
Some hedging at $730 put, but overall call buying interest
Neutral flow bias, supports potential upside
Trade Setup & Strategy
Why This Trade: Captures AI sector momentum in large-cap tech swing play
Timing Advantage: Enter after significant intraday gain; aligns with continuation pattern
META – Weekly Chart📈 META – Weekly Chart Overview
A technical rebound may be starting to form.
Several signals from The Wave system are aligning:
✅ Price in the buy zone
META has retraced into a historically strong demand area, perfectly overlapping with the Wave buy signal zone.
This region has acted as a springboard multiple times in the past.
✅ Undervaluation on higher timeframes
The stock is currently trading near its dynamic trendline support, combined with oversold readings on momentum indicators.
This suggests the correction might be approaching exhaustion.
✅ Momentum turning
The stochastic is bottoming out exactly where previous weekly reversals occurred.
RSI also shows early signs of stabilisation.
🎯 Potential scenario
If buyers step in from this level, META could aim for the upper resistance area marked on the chart, offering an attractive risk-to-reward of 3.3 — a favourable setup for medium-term swing traders.
🛑 Invalidation
A clean break below the SL area would shift the structure and invalidate the bullish setup.
This is a textbook example of waiting for high-probability zones rather than chasing the price, discipline always pays.

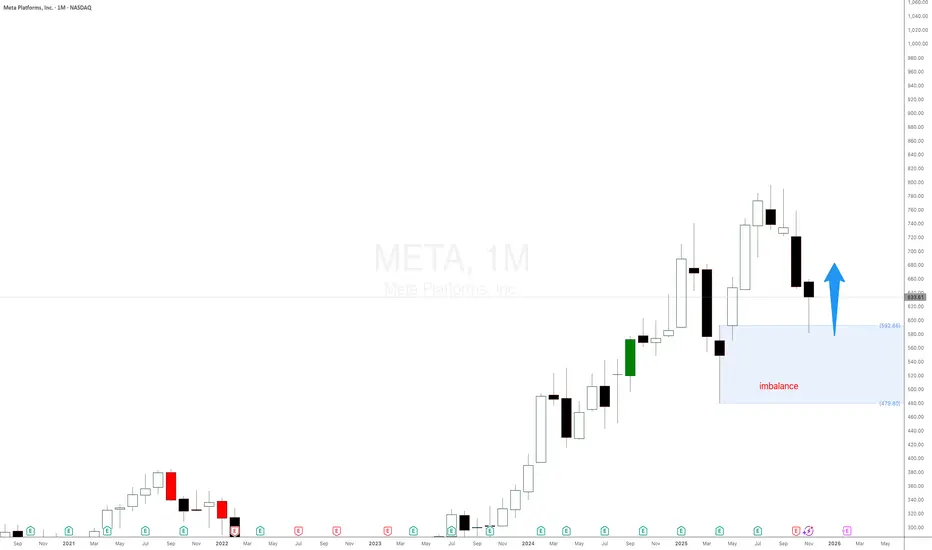
Meta Plafforms stock $META is exploding as expectedMETA Platforms NASDAQ:META is reacting nicely to the monthly demand imbalance at $592 as mentioned in the last update. Using pure supply and demand price action. META’s big drop was predictable from the monthly and weekly imbalances, and how the current reaction was part of the plan all along. Expecting a decent rally.
looking good this bouncemaybe if NVDA dips a bit with google, the money rotates to Meta, time will tell

QuantSignals V3: META Lacks Sufficient Momentum for TradeMETA QuantSignals Katy 1M Prediction 2025-11-26
Ticker: META
Signal Type: QuantSignals Katy 1M
Date: 2025-11-26
🔍 Analysis Summary
Current Price: $636.90
Final Prediction: $636.00 (-0.14%)
30min Target: $637.62 (+0.11%)
Trend: NEUTRAL
Confidence: 42.4% (Below trade threshold)
Volatility: 12.6%
⚠️ Trade Signal
No trade signal generated
Reason: Insufficient confidence and insufficient move size
Market shows flat momentum with tight trading range.
📌 Summary
0 trade signals generated from 1 analysis.
Recommendation: Wait for stronger trend or higher confidence before entering a trade.

Nasdaq Rallies into Thanksgiving, Meta Bounce Kicks InWall Street sentiment has perked up on renewed Fed cut bets, with the Nasdaq leading the way. This has allowed Facebook to finally rally from support levels I highlighted 3 weeks ago.
Matt Simpson, Market Analyst at City Index.

META’s Run Today Was Strong — Watching These Levels for Nov 26
META had one of the cleaner intraday trends today. The move off the morning base was almost textbook: steady higher highs, shallow pullbacks, and candles riding right along that rising trendline you drew on the 15-minute chart. Whenever you get a move that smooth, it usually means the order flow is very one-sided — and judging by the absence of deep pullbacks, buyers were the ones in control all day.
But after that last push into the 635–637 zone, the pace changed. The candles started flattening out, and META began drifting sideways right under resistance. That’s usually where the market takes a breath and waits for new orders to come in. The trend is still intact — nothing about the structure looks weak — but the last few candles clearly show hesitation near the top of the day’s range.
Let heck the 1-hour GEX chart below, the hesitation makes sense. The entire area above 637 is loaded with call walls. You’ve got multiple levels stacked between 640, 645, and then 650. When price runs into heavy GEX resistance like that, it often slows down because market makers start hedging the other way. It doesn’t mean META is bearish — it just means it needs real momentum or volume to break through those overhead layers.
Below price, META actually has a pretty friendly GEX landscape. There’s solid put support around the 615–620 zone, and a deeper cushion around 592 if the market ever decides to do a full reset. That lower band is why META rarely dipped today — option structure was keeping a floor beneath it.
Going into Nov 26, the levels are straightforward:
If META can break through 637 with a decisive candle — not just a wick — then 640 becomes the next magnet. And if the stock gets enough push to chew through that, the next meaningful level is 645. That’s where the thicker call wall sits.
If META slips back under 630 and stays there, we probably see a cleaner pullback into 625 or even 620 just to cool the trend. That’s the zone where buyers likely step back in, since it lines up with both intraday structure and GEX support.
Option Trading Plan
Calls only make sense if META can actually get a clean break over 637. That’s where the air pocket sits. Between 637 and 640, META usually moves fast because there’s less hedging friction.
Puts don’t make sense unless price loses 630 with conviction. Below that, 625 and 620 become natural targets. Above 630, put premiums will get eaten alive because the overall GEX structure still favors the long side.
Disclaimer
This is just my personal view based on chart behavior and options data. It’s not financial advice — always trade your own plan and manage your risk.

LONG META ~630 - TARGETING 730-750After the stock took a major hit driven by a one-time tax charge, we could see the buyers decided to come in at ~600 level, the stock was bought the whole trading day of Nov 25th, and we can see it is turning into a bullish pattern.
RR is very good here and this potentially could lead to a huge move upwards.
Target price should be previous local highs - 740-750 (Feb/Jun/Oct)
Stop should be placed bellow 600 price level, and lose of that level should signal that this was a false move.
This move can lead to a 15-18% uptrend.
BH

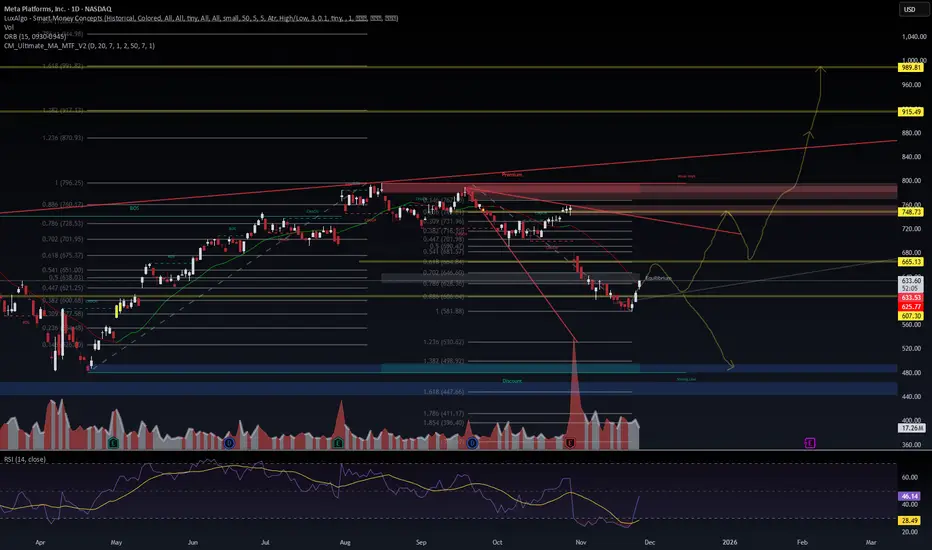
$META — Still Tracking This Path (VolanX Watchlist)I am watching this. 📌 Price: 633.20
Price reacted exactly at the HTF equilibrium zone — classic mid-range fight.
Structure still favors a two-path scenario:
Bull Path: Hold 625–630 → reclaim 665 → expansion toward 748 liquidity pocket, then continuation toward 915 and 989 HTF targets.
Bear Path: Reject 665 → slip under 607 → liquidity sweep into 530 → 480 discount block.
Trendline compression + falling wedge behavior is forming, but not confirmed until 665 breaks.
RSI recovering from deep discount territory — momentum is shifting, but still fragile.
🎯 Watching:
The 665 reclaim or rejection — this is the decision point that chooses the Y-path.
⚙️ VolanX DSS Notes:
Transition signal present but not confirmed.
LRG still treating this as a reactive bounce, not a full reversal yet.
📚 Reference: Liquidity-based equilibrium concepts emphasize premium/discount mapping and liquidity draw mechanics (ICT, 2023).
META Stock Tip LongHere is our stock signal for NASDAQ:META
Meta Stock Signal
🎉Entry: 597.13
⚠️SL: 482.50
✔️TP1: 732.42
✔️TP2: 911.95
✔️TP3: 1134.37
Don't forget, if you are on a challenge/funded you can trade main stocks
Hope all of our friends in USA have a good holiday
Best
ETAforex

Too Late to Buy Meta stock?META just reached the monthly demand imbalance at $592 and is reacting as expected using pure supply and demand price action. In this video, I show how META’s big drop was predictable from the monthly and weekly imbalances, and how the current reaction was part of the plan all along. Expecting a decent rally.
