Meta 4 hr timeframe is too oversold , Macd on the monthly looks horrible it crossed bearish I think meta pull back a little bit then continue the downtrend no reason for a bullish reversal but only a small pullback do to being way to oversold
Trade ideas

Meta Buy Cycle Meta
Midterm buy cycle
TP 794.75
% bubble ratio
Currently in a negative bubble with fair value at 795
Spot entry plan:
Entry at bubble ratios -30% -40% & -50%
TP 794.75
Time capacity August 2026

META watch $634-641: Semi-Major Support may hold Earnings DUMP META apparently disappointed with its last earnings report.
Approaching a "Semi-Major" support zone at $634.32-641.88
Look for a clean bounce or look lower like $600 for next try.
.
This is a followup to my TOP CALL given by Dual Goldens:
Hit BOOST and FOLLOW for more such PRECISE and TIMELY charts.
========================================================

META Great opportunity for longs, target to 1000
For Swing or Options Tradersw w/ at least 12 month expiration:
Surprise bear bar with follow-up, expect a few legs lower, expect a typical bottom wedge near left shoulder
Great consolidation zone ~ 600, also Big Round Number = magnet
Near 100 weekly EMA, needs to re-test that
Near Trendline of Bull Channel
Target: Long-term Measured move from 600 to 800 leads to 1000

META Buy Opportunity – KZDZ ModelMETA Game Plan – KZDZ Model
📊 Market Sentiment
On 29/10, the FED lowered rates by 25BPS, as expected. However, Powell’s remarks added uncertainty around further cuts in December, stating that future decisions will be data-dependent.
One FED member dissented, preferring no cut this cycle — a notable shift from September’s unanimous decision.
Following this, rate-cut expectations dropped from 95% to 68%, sparking short-term bearish sentiment as traders took profits and hedged exposure.
Despite this volatility, the mid-to-long term outlook remains bullish given the broader liquidity cycle and easing policy stance.
📈 Fundamental
META earnings missed expectations, triggering a sharp sell-off. While short-term sentiment is bearish, the long-term outlook remains supported by ongoing AI development initiatives.
📈 Technical Analysis
1-Hit oversold RSI on the daily timeframe.
2-Retraced to the 0.5 Fibonacci equilibrium zone (≈ $640).
3-Tested a major HTF Key Zone around $625, signaling potential accumulation.
📘 Model in Use – Key Zone with Discount Zone (KZDZ Model)
The KZDZ Model identifies areas where discounted Fibonacci levels align with strong HTF liquidity zones, offering high-probability reversal opportunities.
1️⃣ Identify HTF Key Zone
2️⃣ Align with Discount Zone (0.5–0.75 range)
3️⃣ Look for confirmation structure on LTF
4️⃣ Execute and manage risk accordingly
📌 Game Plan
Scenario 1 (Black Path): Watch for price to hit $625 and close above $640 (daily). Upon confirmation, plan to buy C640 options targeting $680–$700.
Scenario 2 (Red Path): If price fails to reclaim $640, monitor for a deeper move to $560, then look for weekly rejection above that zone. Entry via C560 options, targeting $620–$700.
🎯 Setup Trigger
Scenario 1 → Daily close above $640 after retesting $625.
Scenario 2 → Weekly close above $560 zone.
📋 Trade Management
Scenario 1: Buy C640 Calls → take profits at $680–$700.
Scenario 2: Buy C560 Calls → partial profits $620–$640, rest at $680–$700.
Move stop to breakeven after first target is hit.
💬If this META breakdown supports your outlook, like, comment, and follow.
For deeper sentiment and strategy updates, subscribe to my Substack free access available.
⚠️ This analysis is for educational purposes only and does not constitute financial advice. Always conduct your own research before trading or investing.

The META drop explainedSo what happend to META last week:
I see a lot of you wondering what happend to the stock and what caused the drop.
The answer is simple. The EPS was not so good.
We can see on the chart that the EPS is only 1.05 and that they expected 6.723 . That is a chance of -84.38%.
So for that big of a chance this is a small drop.
The Reason:
So the reason that this happend is because they need to pay some extra in taxes.
The tax that they need to pay is around 15,9 billion dollar.
This is because Trump has passed some tax laws that state that big companies need to pay taxes on profits that they have made outside of the US.
This is only a one time tax that they need to pay and the reason that they are doing this is because they want to avoid companies to do tax evation and book more profits outside of the US.
What we also do need to know is that made up profits outside of the US are being re-evaluated and that they need to pay tax on a portion of that profit because the see a portion of it as domestic assets.
What we need to keep in mind:
What we need to keep in mind here is that the EPS only dropped because of this tax and that there are people saying that the EPS without this tax would have been around 7.25 . So a good boost from what the analysist are expecting of META.
So you could see this as a big discount you get on the stock price.
Types of Arbitrage Strategies in Global ExchangesIntroduction
In global financial markets, arbitrage represents the pursuit of risk-free or low-risk profits by exploiting price discrepancies between different markets, instruments, or timeframes. Traders, institutions, and algorithmic systems constantly monitor global exchanges for such inefficiencies. While arbitrage opportunities may exist only for a fraction of a second, the principle behind them remains timeless — buy low, sell high, but simultaneously and strategically.
Arbitrage is vital for ensuring market efficiency, liquidity, and fair pricing across borders. As global trading platforms become more interconnected, arbitrage has evolved from simple manual trades to complex algorithmic and statistical models involving multiple asset classes, currencies, and derivatives.
This article explores the major types of arbitrage strategies practiced in global exchanges, their mechanisms, challenges, and significance in modern markets.
1. Pure or Spatial Arbitrage
Pure arbitrage, also known as spatial arbitrage, is the most fundamental form. It occurs when an asset trades at different prices in two or more markets at the same time. The trader buys the asset from the cheaper market and sells it in the more expensive one.
Example:
If gold futures are trading at $2,000 per ounce on the New York Mercantile Exchange (NYMEX) and at $2,010 on the London Metal Exchange (LME), an arbitrageur can buy gold on NYMEX and sell simultaneously on LME to earn a $10 per ounce profit, excluding transaction costs.
Markets Where It Occurs:
Equities: Dual-listed stocks (e.g., Royal Dutch Shell listed in London and Amsterdam).
Commodities: Gold, oil, or agricultural commodities traded on multiple exchanges.
Currencies: Foreign exchange markets across different trading hubs like London, New York, and Tokyo.
Significance:
Pure arbitrage enforces price parity across exchanges and enhances market integration.
2. Statistical Arbitrage
Statistical arbitrage (StatArb) uses quantitative models and algorithms to identify pricing inefficiencies between related securities. Rather than relying on clear price differences, it depends on statistical correlations and mean-reversion principles.
Key Features:
Uses mathematical models, machine learning, and historical data.
Exploits temporary mispricings in correlated assets.
Positions are typically short-term and high-frequency.
Example:
If two historically correlated stocks like Coca-Cola (KO) and PepsiCo (PEP) diverge abnormally in price, a trader may go long on the undervalued one and short on the overvalued one, expecting convergence.
Used By:
Hedge funds (like Renaissance Technologies)
Quantitative trading firms
High-frequency traders
Benefits:
Works even in balanced markets (without visible price gaps)
High automation potential
Risks:
Model inaccuracy
Breakdown of historical correlations during volatile periods
3. Triangular Arbitrage (Currency Arbitrage)
Triangular arbitrage occurs in the foreign exchange (forex) markets when discrepancies arise between three related currency pairs.
Mechanism:
Traders exploit the mispricing among three currencies by converting them sequentially to lock in a profit, ensuring that the cross-exchange rates are consistent.
Example:
Assume:
EUR/USD = 1.2000
USD/GBP = 0.8000
EUR/GBP = 0.9600
The implied EUR/GBP rate should be (1.2000 × 0.8000 = 0.9600).
If the actual EUR/GBP rate is 0.9650, the trader can buy the undervalued currency and sell the overvalued combination, earning a small profit per cycle.
Significance:
Triangular arbitrage keeps exchange rates aligned across currency pairs in global forex markets. It also showcases the law of one price, ensuring consistent valuation across all trading hubs.
4. Index Arbitrage
Index arbitrage involves exploiting price discrepancies between a stock index and its constituent stocks or between the index futures and spot index.
Example:
If the S&P 500 futures are trading above the theoretical value implied by the underlying cash index, a trader can:
Sell futures
Buy all component stocks of the index
As the prices converge, the arbitrageur closes the positions, realizing a profit.
Technology Used:
Algorithmic trading platforms capable of executing thousands of trades within milliseconds to manage all underlying index components simultaneously.
Benefits:
Helps maintain equilibrium between the derivative and spot markets
Improves efficiency in index pricing
Challenges:
Requires high capital
Needs automated execution and low latency infrastructure
5. Merger or Risk Arbitrage
Merger arbitrage, also known as risk arbitrage, focuses on the price difference between the current market price of a company being acquired and the proposed acquisition price.
Mechanism:
When Company A announces plans to acquire Company B for $50 per share, but Company B’s stock trades at $47, the $3 difference reflects deal risk.
Arbitrageurs buy Company B’s shares expecting the deal to close and pocket the $3 gain when it does.
Types of Deals:
Cash mergers – Fixed payout, lower risk
Stock-for-stock mergers – Complex due to share exchange ratios and market volatility
Risks:
Deal may fail due to regulatory issues or financing problems
Delays can reduce annualized returns
Example:
During Microsoft’s acquisition of Activision Blizzard, risk arbitrage funds took long positions in Activision anticipating the regulatory approval would lead to price convergence with the offer.
6. Convertible Bond Arbitrage
Convertible bond arbitrage exploits mispricing between a company’s convertible bonds and its underlying stock.
Mechanism:
A convertible bond can be exchanged for equity at a preset conversion rate.
If the bond is undervalued relative to the stock, traders go long the bond and short the stock.
The strategy profits from bond yield and volatility adjustments, regardless of stock direction.
Used By:
Hedge funds specializing in credit and volatility markets.
Risks:
Credit risk of issuer
Interest rate changes
Liquidity risk in bond markets
Significance:
Balances pricing between equity and fixed-income instruments of the same issuer, enhancing cross-asset efficiency.
7. Cross-Border Arbitrage
Cross-border arbitrage involves exploiting price differences for the same asset or similar assets across different countries’ exchanges.
Example:
A stock listed in both the New York Stock Exchange (NYSE) and the Tokyo Stock Exchange (TSE) may trade at slightly different prices due to exchange rate fluctuations or trading hour differences. Traders use ADR (American Depositary Receipts) and GDR (Global Depositary Receipts) to execute such arbitrage.
Factors Affecting Prices:
Exchange rates
Tax policies
Market liquidity
Capital controls
Importance:
Encourages global price synchronization and helps maintain efficient capital allocation across regions.
8. ETF Arbitrage
Exchange-Traded Funds (ETFs) track indices or baskets of assets. When an ETF’s market price deviates from its Net Asset Value (NAV), arbitrage opportunities arise.
Mechanism:
If ETF price > NAV → Sell ETF, buy underlying assets.
If ETF price < NAV → Buy ETF, sell underlying assets.
Example:
If the SPDR S&P 500 ETF (SPY) trades at $501 while the index value is equivalent to $500, an arbitrageur sells SPY and buys the basket of S&P 500 stocks.
Who Performs It:
Authorized Participants (APs) such as large financial institutions that can create or redeem ETF shares in bulk.
Outcome:
Maintains price parity between ETFs and their underlying assets, ensuring accurate tracking performance.
9. Futures Arbitrage (Cash and Carry)
Cash and carry arbitrage involves exploiting differences between the spot price of an asset and its futures price.
Mechanism:
When futures are overpriced relative to spot, traders short futures and buy spot.
When futures are underpriced, they buy futures and short spot.
Example:
If crude oil trades at $80 (spot) and the 3-month futures are at $85, a trader can buy oil at $80, store it, and sell the futures at $85, locking in a risk-free return (adjusted for carrying costs).
Applications:
Common in commodities, currencies, and equity indices.
Impact:
Ensures futures contracts remain aligned with their underlying assets, enforcing cost-of-carry relationships.
10. Options Arbitrage
Options offer several arbitrage setups based on pricing inconsistencies between options and their underlying assets.
Common Strategies:
Put-Call Parity Arbitrage: Exploits violations of the relationship between call, put, and underlying asset prices.
Box Spread Arbitrage: Combines options to lock in a risk-free payoff.
Reverse Conversion Arbitrage: Uses options and underlying stock to capture overpricing in call or put options.
Example:
If put-call parity is violated (Call – Put ≠ Stock Price – Present Value of Strike), arbitrageurs construct synthetic positions to earn the difference.
Benefit:
Enhances derivative market efficiency and volatility pricing accuracy.
11. Cross-Asset Arbitrage
Cross-asset arbitrage identifies pricing inefficiencies across different asset classes such as equities, bonds, commodities, and derivatives.
Example:
When the movement in the oil market affects airline stock prices disproportionately, arbitrageurs may exploit the imbalance using statistical models.
Importance:
Promotes multi-market integration
Encourages price alignment across sectors
Helps in portfolio hedging and diversification
12. High-Frequency and Algorithmic Arbitrage
Modern arbitrage strategies rely heavily on high-frequency trading (HFT) and algorithmic systems capable of executing trades in microseconds.
Techniques Include:
Latency arbitrage (profiting from speed differences between exchanges)
Quote stuffing and order book imbalances
Cross-exchange liquidity scanning
Infrastructure Needs:
Co-location servers near exchange data centers
Low-latency networks
Advanced AI models for predictive execution
Impact:
Enhances liquidity and efficiency
Reduces price gaps
But also raises concerns about market fairness and flash crashes
Conclusion
Arbitrage is the heartbeat of global financial efficiency. From simple cross-market trades to complex algorithmic models, each type of arbitrage contributes to price uniformity, market liquidity, and systemic stability. While profit margins per trade are razor-thin, large-scale institutional participation and automation make it an essential function in maintaining balance across global exchanges.
However, with evolving technology, regulation, and competition, arbitrage has transitioned from being a manual opportunity to a data-driven discipline. Traders who understand not only the price discrepancies but also the structure of global markets, latency, and cross-asset relationships hold the edge in today’s interconnected world.
In essence, arbitrage ensures that no asset remains mispriced for long — making global markets fairer, more integrated, and efficient for all participants.
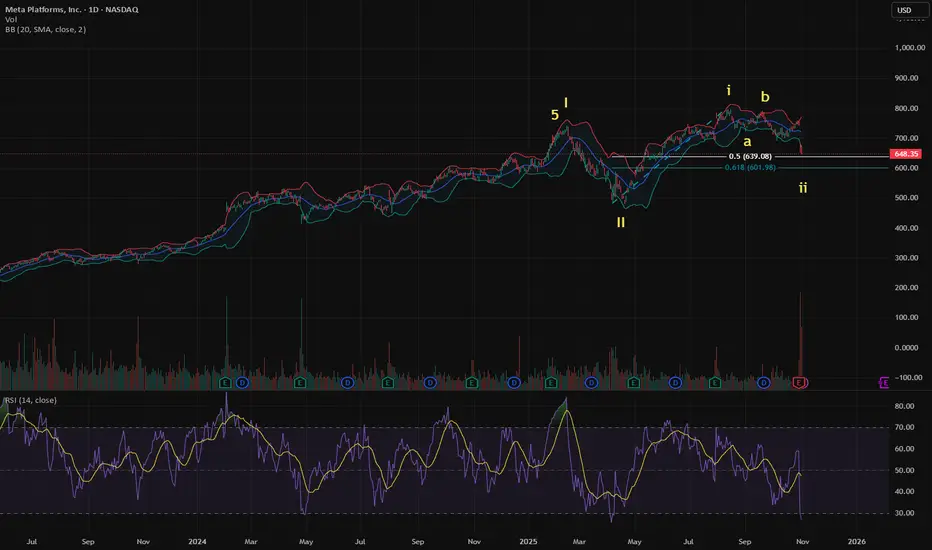
Meta long Meta dumped on earnings because of a one time tax event. I have long been following this company and have missed obvious setups multiple times. We are right at the .5 fib. This megaphone was drawn on the monthly chart but I zoomed in to show the swing trade setup I am looking at.
We note a basing OBV (momentum) and a nice reset of volatility. My plan would be to enter around here, average down if we approach 600$ and swing up to the green price target.

$FB: Wave 2 in progressNASDAQ:META completed a 5-wave sequence in Feb. 2025. From April 2025 low, NASDAQ:META started a new 5-wave sequence. Wave 1 is complete and we've been in Wave 2 since the ATH.
I believe NASDAQ:META is presently in the last leg of Wave 2 -- Wave c. It's hard to tell when this C wave will complete. Perhaps there will be a positive divergence when Wave 2 completes.
META — Possible Macro Peak, Bearish Year AheadMeta may have completed its long-term C wave after reaching new all-time highs at the top of the macro channel.
The structure now shows emerging bearish sequences on lower timeframes , hinting that the next yearly cycle could be corrective or bearish rather than impulsive.
While the theoretical WCL sits far below (around 350–400), such a deep retracement would imply a 50% drop — an extreme but technical possibility.
A more realistic path could be a 20–30% macro correction as the market digests Meta’s extended rally and rebalances valuation.
Key Points:
Macro C wave completed at the upper channel boundary.
Lower timeframe sequences turning bearish.
WCL remains the ultimate downside target, though not the base case.
Expect a potentially bearish or corrective year ahead for Meta, within the long-term bullish structure.
Invalidation:
If price reclaims the 780–800 zone and breaks above the red B high, bearish structure fails.

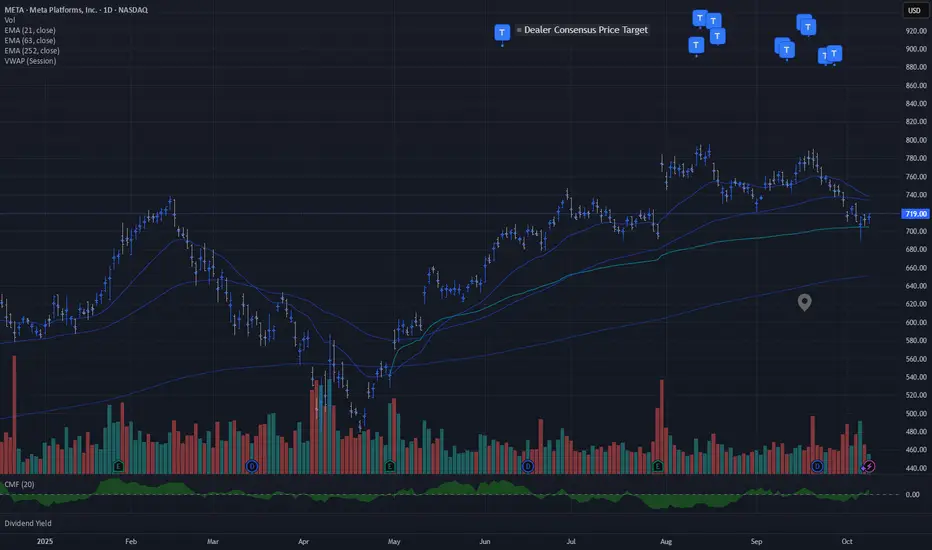
META | Constructive VWAP Support + Dealer Consensus PullWatch for follow through from Anchored VWAP Support while positive dealer pricing pressure remains intact.
META | Descending Channel & 0.618 Fib SupportMETA is trading inside a descending channel after breaking its main uptrend. Price recently rejected the upper boundary with strong sell volume and a bearish MACD crossover, showing short-term weakness.
The 0.5 Fibonacci level is acting as current support — if price breaks below this, expect a retrace toward the 0.618 Fib zone ($400–$405) which aligns with key channel support. Holding this level could trigger a rebound toward $450–$470, but a close below $400 opens the door to $380–$360.
RSI is near oversold, suggesting a potential bounce if the 0.618 level holds. Medium-term correction within a larger bullish structure.
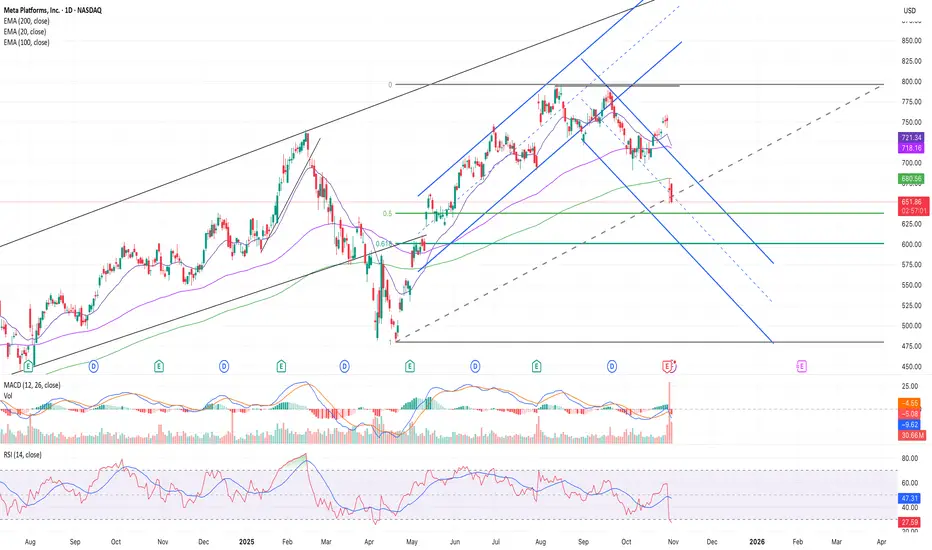
META Bearish: Channel Breakdown Toward 630META on 1D is digesting a sharp pullback from the ~$790 high into a descending channel. Price found initial demand near $666 but remains below the MA20 and mid-band, keeping short-term momentum bearish while the higher-timeframe uptrend stays intact. Until the upper channel gives way, rallies into the MA20/upper boundary are likely to meet supply.
Primary path: I’m respecting the channel. A daily close below $660 would confirm continuation, opening $630 as the first objective; if pressure accelerates, $600 sits next. The setup is cleaner while price stays capped beneath $685 (short invalidation). Failure to reclaim the MA20 keeps the lower band “walk” in play and favors selling into strength.
Alternative: If buyers punch through the upper channel and reclaim the MA20 with a decisive daily close above ~$720, the short-term tone flips. That unlocks a squeeze toward ~$740 and, if momentum persists, a run back into the prior supply near ~$790. For dip buyers, the $666 area is the near-term demand to defend; lose it on a close and the bearish case resumes.
Levels to watch: Demand near $666; resistance at ~$720 (upper channel/MA20) and ~$790 (ATH). Triggers: bear—daily close < $660 to target $630/$600; bull—daily close > $720 to target $740/$790. Invalidation for shorts: daily close > $685.
This is a study, not financial advice. Manage risk and invalidations.

Meta Platforms (META) shares plunge 11%Meta Platforms (META) shares plunge 11%
On Wednesday, Meta Platforms (META) released its quarterly report, which included several positive highlights:
→ revenue rose to $51.2 billion (forecast: $49.5 billion);
→ the size of the daily active audience increased to 3.54 billion people.
However, META’s share price fell below the psychological threshold of $700, hitting its lowest level in almost five months. This drop was triggered by two unpleasant surprises revealed in the report.
Tax write-offs
According to media reports, due to new US tax legislation (referred to as the “One Big Beautiful Bill Act”), the company recorded a one-off income tax expense of $15.93 billion.
Because of this write-off, earnings per share (EPS) came in at $1.05 (analysts had expected $6.72). However, the company clarified that excluding this one-off item, EPS would have been $7.25, which would have been a very strong result.
AI-related expenses
Another factor that may have alarmed shareholders is that Mark Zuckerberg’s company raised its capital expenditure forecast for 2025 to $70–72 billion. These funds will go towards building data centres and purchasing AI chips.
In essence, Meta Platforms is striving to take a leading position in the AI space and is prepared to spend tens of billions to achieve that goal. For shareholders, this means that even as revenue grows, net profit is being eroded by massive spending—and it remains unclear when these costs will pay off.
Technical analysis of META’s chart
When analysing META’s chart in mid-August, we:
→ drew an ascending channel (shown in blue);
→ pointed out signs of weakness (including a bearish gap¹, shown in orange);
→ suggested that the balance could shift in favour of the bears, which might trigger a noticeable correction in META’s share price.
This scenario played out as a decline from A → B. After rebounding from the key line of the blue channel, the price rose towards the bearish gap¹, forming a lower high C. The downward movement then continued, and the channel was extended with a lower low D.
The large bearish gap² that formed this week could also act as resistance (as in the previous case), and this effect is likely to be more pronounced near the $700 psychological level.
Overall, the picture looks extremely negative:
→ the sequence of lower highs and lows A → D is likely to continue with a new lower low F;
→ the price remains in the lower half of the red channel, drawn along this sequence.
From a bullish perspective:
→ $650 serves as a psychological support level;
→ if the rise from the April low to peak A is viewed as an impulse, then the decline A → F is approaching $640, corresponding to the 50% Fibonacci retracement level.
Given the above, it is reasonable to assume that the market will now reassess the new factors revealed in the report. From a charting standpoint, this could mean a period of consolidation, with META’s share price fluctuating between the red median line and the current support level of $650.
This article represents the opinion of the Companies operating under the FXOpen brand only. It is not to be construed as an offer, solicitation, or recommendation with respect to products and services provided by the Companies operating under the FXOpen brand, nor is it to be considered financial advice.

Meta Stock Falls Below $700 After Earnings ReportMeta’s stock dropped more than 10.5% during the last trading session, shortly after the company released its third-quarter results. Selling pressure has become dominant despite Meta reporting $51.24 billion in revenue, surpassing expectations of $49.40 billion, and earnings per share of $7.25, beating forecasts of $6.69.
However, it was revealed that the company incurred an extraordinary charge of approximately $16 billion, linked to a new U.S. tax regulation, which — if it hadn’t occurred — would have allowed for much higher reported earnings. This factor, combined with the massive spending on its artificial intelligence initiatives, could begin to erode profit margins in the coming months. As a result, a persistent sense of investor distrust has emerged, which could continue to place downward pressure on the stock in the near term.
Uptrend Breaks
Following the earnings release, the stock broke below the upward trendline that had been in place since April of this year, potentially marking a structural shift on the chart, with a bearish bias now becoming dominant after the sharp decline.
As long as the price remains below the 200-period moving average, selling pressure could stabilize and even lead to the formation of a new short-term downtrend.
RSI
The RSI line has started to show a steady downward slope, indicating that selling momentum has taken control over the past 14 sessions. However, the indicator is quickly approaching the oversold zone near the 30 level, suggesting a potential market imbalance that could open the door for short-term bullish corrections.
MACD
The MACD histogram has flattened around the zero line, signaling indecision in momentum based on the moving averages. If this condition persists, the stock could enter a sideways consolidation phase in the coming sessions.
Key Levels to Watch:
$740 – Resistance: This level aligns with the 50-period simple moving average. A move back toward this zone could reactivate the previous uptrend, which has now taken a back seat following the sell-off.
$689 – Current Barrier: This retracement zone coincides with the 200-period moving average and could serve as a neutral area, potentially triggering short-term corrections. However, as long as the price remains below this level, a sustained bearish bias may continue in the coming sessions.
$631 – Key Support: This level represents an area of indecision not seen since May of this year. A break below it could activate a fresh downtrend, likely to persist over the medium term.
Written by Julian Pineda, CFA – Market Analyst

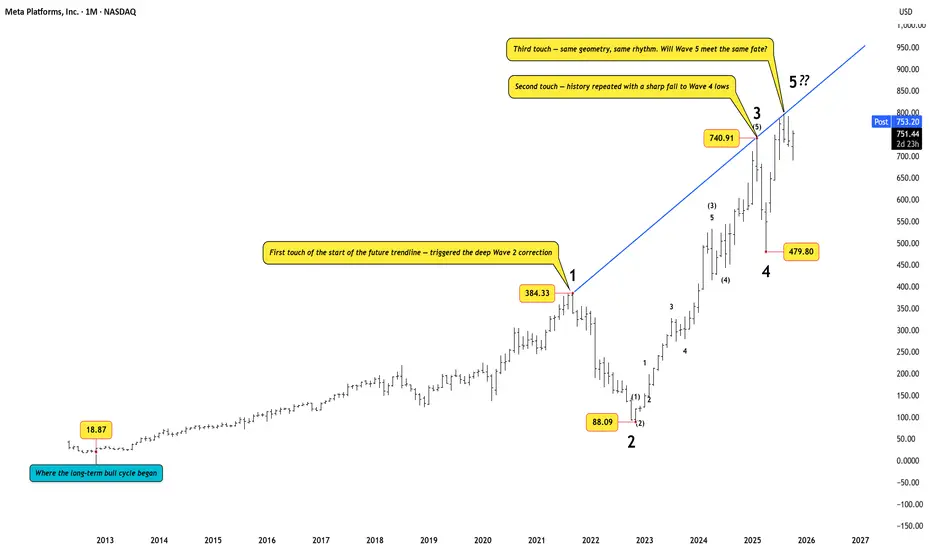
Meta Platforms: The Third Touch of DestinyMeta’s decade-long impulse from $18 to $750 may be nearing completion.
The price now tests the same long-term trendline that defined every major swing since 2013 — a point where geometry and rhythm converge once again.
When a structure this large approaches its terminal phase, it rarely ends quietly. A 38–50 % correction from the eventual Wave 5 high would be a natural reset before the next multi-year cycle begins.
At this stage, there’s little reward in chasing momentum. Sometimes, the smarter move is to step aside and let the market cool before the next impulse is born.
Disclaimer: This analysis is for educational purposes only and does not constitute investment advice. Please do your own research (DYOR) before making any trading decisions.
Meta Macd on the weekly looks so bad bulls losing momentum I think this crosses red tomorrow and a correction to 550 could be very possible .

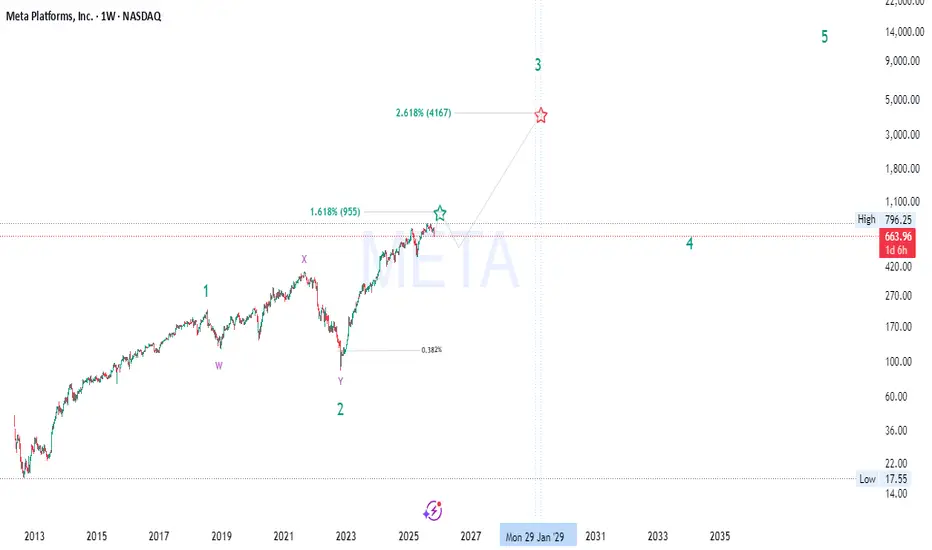
META’s Hidden Fibonacci Path to 4000+ — Don’t Miss Wave 3🚀 META Long-Term Elliott Wave + Smart Money Macro Outlook
🌊 Elliott Wave Structure (662→955→4000+)
META appears to be progressing through a major impulsive 5-wave supercycle on the weekly timeframe:
Wave 1: The initial breakout from accumulation (2015–2021), fueled by growth in advertising dominance and metaverse expansion narratives.
Wave 2: Deep corrective W–X–Y structure into the 2022 low around $90 — a classic multi-year liquidity sweep and re-accumulation phase.
Wave 3 (in progress): This is typically the strongest and most extended wave , with Fibonacci projections aligning near the 2.618 extension ≈ $4,160 , targeting 2028–2029 based on current momentum.
Wave 4: Expected to form a macro re-distribution or range between ~$900–$1,000 before the final parabolic Wave 5, likely extending toward $10K+ .
💡 Wave Confluence:
1.618 Fib extension of Wave 1 → Wave 3 aligns around $955 , acting as the first major resistance (and your current high zone).
2.618 Fib extension → next macro target $4,160 , confirming bullish impulsive momentum.
🧠 Smart Money Concepts (SMC)
The 2022–2023 bottom represents a “Displacement + Re-accumulation” phase , with institutions absorbing liquidity beneath previous demand zones.
Current price action (mid-2025) shows a premium range reaction , where smart money is likely taking partial profits before the next accumulation leg.
Expect a retracement into the 0.382–0.5 Fib zone ($420–$500) to rebalance inefficiencies before continuation toward macro Wave 3 targets.
Key Reaccumulation Zone: $420–$500 — watch for BOS (Break of Structure) confirmation and liquidity sweeps below equal lows.
🔍 Fibonacci Alignment
0.382 retrace marks ideal Wave 4 re-entry.
1.618 & 2.618 extensions align perfectly with the Wave 3 and 5 confluences — textbook impulsive expansion.
Each extension zone has been confirmed with prior liquidity sweeps and displacement candles, increasing Fibonacci reliability 📈.
📊 Market Structure & Price Action
META maintains a strong bullish market structure of Higher Highs (HH) and Higher Lows (HL) since 2023.
The recent 9% correction (-$69) is likely a short-term liquidity grab — not structural weakness.
As long as price holds above $420 , macro bullish market structure remains intact.
Volume profile shows heavy accumulation between $300–$450 , suggesting smart money is still positioned long-term bullish.
💰 Fundamental Confluence
META’s fundamentals are catching up with technicals:
Massive AI CapEx and ad recovery boosting EPS growth 📊
Metaverse burn rate shrinking , improving profitability
Share buybacks providing a floor for price corrections
Macro environment supports tech leadership rotation , and META remains a key beneficiary of the AI + social data synergy cycle 🔄
🔮 Market Cycle View
We’re entering the “Expansion Phase” of the broader innovation cycle.
2018–2022 = Accumulation/Disbelief
2023–2025 = Early Markup / Smart Money Entry
2025–2029 = Public Participation Phase (Wave 3) 💥
Post-2029 = Euphoria / Distribution (Wave 5) 😱
⚙️ Key Levels to Watch
Support Zones: $420 – $500 (Wave 4 re-entry)
Resistance Levels: $955 → $4,160 (Wave 3 targets)
Invalidation: Sustained break below $300 on weekly close
📈 Summary
META remains one of the strongest macro bullish charts in big tech — with perfect alignment across Elliott Wave, SMC, Fibonacci , and fundamental cycle theory .
We’re currently witnessing the mid-phase of Wave 3 , with institutional repositioning before the next vertical leg. Patience and precision around the reaccumulation zone ($420–$500) could provide the golden setup before the next expansion wave 🚀🌕
#META #ElliottWave #SmartMoneyConcepts #Fibonacci #Wave3 #BullMarket #AIStocks #TechnicalAnalysis #TradingView
META OutlookAfter an ABC consolidation of a clear wave 4. Now, starting wave 5 to continue the bulish wave above the support area indicated by the blue box.

Meta - Faces away from the top=======
Volume
=======
-neutral
==========
Price Action
==========
- Double top and bearish flag noticed
- Weak buying pressure
- broken out of 6 months downtrend line
=================
Technical Indicators
=================
- Ichimoku
>>> price below cloud
>>> Red kumo budding
>>> Tenken + Chiku - below clouds
>>> Kijun - within clouds and moving away
=========
Oscillators
=========
- MACD still bearish
- DMI bearish
- StochRSI, bearish and sloping down
=========
Conclusion
=========
- short to long term breakout swing
- price may reverse at current level, to enter spot or wait for pullback at entry 2.

Strategies for Investors in Emerging Markets1. Understanding Emerging Markets: The Opportunity and the Risk
Emerging markets are nations transitioning from low-income to middle-income status with improving infrastructure, industrial capacity, and governance. They typically exhibit higher GDP growth rates compared to developed economies but are also prone to fluctuations due to external shocks, commodity cycles, and policy uncertainty.
Opportunities:
High Growth Potential: Economic expansion driven by demographics, technology, and urbanization.
Rising Middle Class: Increasing disposable incomes create strong demand for goods, housing, and financial services.
Untapped Markets: Sectors like renewable energy, digital payments, healthcare, and logistics are still underpenetrated.
Diversification: Adding emerging markets exposure helps investors reduce overreliance on developed market cycles.
Risks:
Political Instability: Policy reversals and corruption can disrupt business environments.
Currency Volatility: Exchange rate fluctuations can erode returns for foreign investors.
Liquidity Risk: Many emerging market stocks and bonds are thinly traded.
Regulatory Uncertainty: Sudden capital controls or taxation changes may impact investments.
The challenge is balancing these opportunities and risks through intelligent portfolio design and disciplined execution.
2. Strategic Approach: Building an Investment Framework
Before diving into specific markets or sectors, investors must establish a framework that defines their objectives, time horizon, and risk tolerance.
A. Long-Term Orientation
Emerging markets tend to be volatile in the short term but rewarding over longer periods. A 7–10 year investment horizon allows investors to ride out short-term turbulence and benefit from structural growth trends like digitization, infrastructure expansion, and industrial modernization.
B. Top-Down vs. Bottom-Up Analysis
Top-Down Approach: Focuses on macroeconomic indicators like GDP growth, fiscal health, inflation, interest rates, and political stability to identify attractive countries or regions.
Bottom-Up Approach: Focuses on identifying fundamentally strong companies within those economies that are capable of delivering consistent earnings growth regardless of external volatility.
A blend of both approaches ensures that investors capture macroeconomic upside while remaining selective at the micro level.
3. Geographic Diversification: Don’t Bet on a Single Country
One of the core principles in emerging market investing is diversification. No two emerging markets move in the same direction at the same time. For example, India’s tech-led growth story differs from Brazil’s commodity-driven economy or Vietnam’s export manufacturing model.
Key Diversification Strategies:
Regional Balance: Spread exposure across Asia, Latin America, Eastern Europe, and Africa.
Economic Model Diversification: Combine consumer-driven economies (India, Indonesia) with export-driven ones (Vietnam, Mexico).
Political Diversity: Mix stable democracies with reform-driven autocracies to spread political risk.
Exchange-Traded Funds (ETFs) like iShares MSCI Emerging Markets ETF (EEM) or Vanguard FTSE Emerging Markets ETF (VWO) provide diversified exposure across multiple markets, reducing country-specific volatility.
4. Sectoral Allocation: Focus on Structural Growth Themes
Emerging markets often lead global trends in specific sectors. Identifying high-growth industries within these regions helps investors capture sustainable long-term returns.
Promising Sectors:
Technology & Digital Infrastructure: The explosion of fintech, e-commerce, and AI startups in India, Indonesia, and Latin America.
Renewable Energy: Transition toward solar, wind, and green hydrogen projects in India, Brazil, and South Africa.
Healthcare & Pharmaceuticals: Growing middle-class populations are demanding better healthcare access and quality.
Consumer Goods & Retail: Expanding domestic consumption supports strong demand for FMCG and retail companies.
Financial Services: Low financial penetration opens vast opportunities for banking, insurance, and digital finance firms.
Investors should look for sectors aligned with long-term development trends and domestic reforms rather than short-term cyclical plays.
5. Currency and Inflation Management
One of the most overlooked risks in emerging market investing is currency fluctuation. Even if local asset prices rise, depreciation in the local currency against the U.S. dollar can wipe out gains for foreign investors.
Strategies to Manage Currency Risk:
Hedged ETFs: Use instruments that neutralize foreign exchange exposure.
Dollar-Cost Averaging: Regular investments over time reduce the impact of exchange rate timing.
Local Currency Bonds: Some investors use local bonds to balance currency exposure since yields often compensate for risk.
Stable Country Selection: Prioritize countries with credible central banks and stable monetary policies (e.g., India or Chile).
Inflation, too, can erode real returns. Investing in inflation-resilient assets such as commodities, real estate, or dividend-paying equities helps offset purchasing power loss.
6. Active vs. Passive Investment Strategies
Passive Investing
Investors can use index funds or ETFs tracking emerging market indices for cost-effective diversification. These instruments provide broad exposure and reduce single-country or single-stock risk.
However, passive strategies may miss out on specific outperformers or structural changes in certain markets.
Active Investing
Active fund managers can exploit inefficiencies in emerging markets by selecting undervalued companies, timing entries, and managing risk dynamically.
Successful active investing requires local knowledge, deep research, and a long-term view.
Blended Approach
Many investors use a core-satellite strategy:
Core portfolio: Passive exposure to broad emerging markets.
Satellite portfolio: Active bets on select countries or sectors with strong upside potential.
This combination provides balance between stability and opportunity.
7. Incorporating ESG and Governance Factors
Environmental, Social, and Governance (ESG) considerations have become integral to investment decisions worldwide. In emerging markets, ESG risks—such as corruption, labor practices, or environmental degradation—can directly affect returns.
ESG Strategies:
Screening Out High-Risk Firms: Avoid companies with poor governance or environmental violations.
Engagement: Encourage companies to improve transparency and sustainability practices.
ESG-Focused Funds: Many global asset managers now offer emerging market ESG ETFs and funds.
ESG adoption is not only ethically sound but also improves long-term performance as well-governed companies often enjoy lower borrowing costs and better investor confidence.
8. Timing and Entry Strategy
Emerging markets are highly sensitive to global liquidity cycles. When interest rates in developed markets rise, capital often flows out of emerging economies, leading to currency depreciation and market corrections.
Timing Tips:
Avoid Herd Behavior: Don’t chase rallies driven by short-term sentiment.
Buy During Corrections: Use market pullbacks to accumulate high-quality stocks at attractive valuations.
Follow Global Monetary Trends: Emerging markets typically perform better when the U.S. dollar weakens and global liquidity expands.
Technical Indicators: Use support levels and moving averages to identify favorable entry points.
Investors who remain disciplined and patient tend to benefit from long-term uptrends following temporary volatility.
9. Using Local Expertise and Partnerships
Investing directly in foreign markets can be complex due to legal, taxation, and information asymmetry challenges.
Collaborating with local fund managers, research firms, or regional ETFs provides better access to data, understanding of cultural nuances, and insight into domestic market behavior.
For example:
Joint ventures with local asset managers can open doors to private equity opportunities.
Local advisory services help navigate regulations and currency repatriation rules.
10. Risk Management and Hedging Tools
Emerging market investors must prioritize capital preservation as much as growth. Key risk management measures include:
Position Sizing: Avoid concentrating too much in a single country or sector.
Stop-Loss and Rebalancing: Regularly review portfolios to lock in gains and cut losses.
Derivatives and Hedging Instruments: Use currency futures or options to mitigate exchange risk.
Fixed Income Allocation: Pair equity exposure with sovereign or corporate bonds for income stability.
Liquidity Buffer: Maintain cash reserves to take advantage of opportunities during volatility spikes.
Effective risk management separates disciplined investors from speculative traders.
11. Case Studies: India and Vietnam
India: The Digital and Consumption Story
India represents one of the strongest long-term emerging market stories, driven by digital transformation, manufacturing expansion under “Make in India,” and a rising young population.
Sectors like IT services, fintech, renewable energy, and capital goods have delivered consistent returns. The government’s focus on infrastructure and fiscal reforms adds structural strength.
Vietnam: The Manufacturing Powerhouse
Vietnam benefits from trade diversification, young labor force, and foreign investment inflows as companies relocate from China. Its export-oriented economy, stable governance, and strategic location make it a regional favorite. However, investors must watch for banking sector vulnerabilities and currency management challenges.
These examples highlight the importance of aligning investment strategy with each country’s unique growth narrative.
12. Long-Term Vision: Compounding in High-Growth Economies
Emerging markets reward investors who think in decades, not quarters. Compounding works best when capital remains invested during both upcycles and corrections. Reinvesting dividends, staying informed on macroeconomic trends, and maintaining a disciplined approach can create exponential growth over time.
Global investors like BlackRock, Fidelity, and Franklin Templeton have consistently emphasized that emerging markets are no longer speculative bets — they are essential components of global portfolios.
Conclusion: Balancing Risk and Reward in the New Global Order
The next wave of global economic growth will likely come from emerging markets. With technological innovation, demographic dividends, and economic reforms, these nations are shaping the new world order.
However, investing in them requires a careful balance between optimism and prudence.
Successful investors in emerging markets:
Diversify broadly.
Focus on long-term structural growth themes.
Actively manage currency and political risks.
Blend passive exposure with active conviction plays.
Stay disciplined during volatility.
Emerging markets are not for the faint-hearted, but for those with patience, research, and strategy — they offer some of the most rewarding opportunities in global investing today.
$META: long term trend is clearly bullish...A very nice case study for Time@Mode applied to long term charts here...
If you bought NASDAQ:META at any point since it bottomed, you're pretty much golden.
Can hodl this and let it ride towards the long term targets that can take as far as 2028 if patient enough.
Current monthly trend is a good low risk entry, will confirm on close this month for higher confidence in the signal working. For now it seems unlikely for price to crater below $286.79 before the end of January, but it could always happen as a black swan, that's why you wait for signal confirmation if conservative.
Best of luck!
Cheers,
Ivan Labrie.

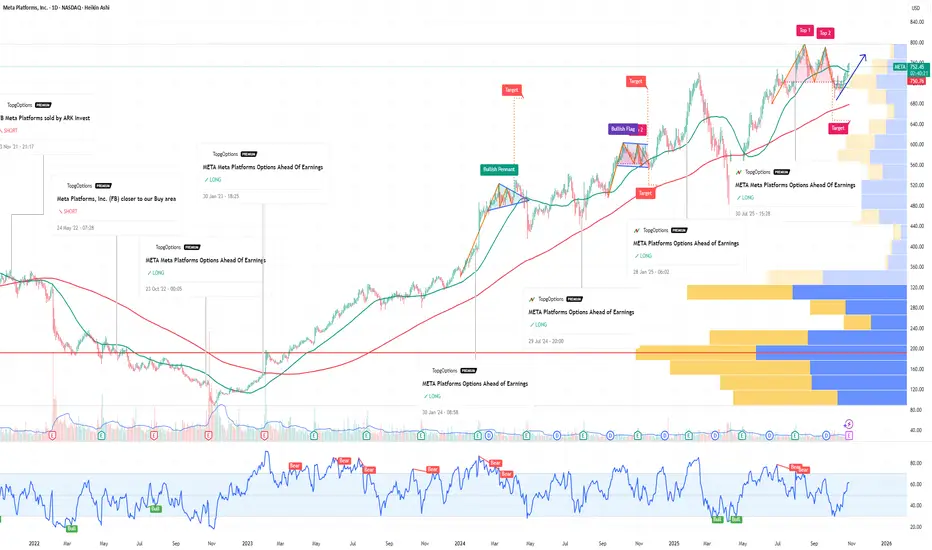
META Platforms Options Ahead of EarningsIf you haven`t bought META before the rally:
Now analyzing the options chain and the chart patterns of META Platforms prior to the earnings report this week,
I would consider purchasing the 720usd strike price Calls with
an expiration date of 2025-11-21,
for a premium of approximately $51.75.
If these options prove to be profitable prior to the earnings release, I would sell at least half of them.