$MSFT Bottom $455 oversold $425NASDAQ:MSFT Is a predictable machine $455 is the bottom margin for error could drop $425 in oversold situation.
All their fundamentals align and show the same pattern every time.
typically around this time we should see a dip which finds support at the last wave's highs.
there really isnt more
Key facts today
0.40 USD
87.52 B USD
242.13 B USD
About Microsoft Corp.
Sector
Industry
CEO
Satya Nadella
Website
Headquarters
Redmond
Founded
1975
ISIN
ARDEUT110285
FIGI
BBG000FT3QB6
Microsoft Corp. engages in the development and support of software, services, devices, and solutions. It operates through the following segments: Productivity and Business Processes, Intelligent Cloud, and More Personal Computing. The Productivity and Business Processes segment is composed of products and services relating to productivity, communication, and information services such as Office Commercial, Office Consumer, LinkedIn, and Dynamics business solutions. The Intelligent Cloud segment consists of public, private, and hybrid server products and cloud services for businesses and developers, as well as enterprise and partner services. The More Personal Computing segment refers to products and services including Windows operating system, Windows cloud services, Surface, HoloLens, personal computer accessories, Xbox hardware, Xbox Cloud Gaming, Microsoft News, and Microsoft Edge. The company was founded by Paul Gardner Allen and William Henry Gates, III in 1975 and is headquartered in Redmond, WA.
Related stocks

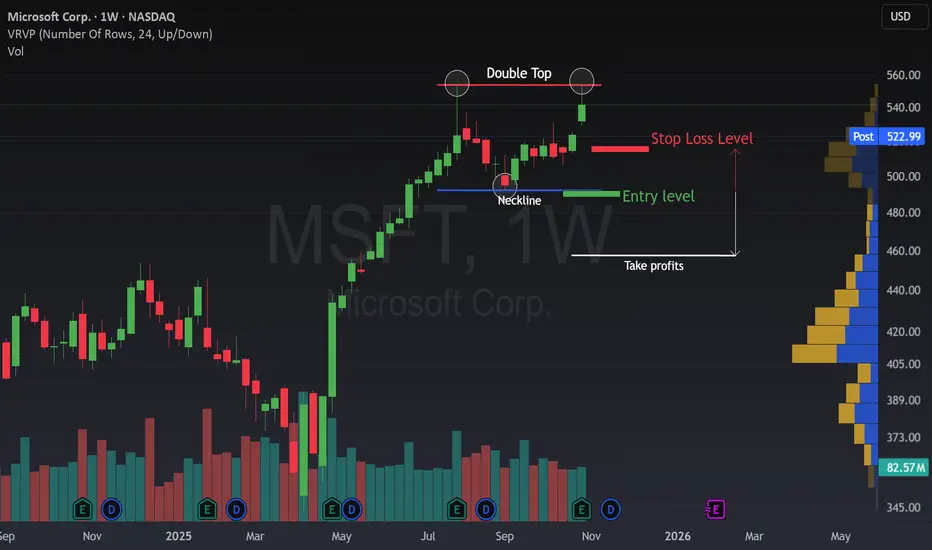
A Double Top in MSFT has just appeared.The weekly chart of Microsoft (MSFT) is showing a potential Double Top formation, a classic sign that bullish momentum might be losing strength .
🔹 Bullish Scenario: As long as the price stays above the blue neckline , the uptrend remains intact. Buyers are still in control, and a clear breako
Quant signals MSFT Weekly PUT: Institutional Bearish MomentumDirection: BUY PUTS (SHORT)
Confidence: 65% (Medium)
Strike: $475.00
Entry Price: $4.10
Target 1: $6.15 (50% gain)
Target 2: $8.20 (100% gain)
Stop Loss: $2.87 (30% loss)
Expiry: 2025-12-05 (2 days)
Position Size: 2% of portfolio
Weekly Momentum: BEARISH (-2.82%)
Options Flow: Bearish (PCR
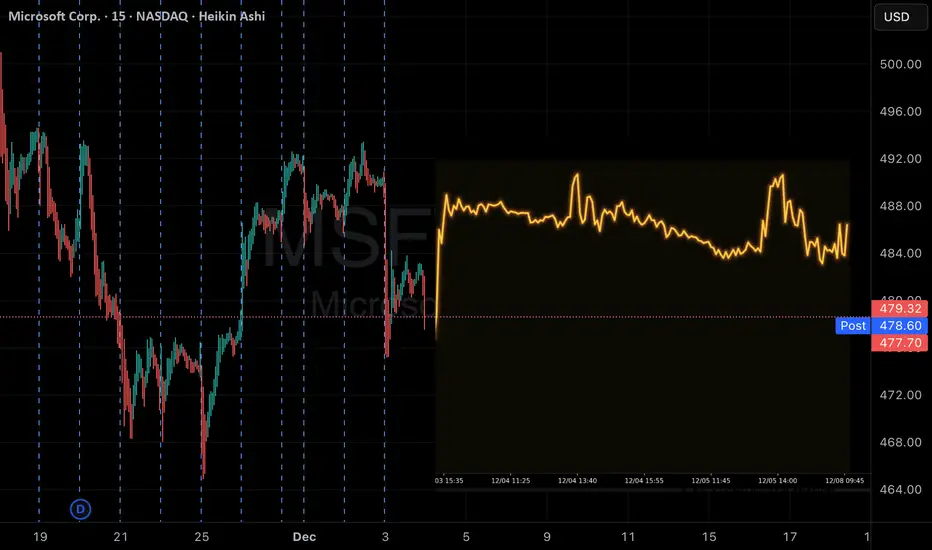
Microsoft (NASDAQ: $MSFT) Drops as AI Sales Miss Targets Microsoft (NASDAQ: NASDAQ:MSFT ) slid more than 2% after a report from The Information claimed that the company had reduced growth targets for its AI products because sales teams failed to meet expectations. The report highlighted that several Azure sales units missed ambitious quotas tied to Found

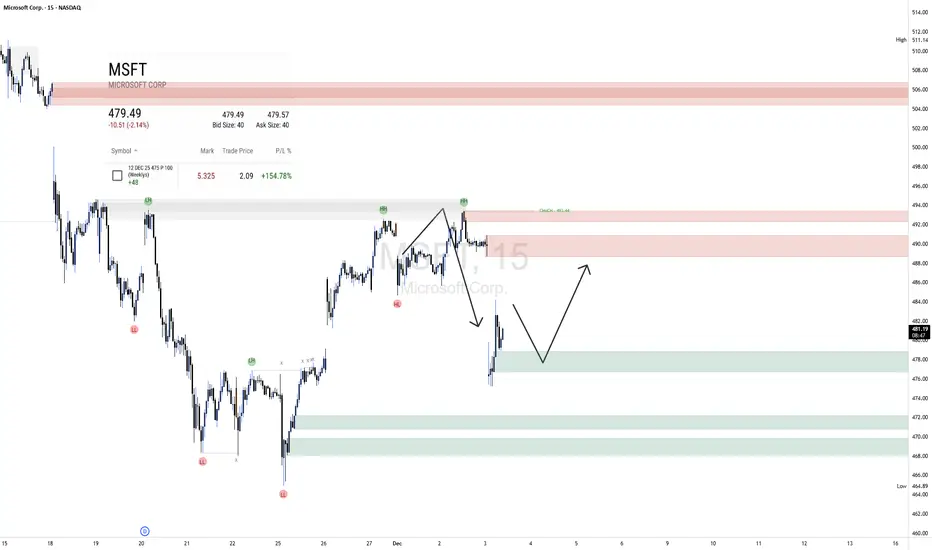
MSFT PullbackPattern Identified: Bearish Double Top pattern confirmed on Microsoft ( NASDAQ:MSFT ) with neckline break and clear measured move objectives. Neckline Break Triggers Measured Move to Gap Fill.
Key Confluence:
First Top: Initial rejection
Second Top: Failed breakout, lower high
Neckline: Support con

MSFT LongBroader Market Structure
MSFT on the 15-minute chart is in a short-term uptrend following a sequence of higher lows and higher highs from the $464 area. The key structural shift occurred when price printed a CHoCH at $492.44, breaking above the previous swing high and confirming bullish intent. Bef
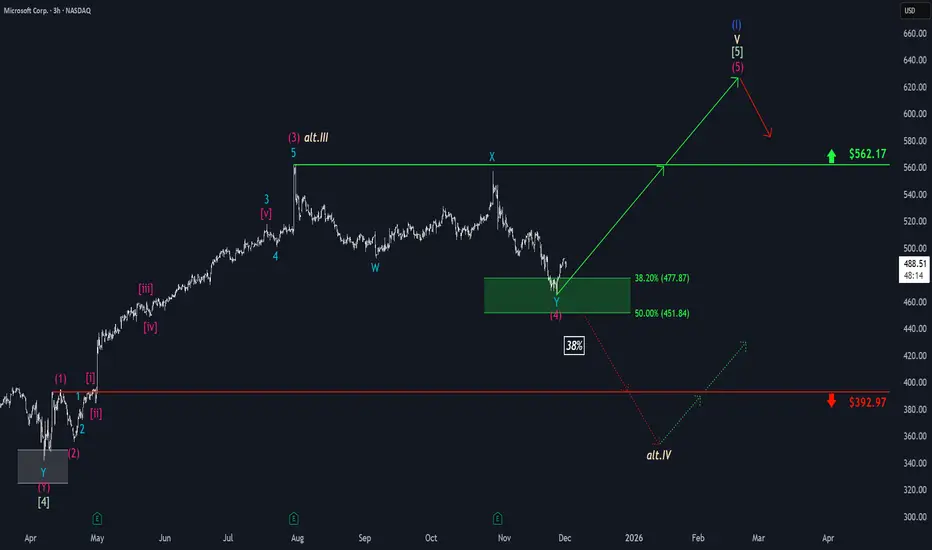
Microsoft: Target Zone Hit!Microsoft has reached our green Long Target Zone between $451.84 and $477.87 as anticipated. In the meantime, the stock has successfully completed the magenta wave (4) and has since broken out of the Target Zone to the upside. We now expect further gains as wave (5) unfolds, targeting a move above t
MSFT: Next Long Term Buy ZoneMicrosoft has staged a strong rally since the April tariff-related selloff, rebounding significantly but ultimately failing to set a new meaningful high in October. While the company’s earnings have remained relatively strong, it is still a publicly traded stock and therefore susceptible to broader


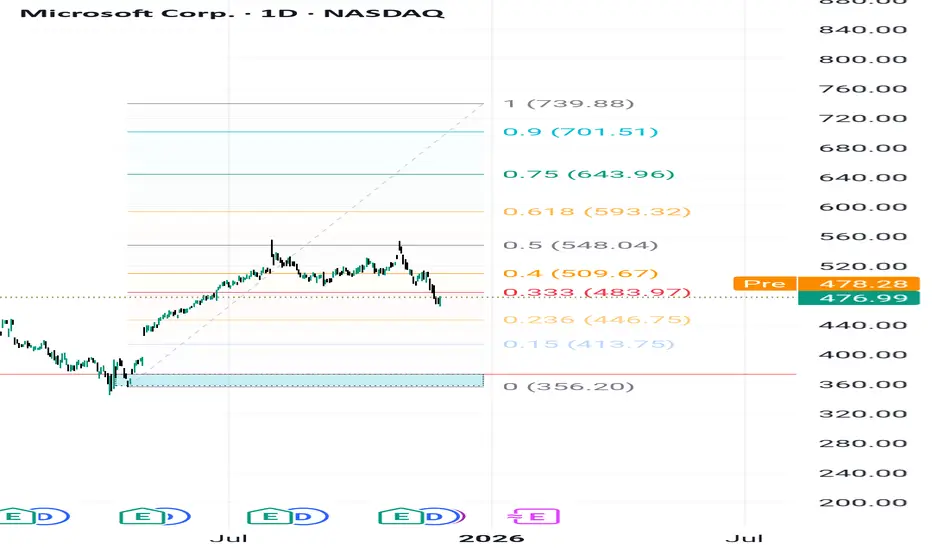
MSFT — Bullish Structure Intact Above 373.22, Targeting 739.88.Microsoft remains in a well-defined long-term bullish structure despite the current pullback from the 0.40–0.50 Fibonacci resistance cluster. The recent decline appears corrective in nature and does not signal any structural weakness as long as the stock preserves its main support foundation.
Key
See all ideas
Summarizing what the indicators are suggesting.
Oscillators
Neutral
SellBuy
Strong sellStrong buy
Strong sellSellNeutralBuyStrong buy
Oscillators
Neutral
SellBuy
Strong sellStrong buy
Strong sellSellNeutralBuyStrong buy
Summary
Neutral
SellBuy
Strong sellStrong buy
Strong sellSellNeutralBuyStrong buy
Summary
Neutral
SellBuy
Strong sellStrong buy
Strong sellSellNeutralBuyStrong buy
Summary
Neutral
SellBuy
Strong sellStrong buy
Strong sellSellNeutralBuyStrong buy
Moving Averages
Neutral
SellBuy
Strong sellStrong buy
Strong sellSellNeutralBuyStrong buy
Moving Averages
Neutral
SellBuy
Strong sellStrong buy
Strong sellSellNeutralBuyStrong buy
Displays a symbol's price movements over previous years to identify recurring trends.
ATVI4499883
Activision Blizzard, Inc. 4.5% 15-JUN-2047Yield to maturity
6.87%
Maturity date
Jun 15, 2047
ATVI5026499
Activision Blizzard, Inc. 2.5% 15-SEP-2050Yield to maturity
6.27%
Maturity date
Sep 15, 2050
See all MSFTC bonds
Curated watchlists where MSFTC is featured.


