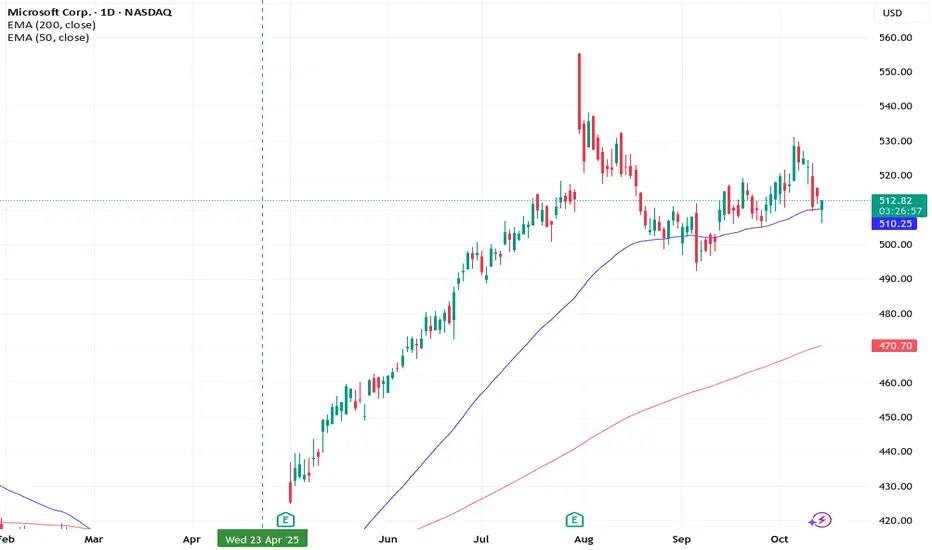
Here's What Microsoft's Chart Says Heading Into EarningsMicrosoft NASDAQ:MSFT , which will release earnings next week, is beating the S&P 500 SP:SPX year to date -- up 24.4% vs. about 15.7% for the SPX. MSFT has also gained roughly 112% over the past three years, while the S&P 500 has added just 78.9%. What does the company's chart show us ahead of e
Key facts today
0.40 USD
87.52 B USD
242.13 B USD
About Microsoft Corp.
Sector
Industry
CEO
Satya Nadella
Website
Headquarters
Redmond
Founded
1975
ISIN
ARDEUT110285
FIGI
BBG000FSY3T6
Microsoft Corp. engages in the development and support of software, services, devices, and solutions. It operates through the following segments: Productivity and Business Processes, Intelligent Cloud, and More Personal Computing. The Productivity and Business Processes segment is composed of products and services relating to productivity, communication, and information services such as Office Commercial, Office Consumer, LinkedIn, and Dynamics business solutions. The Intelligent Cloud segment consists of public, private, and hybrid server products and cloud services for businesses and developers, as well as enterprise and partner services. The More Personal Computing segment refers to products and services including Windows operating system, Windows cloud services, Surface, HoloLens, personal computer accessories, Xbox hardware, Xbox Cloud Gaming, Microsoft News, and Microsoft Edge. The company was founded by Paul Gardner Allen and William Henry Gates, III in 1975 and is headquartered in Redmond, WA.
Related stocks
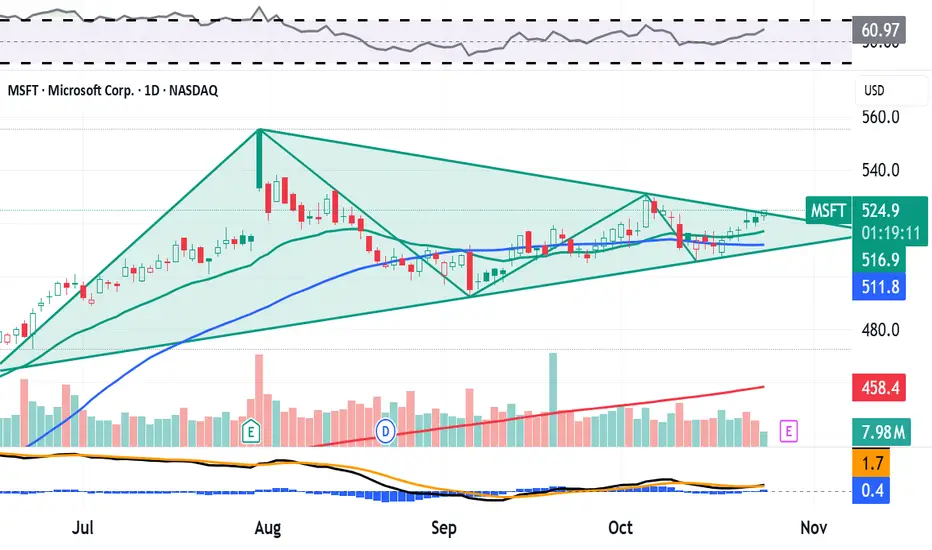
Cup & Handle Heading into EarningsNASDAQ:MSFT is forming quite a large cup and handle within a larger symmetrical triangle after closing the week, bouncing off the 20-day EMA. NASDAQ:MSFT 's bollinger bands are squeezing as well as it heads into earnings this week, along with the rest of the Mag 7- Just some support levels and som

MSFT – Key Compression Zone Before Earnings for Oct. 21-25MSFT – Key Compression Zone Before Earnings: Bulls Defending $510 Support ⚡️
🟩 Daily Timeframe – Macro Market Structure
Microsoft’s daily chart remains technically bullish in the larger structure but has clearly lost short-term momentum after peaking in late September. Price is now hovering near th
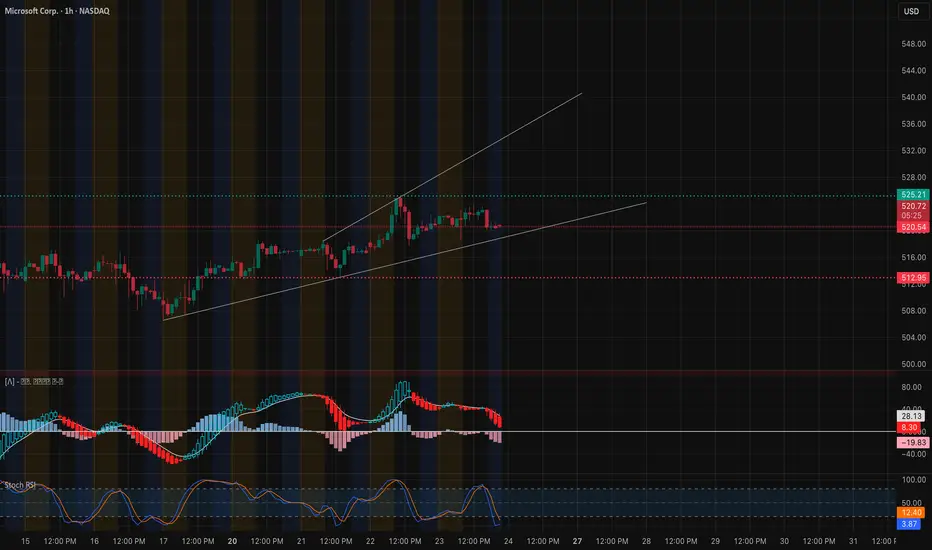
MSFT Tightening Into Friday — (Oct. 24 Outlook)Watching $520 Support and $525 Breakout Zone ⚙️
1. Market Structure (1H & 15M)
Microsoft (MSFT) continues to respect a rising structure but is now entering a compression phase under a strong resistance shelf near $525. On the 1-hour chart, the trend remains intact above the ascending trendline tha
MSFT - heading to support in the 340$ areaA very simple chart, just a channel and monthly MACD.
Like some other tech stocks the ATH was in July 2024 and price seems to be heading to the lower trend line. If it does, the entire market will go down further as well.
So keeping an eye on the monthly charts of big tech is important.
The MACD (

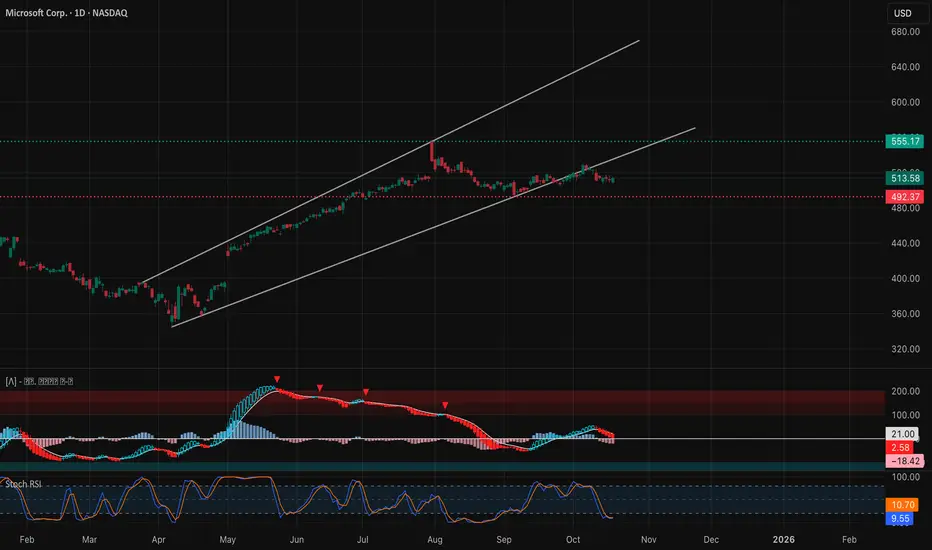
MSFT Weekly Outlook (Oct 28–31)MSFT Weekly Outlook (Oct 28–31): “Structure Holding Strong — Can Bulls Reclaim $540 for the Next Leg?”
1. Weekly (1W) — Macro Structure
Microsoft remains firmly in a long-term bullish channel, maintaining higher lows since early 2024. The most recent CHoCH from the mid-2025 correction successfully

Microsoft: New Target Zone in PlaySince our last update, Microsoft shares have continued to decline, but there is still potential for an upside move. We do not yet consider the turquoise wave X to be complete. Once its high is established below the resistance at $562.17, we expect price to head lower toward the wave Y low. Our revis

The #1 Stock:Microsoft (MSFT) – Rocket Booster Bullish Reversal Overview:
Microsoft is showing a monthly Rate of Change (ROC) above 0%, while the weekly ROC is below 0%, suggesting a potential reversal zone. This setup combines trend indicators with candlestick confirmation for a high-probability entry, part of what we call the Rocket Booster Strategy.
Rocket
Microsoft (MSFT) — The Titan at a Tipping Point! Can Bulls Defend $510 or Will Bears Take Over?
🧭 Weekly Chart — Macro Structure & Trend Direction
MSFT’s weekly structure shows a clean bullish trend since its March 2024 low, but now, that momentum is showing cracks. The chart reveals a CHoCH (Change of Character) just below the previous BOS (Brea

Google, Meta & Microsoft Daily Trade SetupsIn this update we review the recent price action in Google, Meta & Microsoft and identify the next high-probability trading opportunities and price objectives to target. To review today's video analysis, click here!

See all ideas
Summarizing what the indicators are suggesting.
Oscillators
Neutral
SellBuy
Strong sellStrong buy
Strong sellSellNeutralBuyStrong buy
Oscillators
Neutral
SellBuy
Strong sellStrong buy
Strong sellSellNeutralBuyStrong buy
Summary
Neutral
SellBuy
Strong sellStrong buy
Strong sellSellNeutralBuyStrong buy
Summary
Neutral
SellBuy
Strong sellStrong buy
Strong sellSellNeutralBuyStrong buy
Summary
Neutral
SellBuy
Strong sellStrong buy
Strong sellSellNeutralBuyStrong buy
Moving Averages
Neutral
SellBuy
Strong sellStrong buy
Strong sellSellNeutralBuyStrong buy
Moving Averages
Neutral
SellBuy
Strong sellStrong buy
Strong sellSellNeutralBuyStrong buy
Displays a symbol's price movements over previous years to identify recurring trends.
ATVI4499883
Activision Blizzard, Inc. 4.5% 15-JUN-2047Yield to maturity
6.87%
Maturity date
Jun 15, 2047
ATVI4495111
Activision Blizzard, Inc. 3.4% 15-SEP-2026Yield to maturity
5.49%
Maturity date
Sep 15, 2026
See all MSFTD bonds
Curated watchlists where MSFTD is featured.


