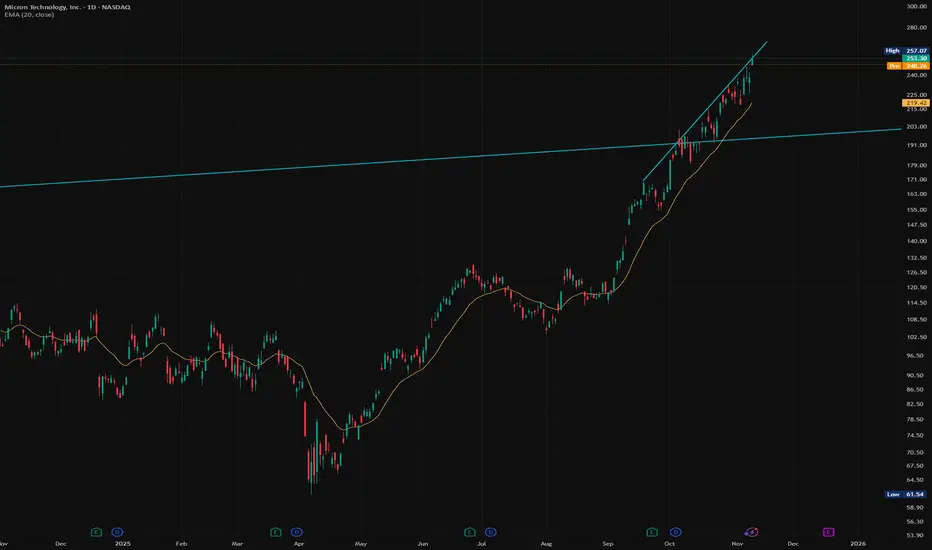
Micron Technology - This bullrun is still not over!💵Micron Technology ( NASDAQ:MU ) can rally a final +25%:
🔎Analysis summary:
Micron Technology retested major support in mid 2025. After we then witnessed textbook bullish confirmation, it was clear that this stock will rally. With the recent move of +300%, Micron Technology is almost back at major resistance, but it can rally another +25% first.
📝Levels to watch:
$300
SwingTraderPhil
SwingTrading.Simplified. | Investing.Simplified. | #LONGTERMVISION
Micron Technology, Inc. Shs Cert Deposito Arg Repr 0.2 Sh
No trades
Trade ideas

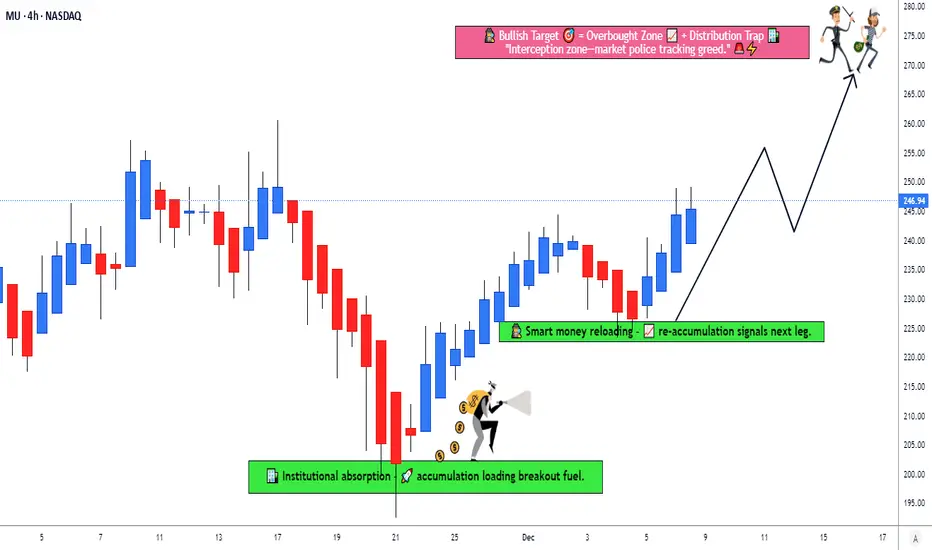
Micron Technologies ¦ Accumulation → Re-Accumulation Power Setup📈 Asset: MU — Micron Technology, Inc. (NASDAQ)
🎮 Strategy Style: Stock Market Profit Playbook (Swing Trade)
💼 Structure Bias: Bullish continuation confirmed through accumulation → re-accumulation phase, showing sustained demand and smart-money support.
🧤 THIEF PLAYBOOK PLAN
The bullish structure is validated as MU continues to build strength within an accumulation base, followed by a clean re-accumulation zone, signaling institutional demand stepping back in. Buyers are quietly stacking positions — a classic power shift before the potential continuation leg. ⚡📊
🎯 ENTRY PLAN — Thief Layer Strategy
This trading style uses multiple layered limit orders to accumulate a position across different prices.
This method is known as a layering strategy / scaling-in entry method.
My thief-style sample layers (modify as you prefer):
🧤 Buy Limit Layer 1: 225.00
🧤 Buy Limit Layer 2: 230.00
🧤 Buy Limit Layer 3: 235.00
🧤 Buy Limit Layer 4: 240.00
(📌 You can adjust or increase layers based on your own plan.)
🛡️ STOP-LOSS (Thief SL Version)
This is my personal plan only — Thief SL @ 270.00
📌 Dear Ladies & Gentlemen (Thief OG’s), I am not recommending using my stop-loss.
Trade your own risk management and personal preference.
🎯 TARGET — Overbought Zone + Resistance Trap
Price faces a major police-force resistance zone where overbought conditions + liquidity traps are likely.
So the safe exit for me:
💰 Target (TP): 210.00
📌 Dear Ladies & Gentlemen (Thief OG’s), take-profit is fully your choice — take money when you see money.
🌍 CORRELATED PAIRS TO WATCH (Key Notes)
Tracking related tickers helps confirm momentum and sector strength.
🔥 Semiconductor / Tech Correlation Watchlist
NASDAQ:NVDA (NVIDIA):
Strong sector leader — if NVDA holds uptrend, MU often mirrors relative strength.
NASDAQ:AMD (Advanced Micro Devices):
Shares similar demand cycles; strong AMD = rising semiconductor sentiment.
NASDAQ:SMH (Semiconductor ETF):
Great macro confirmation tool — ETF flows show sector-wide accumulation.
NASDAQ:SOXX (iShares Semiconductor ETF):
Helps validate whether the entire chip sector is trending or pulling back.
NASDAQ:INTC (Intel):
Not perfectly correlated but useful for observing competitive pressures & rotation.
📌 Key Insight:
If sector ETFs ( NASDAQ:SMH / NASDAQ:SOXX ) continue printing higher lows, MU’s re-accumulation thesis gains more strength.
If NVDA + AMD break down together, MU may enter deeper discount zones — helpful for thief layered entries.
✨ “If you find value in my analysis, a 👍 and 🚀 boost is much appreciated — it helps me share more setups with the community!”
⚠️ Disclaimer
This analysis is for educational purposes only.
This is a thief-style trading strategy just for fun — trade at your own risk and manage your own decisions responsibly.
#MU #Micron #SwingTrade #StockMarket #NASDAQ #LayeringStrategy #Accumulation #ReAccumulation #TechnicalAnalysis #TradingView #ThiefStrategy #Semiconductors #NVDA #AMD #SMH #SOXX #PriceAction #EditorPickReady 🚀
MU give it to me.I will add below 90 any day. I am curious why there was such aggressive selling on MU even in a soft environment for semis.

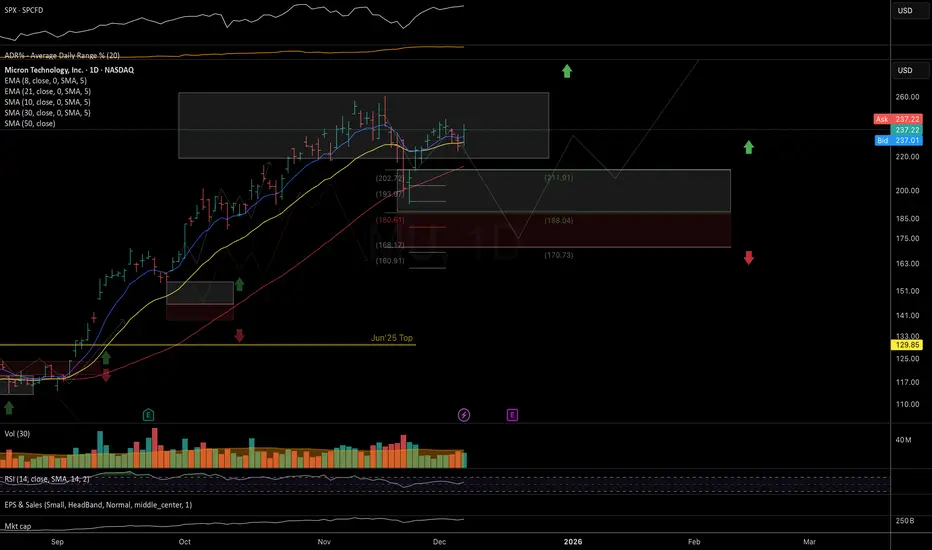
MU: one more leg down potential I would prefer to see one more leg down into the deeper mid-term support zone at 180–170, as long as price remains below the December highs.
Chart:
Previous analysis on NASDAQ:MU trend structure (Jul-Oct):
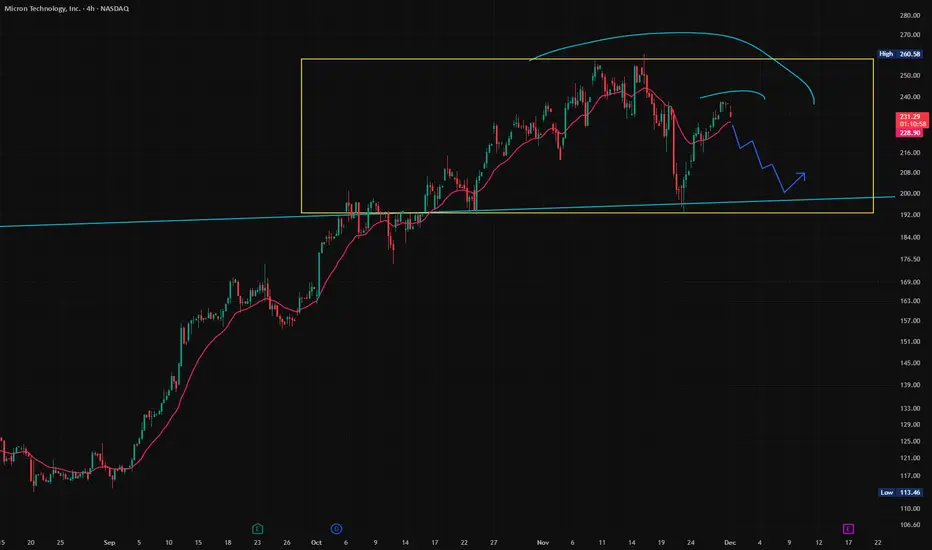
$MU short — back to $200 again?Trend is stretched. The more extended a move gets, the higher the odds we transition into a range.
$200 round number is the magnet zone.
Micron Technology - The end will come soon!✂️Micron Technology ( NASDAQ:MU ) will create a top soon:
🔎Analysis summary:
Starting back in mid 2025, Micron Technology retested a major confluence of support. This retest was followed by an expected rally of about +250%. But soon, Micron Technology will create a short term top formation, followed by a healthy correction towards the downside.
📝Levels to watch:
$250
SwingTraderPhil
SwingTrading.Simplified. | Investing.Simplified. | #LONGTERMVISION

MU – Trend Still Intact, EMA50 Bounce SetupMU - CURRENT PRICE : 220.00 - 222.00
Technical Reasons (Bullish Bias)
1️⃣ Price retesting strong dynamic support
Price is holding above the 50-day EMA, which has acted as support throughout the uptrend. Pullback into EMA50 often forms a bullish continuation point.
2️⃣ Price still above the Ichimoku Cloud
Price is trading above the cloud, meaning long-term trend remains bullish. The cloud is thick — showing strong trend support. Latest pullback is testing the top of the cloud, usually a high-probability bounce area.
3️⃣ RSI turning up from mid-zone (not overbought)
RSI is around 50, which is a healthy reset in an uptrend. No overbought conditions → room for upside continuation.
4️⃣ Trend structure remains bullish
Higher highs & higher lows remain intact. Current candle shows buying interest at key support.
5️⃣ Market respects previous breakout area
Price pulled back to retest September–October breakout zone → classic break-and-retest setup.
ENTRY PRICE : 218.00 - 222.00
FIRST TARGET : 236.00
SECOND TARGET 260.00
SUPPORT : 201.00

Micron (MU) is booming in the AI era! 💥 🚀🔥#Micron (#MU) is booming in the AI era! With record demand for memory and storage, constant innovation, and strong results, MU is redefining the digital future. Savvy investors see huge opportunities in a global leader ready to transform technology and portfolios. 🚀
#Micron #MU #AI #TechStocks #Investing #Innovation #DigitalFuture #StockMarket #GrowthStocks #Finance NASDAQ:MU
MU long-term TAMicron is one of the strongest among semis, there's no need to wonder why it's holding up so good, it has plenty of heavy bullish volumes on weekly time frame which have started to correct recently yes, to be more precise since last week the mid-term has initiated the distribution, so now MU needs some time to balance everything. Watch the blue lines for the support to hold.

Micron just keeps moving - long at 235.48MU is a stock I forget about easily and am always mad when I rediscover it and wish I had been trading it. Memory prices are up 160% in the last MONTH and in a market gasping for good earnings, it's a safe bet they will deliver in the near term, at least.
It caught my eye because it is one of only a handful of mega cap stocks that is trading above its 20, 50 and 200d MAs. I think that despite its "overvaluation", mega cap is mega for a reason. They have the earnings to justify their mega status.
MU is in a really strong uptrend right now that began in early September, but is short term under a lot of pressure over the last couple of days. This has created a situation that has produced a winning trade in 2 days or less 13 of the last 15 times it has occurred, and the 2 times it didn't produced wins of 2.1% and 2.5% that just took longer (17 and 5 trading days, respectively) but on a per day held basis, even those handily beat the market.
I am looking for a quick rebound trade here, hopefully one of the one or two day variety. If longer, I will add if necessary and sell tactically until the original lot is sold profitably.
As always - this is intended as "edutainment" and my perspective on what I am or would be doing, not a recommendation for you to buy or sell. Act accordingly and invest at your own risk. DYOR and only make investments that make good financial sense for you in your current situation.

Micron Technology . Buyer exhaustion, $110 next? - November 2025When euphoria hits RSI over 80, the hangover's never far behind.
You've got to hand it to Micron, it's been on an absolute tear. Three months of green candles, 300% return in six months, RSI through the roof, price action outside the Bollinger Band.. if this isn't "buyer exhaustion", it's the closest thing to it since crypto traders discovered leverage.
The technicals
Let's start with the what's actually on the chart:
Three week hanging man candle, the kind that makes experienced traders reach for the Asprin. (Remember that 3 week candle on Bitcoin no one wanted to believe at $117k, yeah well..)
Bearish divergence, price making higher highs and RSI saying "Nah, I'm done."
The Fibonacci 1.618 extension and price action rendezvous at a popular meeting place where emotions say "This time is different", not different, just an expensive reality check.
Bull flag forecast now met and then some, textbook.
Price action outside the Bollinger Band. Translation: Buyers have officially left the chat.
RSI at historical overbought levels. Last time we saw this, the party ended with a 50% drawdown and a lot of denial.
When every indicator starts shouting the same thing, it's not a conspiracy... it's confirmation.
Narrative versus reality
Of course, the narrative machine is in full swing:
"Micron's at the forefront of AI memory expansion!"
"Semiconductors are the new oil!"
"Buy the dip, buy the rip, buy everything!"
Sure. But look left. Every time Micron's RSI toughed these levels, 2018, 2021, 2024, the same thing happened. Price ripped, buyers got greedy, and then the chart did what charts always do, reverted to the mean, which is currently $110
Structure check
Notice where price is now? Extended beyond both the flag channel and the upper Bollinger Band. The bull flag's measured move has been met and exceeded, and what comes next isn't rocket science: Momentum fades, structure breaks, price retraces to support.
Nearest major support? Around $145-150, followed by the broader $120 region, which also aligns nicely with prior structure and the 0.382 Fibonacci level. That's your sanity zone where value buyers return, and over leveraged bulls pretend they always planned to "scale in lower".
Context matters
Micron isn't a bad company. It's a good company doing too well, too fast, in a market that's gone a bit mad for anything with "AI" in the press release. But markets don't trend on virtue, they trend on emotion. And this emotion looks a lot like euphoria. Euphoria is fun. Until it isn't.
Conclusions
Micron’s had its sprint. The bull flag target’s hit. Momentum’s wheezing. RSI’s screaming. And the candle pattern’s spelling it out: buyer exhaustion.
Could it push higher short-term? Sure. That’s what blow-off tops do, they taunt you. But probability now favours consolidation or a correction. If you’re holding long, tighten stops. If you’re flat, wait for the retrace. If you’re still buying here, well, good luck. You’re basically buying confetti at a wedding after the cake’s been eaten.
Ww
Disclaimer
==========================================================
This isn’t financial advice. Obviously. If you’re basing your trades on the sarcastic ramblings of a bloke who names chart patterns after furniture, that’s your problem. If it goes up, you’ll take credit. If it goes down, you’ll blame the Fed. Either way, I’ll still be here sipping tea, because that's what we British do, watching the RSI fall back to 50 and muttering “told you so.”
Without Worries (Ww)

Short-Term Technical Signals (Mixed/Cautious)Potential Trading Range: $190.50 to $221.50
The primary drivers for Micron Technology's stock have been significant demand growth and supply tightness in the memory chip market, which is fueling price increases.
Positive Analyst Sentiment: The stock currently has a strong consensus rating of "Strong Buy" or "Buy" from a significant majority of analysts, with several firms recently raising their price targets (e.g., UBS to $275, Rosenblatt to $300, Morgan Stanley to $325). The average price target suggests an upside from the current level.
AI-Driven Demand: The growth of generative Artificial Intelligence (AI) has dramatically increased demand for high-capacity memory solutions like DRAM and High-Bandwidth Memory (HBM), of which Micron is a key supplier. This is seen as a strong tailwind for the business.
Supply Tightness and Price Increases: Analysts report ongoing supply tightness for memory chips, particularly for advanced types like DDR5, which is leading to substantial quarter-over-quarter price increases for contract and spot pricing. This direct revenue and margin driver could lead to strong short-term earnings surprises.
Recent Momentum: While the stock has seen some recent volatility after reaching an all-time high, it has delivered an impressive year-to-date return, indicating strong underlying momentum.

MU - 160 / 260 Strangle Iron Condor IVR has expanded heavily in MU over the past several trading days.
Going to sell some options outside the 1 standard deviation in December to try and capture a IV contraction ..

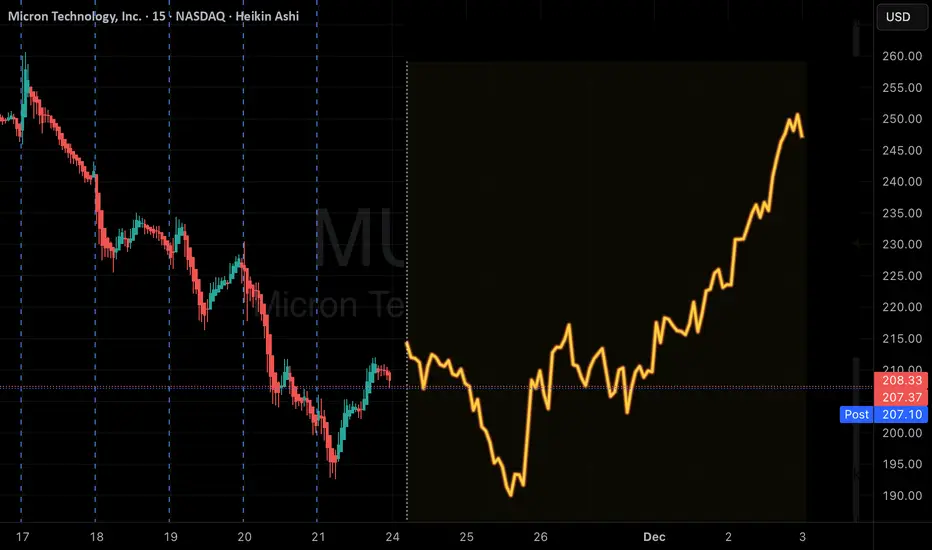
MU Trade Alert: Katy V3 Sees Late-Week UpsideMU | QuantSignals V3 Weekly Trade Alert (2025-11-21)
Signal Overview
Direction: BUY CALLS (LONG)
Confidence: 58% (Low Conviction)
Expiry: 2025-11-28 (7 days)
Strike: $212.50
Entry Price: $7.75
Target 1: $11.63 (+50%)
Target 2: $15.50 (+100%)
Stop Loss: $5.43 (-30%)
Position Size: 2% of portfolio
Market Context
Weekly Momentum: Bullish +3.64%
Flow Intel: Bearish PCR 2.31 → likely institutional hedging
Technical Support: $207.05 | Resistance: ~$230
Current Price Action: Strong late-week bullish trajectory, recovering from Nov 24 lows toward Katy target $224.11
Trade Rationale
Katy AI shows NEUTRAL overall confidence but a late-week bullish trend
PCR bearishness interpreted as hedging, not conviction, creating asymmetric opportunity
Friday gamma effects may accelerate price movement toward $224 target
Conservative sizing mitigates risk while capturing potential upside
⚠️ Risk Warning
Low Katy confidence → use small position size
Friday expiration → higher gamma risk
Mixed signals → consider scaling in cautiously
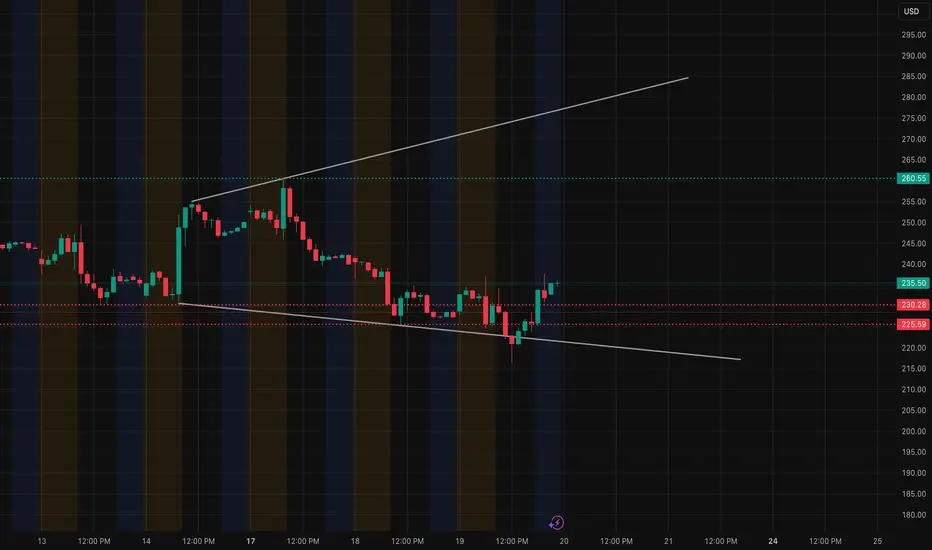
MU Ready for a Bigger Move? Key Levels to Watch – Nov. 201-Hour Trend Overview
MU has been recovering from the recent selloff and is now pushing off a higher-low formation. Price reclaimed the 230 zone, which has acted as a heavy demand area multiple times. Momentum on the 1-hour is shifting upward as MACD flips positive and buyers defend dips.
Key notes from the chart:
* Price is climbing out of a falling channel.
* A clear BOS formed above 232, showing buyers stepping back in.
* The next major test is 237–240, where previous supply rejected price multiple times.
Key 1H Levels:
* Resistance: 237.00 → 240.00
* Support: 230.00 → 225.50
* Deeper support: 216.50
If MU holds above 232–235, it opens the door to retest 240.
15-Minute Trading Setup
MU is forming a higher-low structure and building acceptance above 235.
What the 15m shows:
* CHoCH → BOS sequence confirms short-term trend reversal.
* Buyers stepped in strongly off the green demand block around 228–231.
* Price is now pushing into the 237 zone, which is the first resistance for active traders.
15m Trade Thoughts:
Bullish:
* Above 237.00 → potential continuation to 240.50
* Best setup: Break and retest of 237 turns that zone into intraday support.
Bearish:
* Below 232.00 → pulls back toward 230 and possibly 228
* Only valid if 235 breaks with momentum and 15m trend flips.
GEX Interpretation (The Confirmation Layer)
GEX adds clarity to the bigger move:
Based on your GEX chart:
* The strongest positive GEX zone is near 240–250, aligning with the 1-hour upside targets.
* CALL resistance sits around 237–240, suggesting this is the area where price may stall before breaking or rejecting.
* Highest negative NETGEX / PUT support sits at 230, confirming this as the firm downside floor for now.
* Below 230, open air to 216–220.
What GEX suggests for direction:
* If MU stays above 235, calls dominate and price gravitates toward 240.
* If MU loses 230, the market shifts into put control and sellers pull price toward 225 or lower.
Options Trade Ideas (Based on GEX & Price Structure)
Bullish Options Setup (if 237 breaks):
* 240 or 245 calls
* Preferred expiry: This week or next week
* Thesis: Break above CALL wall targets 240–245 zone where GEX resistance sits.
Bearish Options Setup (only if 230 breaks):
* 230 puts or 225 puts
* Preferred expiry: This week
* Thesis: Falling below PUT support opens a fast drop to 225 or even 216.
Neutral / Scalp Plan:
* Straddle not ideal due to spacing between support/resistance.
* Better to trade direction once 237 or 230 breaks.
Summary
MU is shifting bullish but still sitting right underneath major GEX resistance. The key is whether price can break through 237–240. If it does, momentum could extend quickly. If not, price may chop back toward 232 or 230.
Disclaimer:
This is for educational purposes only and not financial advice. Always manage risk and confirm your own setups before trading.
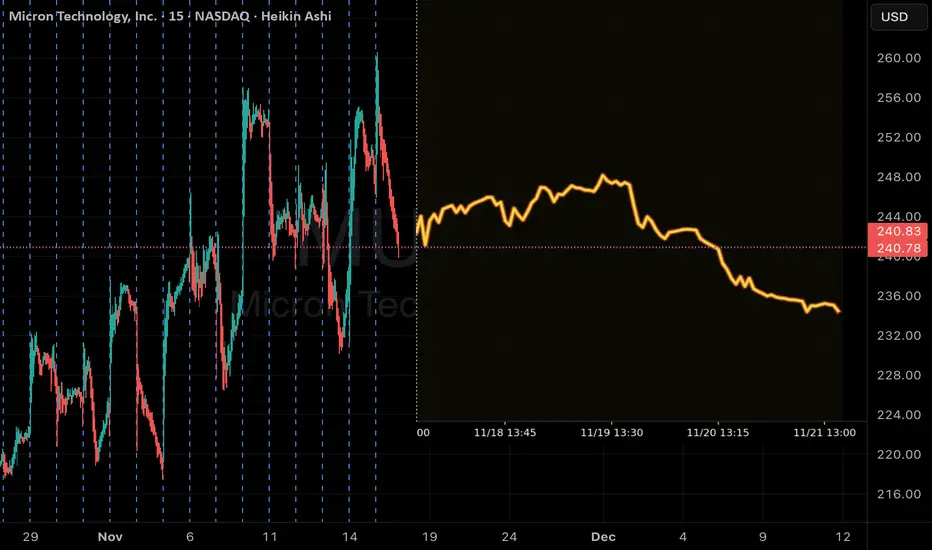
MU Weekly Trade: Oversold but Bears in ControlMU Weekly PUT Signal
Ticker: MU
Date: 2025-11-17
Signal: BUY PUTS
Confidence: 65% | Conviction: Medium
Strike: $242.50
Entry Range: $9.35 – $10.20 | Mid: $9.77
Target 1: $15.64 (≈60% gain)
Target 2: $19.54 (≈100% gain)
Stop Loss: $7.31 (≈25% risk)
Expiry: 2025-11-21 (4 days)
Position Size: 2% of portfolio
Technical Snapshot:
Current Price: $241.29 | VWAP: $245.29 → bearish alignment
Weekly Momentum: -3.90% (BEARISH)
RSI: 9.0 → extremely oversold, short-term bounce possible
EMA alignment: bearish → confirms downtrend
Weekly range: $230.16 – $260.58 → trading near support
Options Flow:
Put/Call Ratio: 3.19 → strong institutional bearish positioning
Unusual activity at $100 PUTs → potential hedge by institutions
Gamma risk: Moderate
AI / Market Vision:
Katy AI: NEUTRAL trend with bearish bias, 15-min chart shows consistent downward pressure
Predicted target: $237.73 | Stop: $244.91
Composite signals align with overall bearish outlook
News & Sentiment:
Rosenblatt raised PT to $300 (bullish)
Broader tech sentiment negative (Dow down 300+)
Hedge fund accumulation vs retail selling → mixed signals
Risk Level: MODERATE ⚠️
RSI oversold may trigger short-term bounce
Medium conviction → position sizing suggested at 2%
Monitor broader market; exit if price breaks above VWAP $245.29
Edge / Rationale:
Combines bearish AI projection, technical breakdown, and heavy put flow
Weekly expiry captures 4-day decline
Conservative strike (Δ ≈ 0.506) balances risk and probability
Tight stop loss protects capital while allowing normal volatility
QuantSignals V3 | MU Bullish Momentum TriggerMU QuantSignals Katy 1M Prediction 2025-11-13
Ticker: MU
Current Price: $236.59
Trend: BULLISH
Confidence: 75%
Volatility: 53.1%
Katy AI projects steady upward continuation with strong intraday momentum.
📈 AI Price Forecast
30-Minute Target: $239.89 (+1.39%)
Final Prediction: $243.85 (+3.07%)
AI shows a controlled, directional uptrend with high model confidence.
🎯 Trade Signal
Direction: CALLS
Entry: $236.59
Target: $242.40
Stop Loss: $233.04
Expected Move: +3.07%
Setup favors a clean bullish continuation move aligned with both trend and AI projection.
📊 Summary
1 bullish signal generated
1/1 model analyses successful
Strong alignment between trend, price action, and AI momentum path

MU - Flying Out The GatesFlying out the gates today - up 6% as Nasdaq showing signs of bottoming ❗️
If Nasdaq is bottoming then this impulsive move may be the start of the next wave up.
And it may be more impulsive than the last 🧐.
This analysis is shared for educational purposes only and does not constitute financial advice. Please conduct your own research before making any trading decisions.

mu has toppedwe will soon witness a pull back on mu to support.as of now we are seeing highs but look at the hidden macd divergence potential 40% so be careful and dont get trapped at the top.

How to Trade and Make Extra Income with a Full-Time JobAt QuantSignals (QS), we’re proud to have a diverse global community — members from every country, every profession, and every walk of life.
Some of our traders dedicate their full day to the markets, while others are working professionals with limited time who still want to build wealth and generate extra income through trading.
This article is for the latter group — the busy professionals who want to trade smartly and efficiently without sacrificing their full-time careers.
Below are three proven approaches to trading successfully while working a full-time job.
1️⃣ The “Morning Power” Strategy — Trade the First Hour
If your schedule allows, the first hour after the market opens is often the most volatile and active period of the day.
Overnight news, economic data, and institutional orders all hit the tape at once — creating strong directional moves.
This is where the #💹live-kline-signal from QS shines.
Our proprietary AI, trained on billions of price action data points, provides a 2-hour prediction window, giving traders a clear picture of the potential move ahead.
All you need to do is:
Enter when the market starts moving in the direction of the kline prediction.
Manage or close the trade within one hour.
💡 Time commitment: Around 1 hour
💡 Goal: Capture morning volatility with AI precision
💡 Edge: Use data-driven forecasts instead of emotions
Repeat this consistently with proper risk management, and it can become a powerful daily income routine.
2️⃣ The “Evening Income” Strategy — Trade the Last Hour or Overnight
If you can’t trade in the morning, the final hour (“power hour”) is another prime opportunity.
Liquidity returns, institutions position for the close, and volatility picks up again.
You can apply the same #💹live-kline-signal strategy for short-term trades.
But there’s also a way to earn while you sleep — using the #💰live-credit-spread-signal.
This screener selects the top 9 credit spread trade ideas each day. After the market closes, volatility tends to drop, creating ideal conditions for income through time decay (theta) and IV collapse.
💡 Time commitment: 30 minutes before or after the close
💡 Goal: Generate passive overnight income
💡 Edge: Make the market work for you while you rest
It’s not about catching every move — it’s about leveraging time and stability.
3️⃣ The “Set & Forget” Strategy — Swing and Long-Term Trading
For those who prefer not to watch the market daily, QS offers several mid-to-long-term AI signal channels:
#📈live-swing-signal – typically 2–4 week trades
#💼live-stock-signal – directional stock ideas
#🚀live-leap-signal – long-dated options plays (6–12 months)
These strategies let you “set and forget,” checking in occasionally while the AI tracks and updates the signals automatically.
💡 Time commitment: Weekly or monthly review
💡 Goal: Build wealth passively
💡 Edge: Leverage institutional-grade AI for timing and selection
Final Thoughts
Trading doesn’t have to be a full-time profession — it can be a structured side income stream when powered by the right technology.
With QS, you can choose the trading style that fits your lifestyle:
Morning trader — capitalize on volatility.
Evening trader — earn while you sleep.
Swing investor — grow long-term wealth passively.
The key is discipline + data + consistency.
QS gives you the AI advantage to trade smarter, not longer.

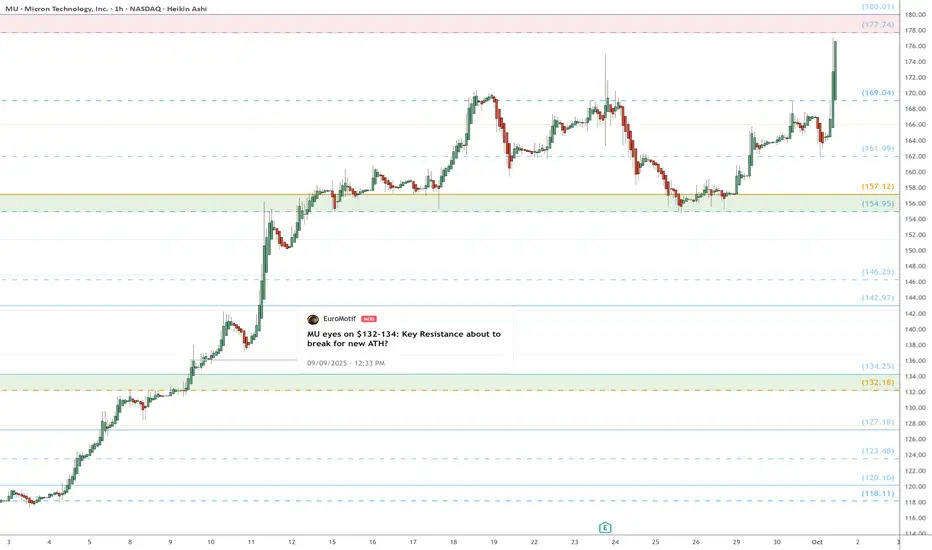
MU heads up into $180: Dual Fib Resistance could make for a TOPMU has been flying even higher than its brethren.
Approaching key Resistance zone $177.74-180.01
Look for a Dip-to-Fib (likely) or Break-n-Retest.
.
See "Related Pubications" for previous charts such as this EXACT BOTTOM call:
Hit BOOST and FOLLOW for more such PRECISE and TIMELY charts.
=========================================================
.
$MU is going to correct at least 10%. CEO sold many shares and technically it is a double trend line overshoot.
Odds are Micron will trade lower soon.
MU QuantSignals V3 Weekly 2025-11-09MU QuantSignals V3 Weekly 2025-11-09
MU Weekly Signal | 2025-11-09
• Direction: BUY CALLS | Confidence: 58%
• Expiry: 2025-11-14 (5 days)
• Strike Focus: $235.00
• Entry Range: $5.00
• Target 1: $7.35
• Stop Loss: $3.43
• Weekly Momentum: BULLISH (+4.61% 1W)
• Flow Intel: Neutral | PCR 1.04
• 🔴 HIGH RISK WARNING: Use only small position size due to lower confidence and high uncertainty.
⚖️ Compliance: Educational commentary for QS Premium members only. No financial advice.
🎯 TRADE RECOMMENDATION
Direction: BUY PUTS
Confidence: 58%
Conviction Level: LOW
🧠 ANALYSIS SUMMARY
Katy AI Signal: NEUTRAL with bearish bias - predicts price declining from $239.91 to $236.43 over the week with 50% confidence. Time series shows consistent downward trajectory from Nov 11-13 with multiple -1%+ declines predicted.
Technical Analysis: Stock at 99.8% of weekly range suggesting overbought conditions. Recent +4.61% weekly gain indicates potential pullback. Strong bullish weekly momentum but extreme range positioning creates reversal risk.
News Sentiment: Neutral to slightly positive with Wells Fargo raising price target to $300. However, semiconductor sector faces headwinds from potential trade restrictions mentioned in TSMC/Nvidia news.
Options Flow: Neutral PCR at 1.04 with unusual activity at $180 puts suggests some bearish hedging. Low gamma risk environment allows for cleaner directional moves.
Risk Level: HIGH - Katy's 50% confidence indicates weak signal strength. Extreme range positioning creates whipsaw risk.
💰 TRADE SETUP
Expiry Date: 2025-11-14 (5 days)
Recommended Strike: $235.00
Entry Price: $4.90 - $5.10
Target 1: $7.35 (50% gain from entry)
Target 2: $9.80 (100% gain from entry)
Stop Loss: $3.43 (30% loss from entry)
Position Size: 2% of portfolio
⚡ COMPETITIVE EDGE
Why This Trade: Combines Katy's bearish prediction with technical overbought conditions at ra
Image
QS Analyst
APP
— 12:08 AM
nge extremes
Timing Advantage: Entry at weekly range highs with 5-day expiry captures predicted downward momentum
Risk Mitigation: Conservative strike selection with balanced delta provides cushion against volatility
🚨 IMPORTANT NOTES
Katy's 50% confidence requires extra caution - this is a low-conviction trade
Monitor for any bullish catalyst that could invalidate the bearish thesis
Consider smaller position size than typical weekly plays due to weak signal strength
Be prepared to exit early if price holds above $240 resistance
⚠️ KATY CONFLICT EXPLANATION
Weekly Directional Guidance recommends BUY CALLS but Katy AI predicts bearish movement to $236.43. Following the primary directive to align with Katy's prediction, I'm overriding the composite bullish bias. Katy's time series shows consistent downward pressure from Nov 11-13 with multiple -1%+ moves predicted, providing clearer directional insight than the composite score.
📊 TRADE DETAILS 📊
🎯 Instrument: MU
🔀 Direction: PUT (SHORT)
🎯 Strike: 235.00
💵 Entry Price: 5.00
🎯 Profit Target: 7.35
🛑 Stop Loss: 3.43
📅 Expiry: 2025-11-14
📏 Size: 2.0
📈 Confidence: 58%
⏰ Entry Timing: N/A
🕒 Signal Time: 2025-11-09 03:08:12 EST
🔴 HIGH RISK WARNING: Use only small position size due to lower confidence and high uncertainty.
