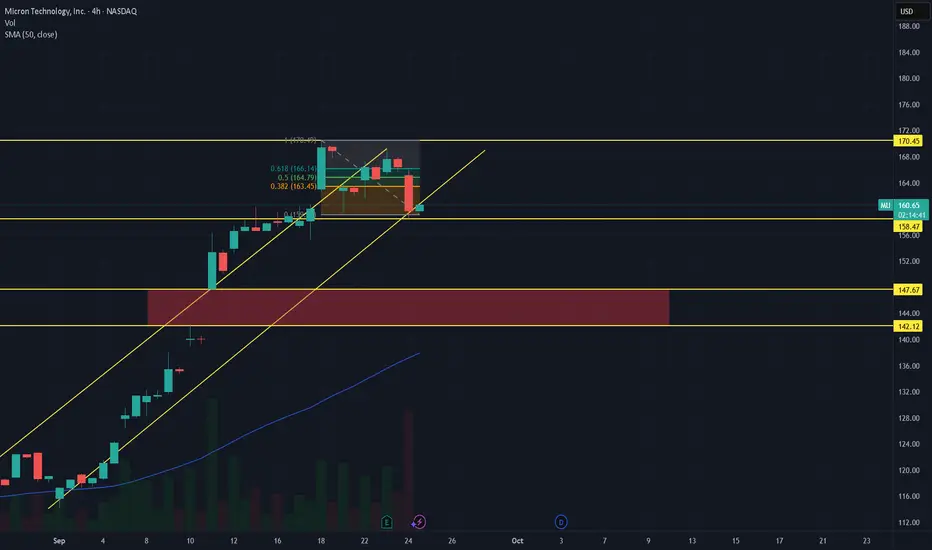
$MU - possible breakout above $170MU - Stock continues to move higher post earnings testing all time highs area around $170. Looking for breakout move post $170 for a move towards $185 and $200. Stock is looking strong a indicator level
Trade ideas
Analysis of MU Shares Following Earnings ReportAnalysis of MU Shares Following Earnings Report
Memory chip manufacturer Micron Technology (MU) published a positive financial report for Q4 of fiscal year 2025 on 23 September:
→ Q4 Revenue: Actual = $11.32 billion, up 46% compared with the same period last year.
→ Adjusted Earnings Per Share (EPS): Actual = $3.03 (analysts’ expectations = $2.87).
The main driver behind these strong results was heightened demand for high-performance memory needed for data centres and AI model training. Micron also published an optimistic outlook, forecasting revenue of between $12.2 billion and $12.8 billion in the next quarter.
Despite strong results and guidance, the share price reaction in the first week after publication has been moderate. Trading volumes were significantly above average, yet the price did not rise. Why?
1 → It is worth noting that Micron shares have nearly doubled in value since the start of 2025, which may indicate “bull fatigue.”
2 → A significant portion of the positive expectations tied to the AI boom is already priced into the current valuation.
Technical analysis shows more bearish signals.
Technical Analysis of MU Shares
Since early April, Micron shares have shown staggering growth of approximately 150%, with:
→ Price fluctuations forming an ascending channel (shown in blue). After breaking through the key resistance level at $130 in early September, the price rose towards the upper boundary of the channel, which now acts as resistance.
→ During this rise, the price exceeded the previous all-time high; however, further progress has clearly slowed. It is possible that the news of the record high, combined with a strong earnings report, created a buying frenzy that allowed large shareholders to take profits, thereby placing pressure on the price.
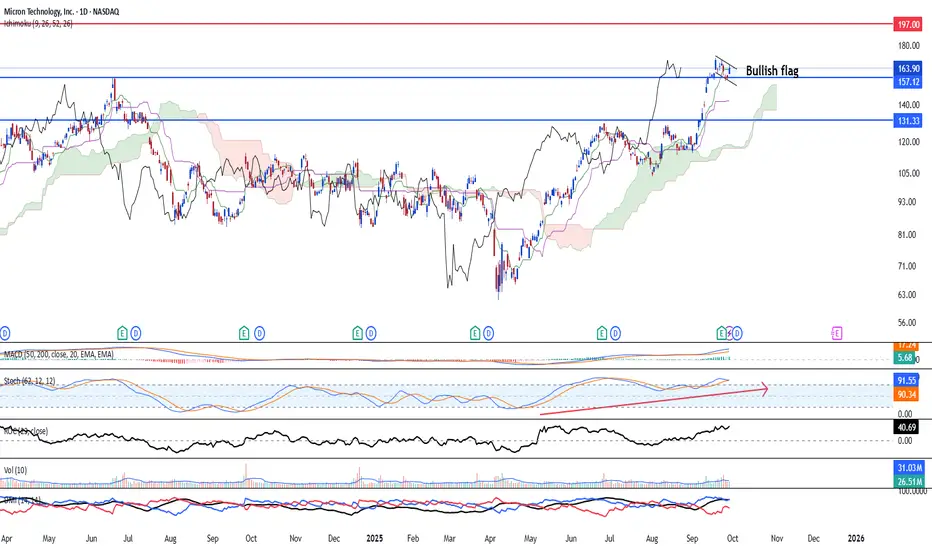
From a bullish perspective, the chart shows a correction pattern in the form of a “bull flag” (marked in red), suggesting a potential breakout and continuation of growth.
However, given the above, there are grounds to expect a deeper correction — for example, towards the median of the current channel, supported by a wide $135–150 zone (marked in purple), where the price previously rose particularly quickly, highlighting an imbalance in favour of buyers.
This article represents the opinion of the Companies operating under the FXOpen brand only. It is not to be construed as an offer, solicitation, or recommendation with respect to products and services provided by the Companies operating under the FXOpen brand, nor is it to be considered financial advice.
Further upside expected for Micron NASDAQ:MU is looking at a potential upside continuation after rising beyond our wildest expectation. Upside is likely to continue as a potential bullish flag was seen closing above the resistance turned support at 157.12. Strong continuation may see a ush to 197.00 level in the enar to mid-term. Momentum indicators across long, mid and short are healthy and rising.
Micron Technology - New all time highs!💰Micron Technology ( NASDAQ:MU ) is heading for new highs:
🔎Analysis summary:
More than a decade ago, Micron Technology entered into a significant long term rising channel pattern. Recently, we witnessed an expected rally of about +120%, perfectly rejecting support. But with the current all time high retest, we will also see a bullish breakout in the near future.
📝Levels to watch:
$140
SwingTraderPhil
SwingTrading.Simplified. | Investing.Simplified. | #LONGTERMVISION

MU Micron to go loongggg !!!I see support line @ is very very strong..
With good financial and goods TA i think it will be going up to the moon soon.
NASDAQ:MU
NASDAQ:MU
NASDAQ:MU
NASDAQ:MU
NASDAQ:MU
NASDAQ:MU
NASDAQ:MU
NASDAQ:MU
NASDAQ:MU
NASDAQ:MU
NASDAQ:MU
To the moon and beyond !!!

$MU a chart I don't likeSo, as I have been trying my hand at stock with Technical Analysis, it's definitely harder than I thought. I definitely do not like these charts for the simple reason that they all have Huge Gaps in them with new all-time highs. No real resistance and no real support. With all the Perma bulls in the market chatter, and market manipulation by Market Movers and News Update it's hard to gauge where to put your money. What a good entry point is. Like in what I describe in my AMEX:SPY report. You will see let's say a reverse cup and handle and you think ok this should have a reversal but Trump and his Perma bull following will just say yea no economy is great we are doing great, and the Markets just follow. Now your Put entry is down. Market is crying for a correction. AI investors and CEO'S are ignoring the AI bubble. While I see that there should be a gap down, there is still a potential that current price will bounce off the current support and break through to $700. But in this market, you just never know. I need to save enough money so I can get into crypto I would most likely perform better on there.
THIS IS NOT FINANCIAL ADVICE, AS ALWAYS ITS MY OPINION BE SAFE.
Pre Market Movers and News - BABA SurgingDiscussing some of the news related events today.
What do traders need to watch today?
Looking at SPY, Oil, Baba, NVDA, BE, MU, LAC

$MU Tradespoon – Long Entry $168.60Tradespoon model generated long signal for NASDAQ:MU . Predicted range: $168.60–$176.40. Trend: +3.16%. NASDAQ:MU

Micron Hit a Record High This Week. Here's What Its Chart SaysMicron Technology NASDAQ:MU hit an all-time intraday high this week as multiple analysts raised their price targets for the tech firm amid strong demand from AI-related companies for MU's high-bandwidth memory. What does technical and fundamental analysis say the Micron prepares to report earnings next week?
Let's see:
Micron's Fundamental Analysis
All of the GPUs and high-end chips destined for data centers and generative artificial intelligence need memory -- lots and lots of memory.
This has created shortages (and higher prices) for high-bandwidth, high-speed DRAM chips, and Micron is the only U.S.-based source for those. The company's top competitors for that high-end marketing are both South Korean firms, SK Hynix and Samsung Electronics.
When Micron reports fiscal Q4 earnings after the bell next Tuesday, Wall Street will be looking for the firm to report $2.86 of adjusted earnings per share on $11.1 billion of revenue.
That would crush the firm's own guidance, and also represent a 142.4% gain from the $1.18 in adjusted EPS that MU reported in the year-ago period. Revenue would also have grown some 43% from the $7.75 billion the company rang up in the same period last year.
And of the 21 sell-side analysts that I can find that cover MU, 20 have revised their earnings estimates for the period higher since the current quarter began. (One analyst lowered his forecast.)
This week, Vijay Rakesh of Mizuho Securities (rated at five stars out of a possible five by TipRanks) reiterated his "Buy" rating on MU while increasing his target price to $182 from $155.
A day earlier, CJ Muse of Cantor Fitzgerald and Timothy Acuri of UBS (both also rated at five stars by TipRanks) reiterated their own "Buy" ratings. Both also increased their target prices from an identical $155 to $185.
Micron's Technical Analysis
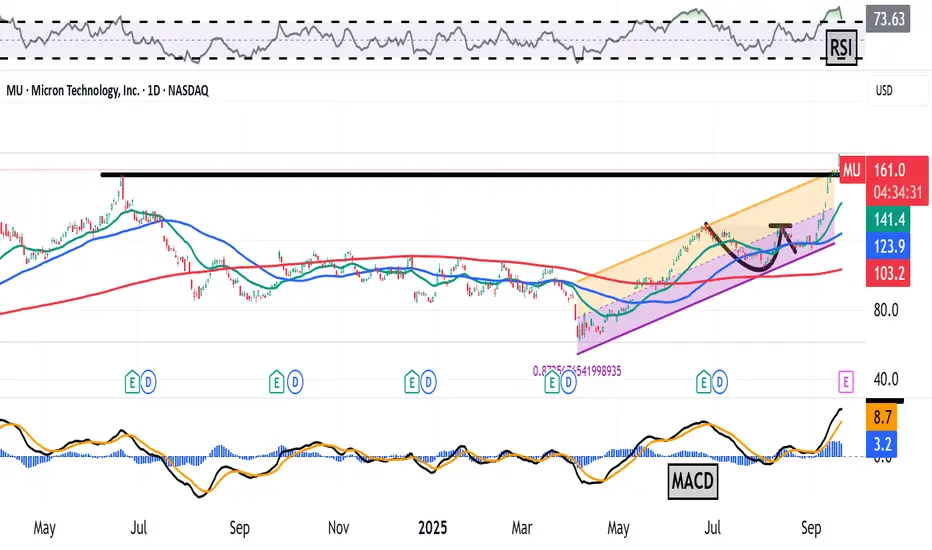
Now let's look at MU's chart going back to April 2024 and running through Tuesday afternoon:
Readers will note that MU recently broke out of a "cup-with-handle" pattern that it had been in from June through mid-August and that had a $128 pivot.
The stock does now appear to be extended from that, which might rattle a few investors (especially as MU heads into earnings).
Meanwhile, MU's Relative Strength Index (the gray line at the chart's top) is in a technically overbought state.
That said, the stock's daily Moving Average Convergence Divergence indicator (or "MACD," marked with black and gold lines and blue bars at the chart's bottom) is looking extremely bullish.
The histogram of the 9-day EMA (the blue bars) is now well above zero, as are both the 12-day Exponential Moving Average (or "EMA," marked with a black line) and the 26-day EMA (the gold line). The 12-day EMA is pulling away from the 26-day line. All of that is very bullish technically.
MU did, in fact, crash through its previous all-time high of June 2024 (marked with a heavy black line) on Thursday.
That level (about $157) was the pivot for the bulls that has now been triggered technically. (That's where all of those elevated target prices from the above-mentioned analysts came from.)
The downside pivot? It's a long way down at Micron's 50-day EMA (marked with a blue line at $121.50 in the chart above).
All in, I would not be surprised if MU remains volatile heading into and coming out of next week's earnings report.
(Moomoo Technologies Inc. Markets Commentator Stephen “Sarge” Guilfoyle was long MU at the time of writing this column.)
This article discusses technical analysis, other approaches, including fundamental analysis, may offer very different views. The examples provided are for illustrative purposes only and are not intended to be reflective of the results you can expect to achieve. Specific security charts used are for illustrative purposes only and are not a recommendation, offer to sell, or a solicitation of an offer to buy any security. Past investment performance does not indicate or guarantee future success. Returns will vary, and all investments carry risks, including loss of principal. This content is also not a research report and is not intended to serve as the basis for any investment decision. The information contained in this article does not purport to be a complete description of the securities, markets, or developments referred to in this material. Moomoo and its affiliates make no representation or warranty as to the article's adequacy, completeness, accuracy or timeliness for any particular purpose of the above content. Furthermore, there is no guarantee that any statements, estimates, price targets, opinions or forecasts provided herein will prove to be correct.
The Analyst Ratings feature comes from TipRanks, an independent third party. The accuracy, completeness, or reliability cannot be guaranteed and should not be relied upon as a primary basis for any investment decision. The target prices are intended for informational purposes only, not recommendations, and are also not guarantees of future results.
Moomoo is a financial information and trading app offered by Moomoo Technologies Inc. In the U.S., investment products and services on Moomoo are offered by Moomoo Financial Inc., Member FINRA/SIPC.
TradingView is an independent third party not affiliated with Moomoo Financial Inc., Moomoo Technologies Inc., or its affiliates. Moomoo Financial Inc. and its affiliates do not endorse, represent or warrant the completeness and accuracy of the data and information available on the TradingView platform and are not responsible for any services provided by the third-party platform.
MicronExited MU on this 4.5% wick.
Taking a small loss on this trade but pretty much back at entry.
The company releases earnings on Tuesday and with the volatility of the market this could swing the stock either way.

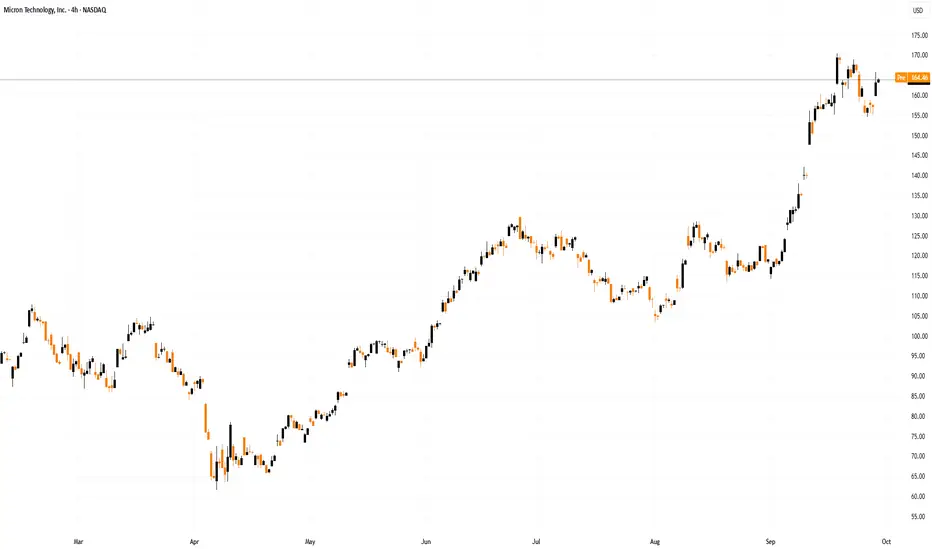
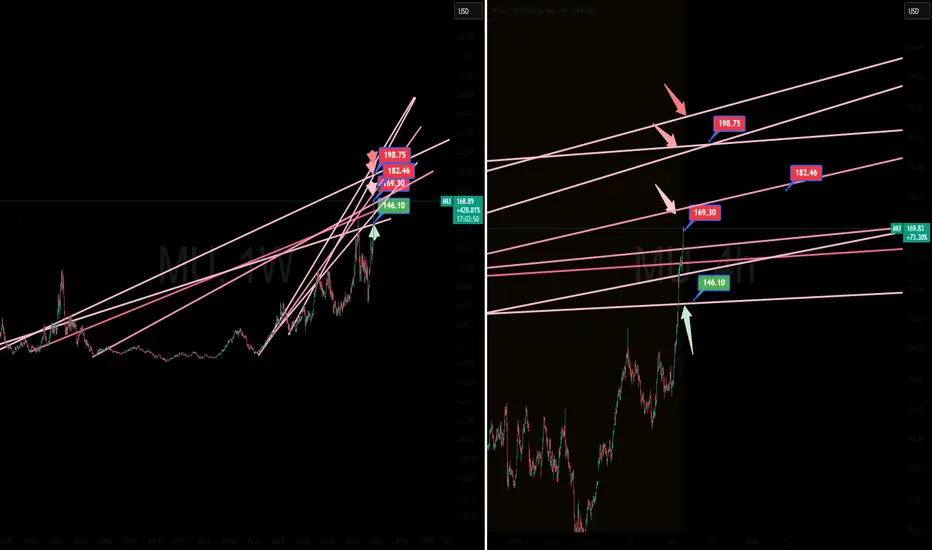
Micron(MU) Ceiling: A Technical Thesis for a Short PositionThis trade is a strategic short on Micron Technology (MU), grounded in a technical analysis thesis of price rejection at a significant trendline resistance. The core premise is that the strong upward momentum has exhausted itself as the price has encountered a formidable ceiling, signaling an imminent corrective move. The trade is designed to capitalize on the anticipated retracement to a key underlying support level.
The price of MU has been on a strong ascent, but this rally has recently culminated in a critical inflection point. As shown by the red arrow on the chart, the price has failed to convincingly break above a major resistance trendline, which has been respected over a long-term horizon. This rejection is a high-probability bearish signal, indicating a shift in market control from buyers to sellers.
Trade Idea:
Entry Signal: The short position is initiated at the point of rejection, precisely where the red arrow is located.
Exit Strategy: The primary profit target is set at the strong support level, marked by the green support line.
MU hitting $200?Micron technology could be hitting $200 due to an uptrend and a upcomign earnings date. Higher highs, higher lows, which indicates a strong bullish uptrend, and the breakout from 130 followed by a massive volume is also indicating a bullish uptrend. The price is ridign the upper bollinger band, indicating strong momentum.

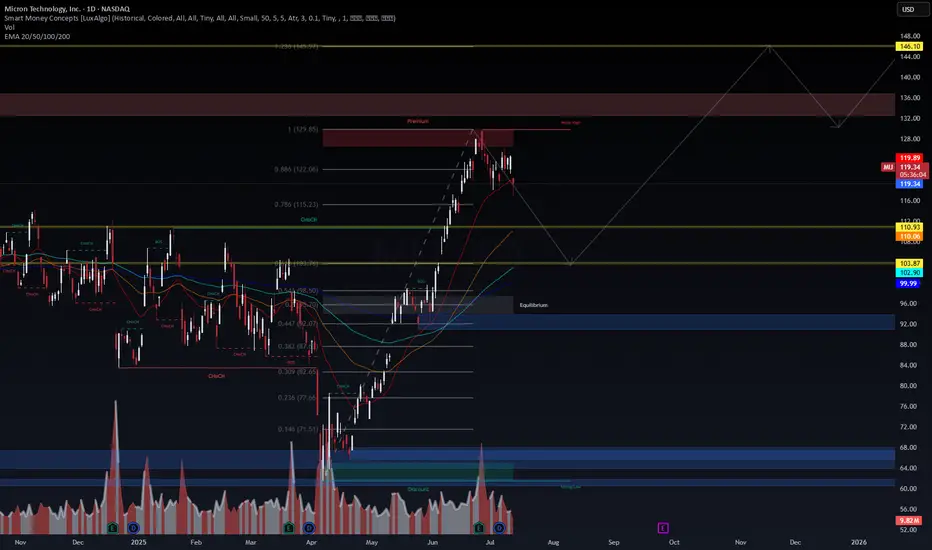
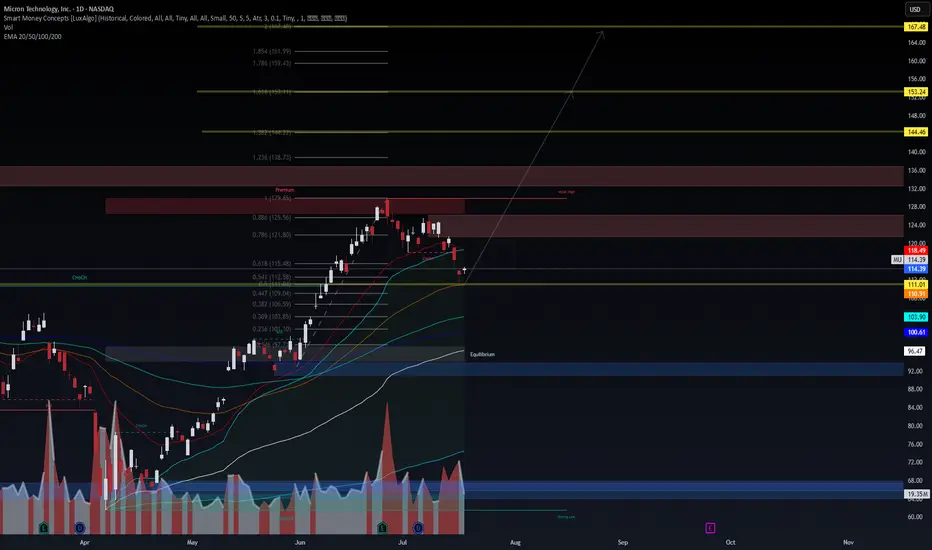
MU - SMC Premium Zone Rejection | Targeting Equilibrium Before E📉 MU - SMC Premium Zone Rejection | Targeting Equilibrium Before Expansion
🔍 WaverVanir DSS Framework | SMC x Fibonacci x Liquidity
We just observed rejection from the Premium zone and 0.886 Fibonacci retracement near $129.85, aligning with prior weak high liquidity. Price has shown signs of distribution, with a likely retracement to the Equilibrium zone ($98–$103) before any bullish continuation.
🧠 Key Observations:
ChoCH confirmed post-run to premium → Expect redistribution
Price rejected 0.886 (122.06) and weak high near 129
Strong EMA confluence forming around 110–103 range
Equilibrium zone and volume spike near $98–$103 offers valid demand
Long-term target remains open toward Fib extension @ $146.10, but only after deeper retrace
📉 Short Bias Until $103–$98 Demand Zone
🔁 Then flip long if bullish confirmation appears
📊 VolanX Market View:
Structure: Breaker → ChoCH → Premium Rejection
Bias: Retracement → Reaccumulation
Tools Used: Smart Money Concepts, Fib, Volume, EMA stack, Liquidity zones
🧠 Built using the WaverVanir DSS, designed to navigate institutional flows and macro-infused setups. We’re tracking this sequence closely across cycles.
📅 Chart Date: July 14, 2025
📍 Asset: NASDAQ:MU (Micron Technology Inc.)
💬 Follow @WaverVanir for macro-aware, alpha-focused setups.
📈 Disclaimer: Not financial advice. Educational content only.
#SMC #OptionsFlow #FibLevels #LiquidityZones #WaverVanir #VolanX #TradingView #MU #Micron #TechStocks #InstitutionalTrading #VolumeProfile #ChoCH #Equilibrium #SmartMoney
$MU – Preparing for Institutional Flow Reversal?📈 NASDAQ:MU – Preparing for Institutional Flow Reversal?
Micron ( NASDAQ:MU ) is at a crucial confluence zone, holding just above the 0.618 retracement ($115.48) after a CHoCH breakdown. With EMAs (20/50/100/200) aligning under price, the technical setup hints at an early-stage liquidity grab before potential expansion.
🔹 Technical Outlook
Current price: $114.39
CHoCH confirmed near premium zone ($129–$138)
Rejection from 0.886 Fibonacci zone ($125.56)
Holding above major EMAs (Support: $110.91 / $111.01)
Volume spike suggests accumulation at equilibrium ($100–$103)
🔹 VolanX DSS Probability Scenarios
LSTM-GRU model predicts price recovery toward $135–$140 by late August
Short-term risk zones: $108.67 stop loss (weekly), upside target $124.69
1W Neural Forecast: +5.9% upside bias, confidence skewed toward recovery
VaR (99%): -8.68% max drawdown exposure
🔹 Macro & Risk Consideration
Semiconductor cyclicals are catching tailwinds from AI infrastructure demand
Risk: High beta and earnings volatility; monitor inflation & Fed communication
Volatility: 52.4% annualized – risk remains elevated
🔹 Strategic Play (Not Financial Advice)
Entry Zone: $111–$114 (support + VWAP alignment)
SL: $108.67 (below weekly structure)
TP Zones: $124.69, $138.73, $153.24 (Fib levels)
💡 “We don’t trade the price, we trade the narrative. Follow the Smart Money—ride the VolanX Protocol.”
#Micron NASDAQ:MU #TradingView #SMC #LSTM #AITrading #SmartMoney #TechStocks #Fibonacci #OptionsFlow #VolanX #WaverVanir #MarketIntel #InstitutionalTrading #ProbabilityBasedTrading
Micron Tech. to $285MU is targeting $285, with it's new support zone from $167.
Like every other tech stock it's important to note there's a big pullback coming likely the end of this year/beginning 2026. However I'm quite confident MU will reach it's target before that happens.
Good luck!

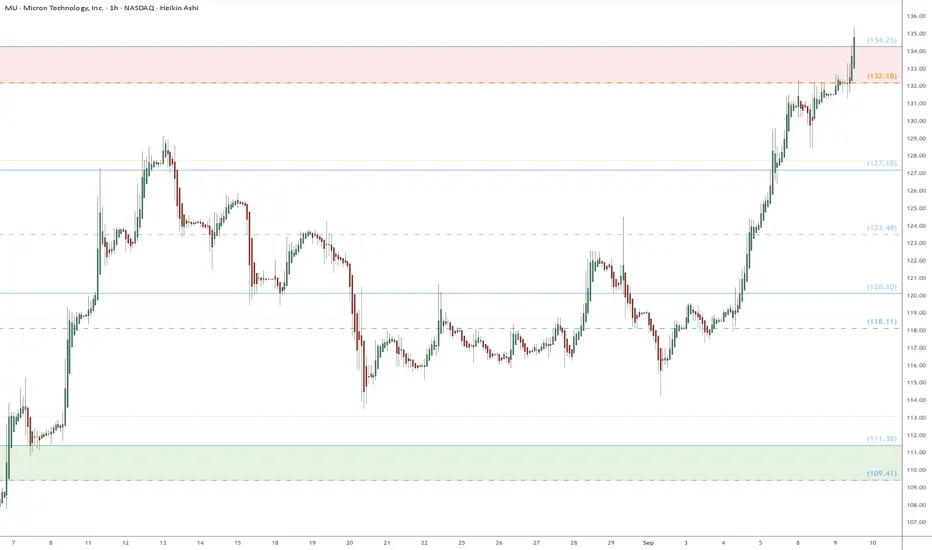
MU eyes on $132-134: Key Resistance about to break for new ATH? MU has been recovering nicely after our last trade call.
Looks ready to break key Resistance at $132.18-134.25
Looking for a Break-n-Retest to start next leg to new ATH.
.
Previous Analysis that caught the EXACT BOTTOM:
Hit BOOST and FOLLOW for more such PRECISE and TIMELY charts.
=========================================================
.
MU Micron Technology Options Ahead of EarningsIf you haven`t bought MU before the rally:
Now analyzing the options chain and the chart patterns of MU Micron Technology prior to the earnings report next week,
I would consider purchasing the 155usd strike price Calls with
an expiration date of 2025-10-17,
for a premium of approximately $9.55.
If these options prove to be profitable prior to the earnings release, I would sell at least half of them.
Disclosure: I am part of Trade Nation's Influencer program and receive a monthly fee for using their TradingView charts in my analysis.

MU - POTENTIAL 52-WEEK HIGHMU - CURRENT PRICE : 118.89
The share price rises almost 111% from the bottom of 07 April 2025 to the high of 26 June 2025. Then the stock starts to pullback. It retraces at Fibonacci golden ratio of 38.2%. Last Friday the stock rises and closed as a bullish LONG WHITE CANDLE with high volume - indicating strong buying interest from investors/traders.
This bullish scenario is also supported by some other indicators such as :
1) Price above 50-days EMA
2) Price closes above ICHIMOKU CLOUD (KUMO)
3) RSI reading at 58.95 (above 50 considered bullish)
4) Price is trading near 52-week high level
With all the evidence mentioned above, now may considered as a buying opportunity. 1st target should be one- or two-dollar below the actual 52-week high resistance level.
ENTRY PRICE : 115 - 119
TARGET : 128 and 135
SUPPORT : 108

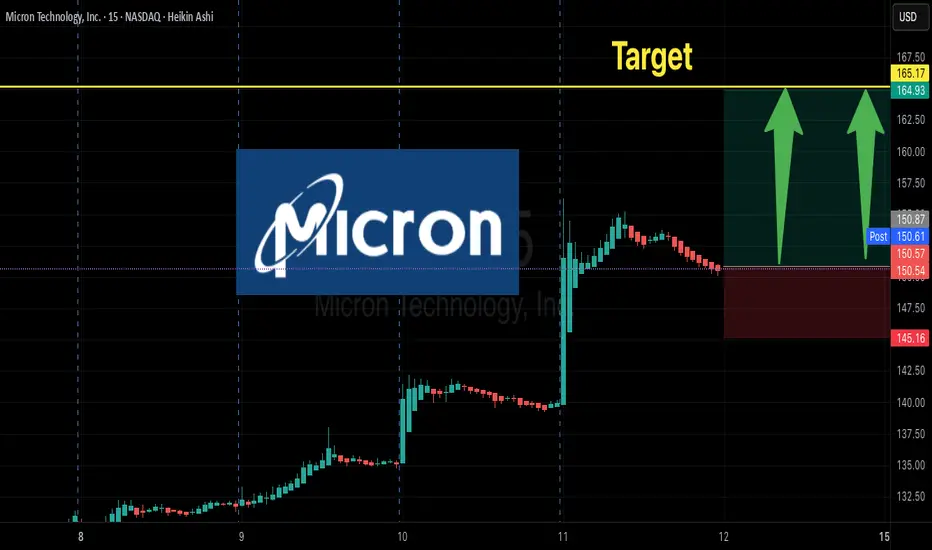
MU LEAP Alert: $165 Call Poised for Multi-Month Run!
🚀 **MU LEAP ALERT – \$165 CALL**
**Target:** 200% Premium 💎 | **Stop:** \$16.25 🛑 | **Entry:** \$25.00 ⏰
💡 **Thesis:**
* AI + Memory Cycle Recovery 🔋💻
* Weekly RSI \~77 → Strong momentum 📈
* Low VIX (\~15) → Perfect for long-term LEAPs 🌟
* Institutional volume spike supports upside 🔥
🎯 **Trade Details:**
* **Instrument:** MU
* **Direction:** CALL (LONG)
* **Strike:** \$165
* **Expiry:** 2026-09-18
* **Entry Price:** \$25.00
* **Profit Target:** \$75 (200% Gain)
* **Stop Loss:** \$16.25 (35%)
* **Size:** 1 Contract
* **Confidence:** 75% ✅
* **Entry Timing:** Market Open ⏱️
⚠️ **Risks / Notes:**
* Overbought RSI → potential pullback ⚡
* Sector correlation → weakness can affect MU 🏭
* Weekly monitor & partial profit-taking recommended 🪙
💥 **Action Plan:**
1️⃣ Buy at open \$25.00 (or use limit at ask)
2️⃣ Partial exit at +100% premium
3️⃣ Trail remainder toward +200% target
4️⃣ Exit if weekly closes < \$147
🔥 **High-Conviction, Long-Term Bullish Play!**
\#MU #LEAP #OptionsTrading #AI #TechStocks
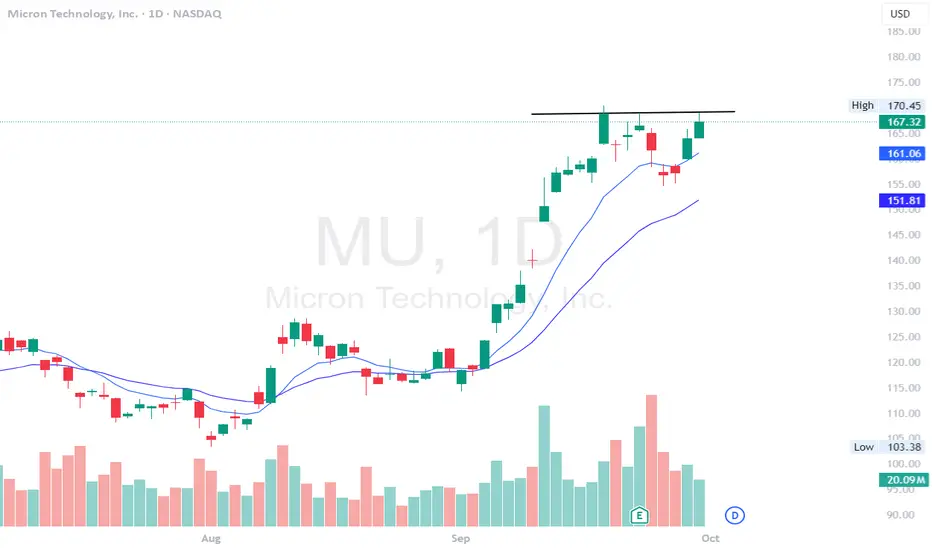
Micron Technology Inc (MU) – Breakout AlertWe’re currently seeing a breakout setup forming on MU. A confirmation on the next candle would strengthen this move, potentially paving the way for further momentum.
Using technicals, the target price of $145 comes from the Fibonacci expansion. Specifically, it aligns with the 61.8% level from the most recent move up, making it the first key Fibonacci target to watch.
If price action holds, I’m anticipating a swing toward $145. Patience and confirmation are key here. Let’s see how the next session unfolds.

Micron Technology Moving HigherAs you can see, MU has been in an uptrend for a little while now. It broke above a key trendline, consolidated for a bit, then broke even higher last Friday and confirmed with a full candle close above yesterday. I can see MU going to the top orange line which is a long-term weekly trend line in the mid $180's.

MU $135 Call Swing – Momentum + Low VIX Edge!
🚀 **MU Swing Alert! \$135 Call Play 💎📈**
💡 **Momentum + Low VIX → Short-Term Bullish Swing Opportunity!**
**Trade Snapshot:**
* **Instrument:** MU
* **Strategy:** Buy Call (single-leg, naked)
* **Strike:** \$135
* **Expiry:** 2025-09-19 (12-day swing)
* **Entry Price:** \$2.97 (ask at open)
* **Profit Targets:** \$4.46 (+50%) initial, \$5.94+ (+100%) secondary
* **Stop Loss:** \$1.79 (\~40% of premium)
* **Size:** 1 contract
* **Confidence:** 70%
**Rationale:**
* 🔹 Daily RSI 71.4 → bullish momentum
* 🔹 Multi-timeframe positive returns → short-term upside probability
* 🔹 Low VIX → favorable for momentum swing trades
* 🔹 Preferred strike \$135 balances leverage & probability
**Key Notes:**
* Entry at market open; consider slight limit inside ask if desired
* Tight stop & defined profit targets to manage risk
* Max hold: exit by 2025-09-17 unless momentum confirms continuation
* Watch for low volume → could reduce move reliability
📊 **Summary:** Models converge on \$135 call as the optimal swing trade with 12-day horizon. Favorable technicals + low VIX + manageable risk make this a high-probability momentum play.

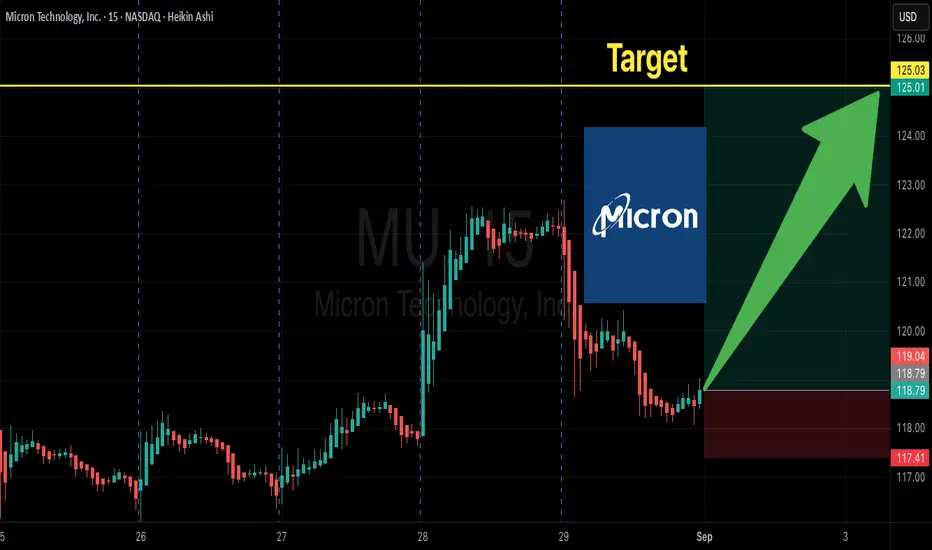
Smart Money Flow into $MU Calls – Earnings Week Opportunity
# 🚀 MU Earnings Play (Aug 31 – Sep 5) 🚀
💎 **Moderate Bullish | 65% Conviction** 💎
🎯 **Trade Setup**
📊 **Ticker**: \ NASDAQ:MU
🔀 **Direction**: CALL 📈
🎯 **Strike**: \$125.00
📅 **Expiry**: 2025-09-05
💵 **Entry**: 0.68 (ASK)
📦 **Size**: 1 contract (risk 💸 \$68)
🛑 **Stop**: 0.34 (−50%)
🎯 **Target**: 1.36 (+100%)
⏰ **Timing**: Market open 8/31 → exit by 9/4 (Thu)
⚡ **Why Bullish?**
* 📈 RSI strong on weekly (68.7); neutral daily (52.3) → upside potential
* 🔥 Options flow: C/P ratio 1.23, heavy \$124–125 call action
* 🧘 Low VIX (\~15) → cheap premium, low gamma risk
* 🤖 Consensus from 5 AI models = **Moderate Bullish**
✅ **Plan**: Buy ONLY if MU holds above **\$120** w/ healthy opening volume. Cut fast if <\$120.
---
### 📌 Suggested Tags
\#MU #Micron #EarningsPlay #OptionsTrading #CallOptions #WeeklyOptions #BullishSetup #MomentumTrading #TradeIdeas #StockMarket 🚀📊