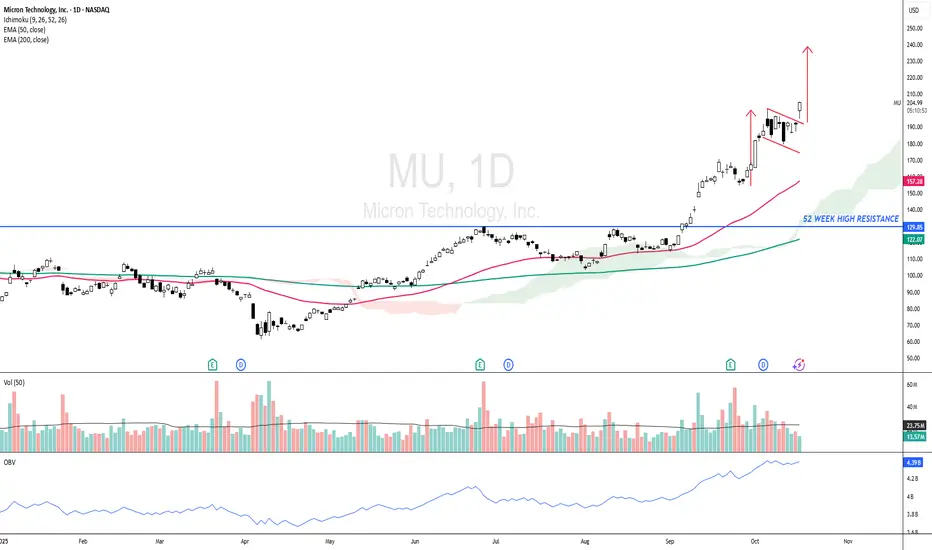
MU - Bullish Continuation Pattern ?MU - CURRENT PRICE : 204.00 - 205.00
The stock has surged nearly 70% since my previous buy call, demonstrating strong bullish momentum. I shared the link of my previous trading idea for reading purpose.
Currently, the price has broken out of a bullish flag pattern, indicating the potential for another leg higher. Estimate target of this bullish flag pattern is around 237.00. Support level is 179.00 (the low of 10 October 2025 candle).
Take note also this ascending in prices is also supported by rising in On Balance Volume (OBV) readings. (Look at the blue line at bottom of chart)
ENTRY PRICE : 203.00 - 205.00
TARGET : 237.00
SUPPORT : 179.00
Trade ideas
Can Memory Chips Become Geopolitical Weapons?Micron Technology has executed a strategic transformation from commodity memory producer to critical infrastructure provider, positioning itself at the intersection of AI computing demands and U.S. national security interests. The company's fiscal 2025 performance demonstrates this pivot's success, with data center revenue surging 137% year-over-year to comprise 56% of total sales. Gross margins expanded to 45.7% as the company captured pricing power across both its advanced High-Bandwidth Memory (HBM) portfolio and traditional DRAM products. This dual-margin expansion stems from an unusual market dynamic: capacity reallocation toward specialized AI chips has created artificial supply constraints in legacy memory, driving price increases exceeding 30% in some segments. In contrast, HBM3E capacity through 2026 is already sold out.
Micron's technological leadership centers on power efficiency and manufacturing innovation that translate directly into customer economics. The company's HBM3E solutions deliver bandwidth exceeding 1.2 TB/s while consuming 30% less power than competing 8-high configurations—a critical advantage for hyperscale operators managing electricity costs across massive data center footprints. This efficiency edge is reinforced by scientific advances in manufacturing, particularly the mass production deployment of 1γ DRAM using Extreme Ultraviolet lithography. This node transition delivers over 30% more bits per wafer than previous generations while reducing power consumption by 20%, creating structural cost advantages that competitors must match through heavy R&D investment.
The company's unique position as America's sole HBM manufacturer has transformed it from a component supplier to a strategic national asset. Micron's $200 billion U.S. expansion plan, supported by $6.1 billion in CHIPS Act funding, aims to produce 40% of its DRAM capacity domestically within a decade. This geostrategic positioning grants preferential access to U.S. hyperscalers and government projects requiring secure, domestically sourced components, a competitive moat independent of immediate technological specifications. Combined with a robust intellectual property portfolio covering 3D memory stacking and secure boot architectures, Micron has established multiple defensive layers that transcend typical semiconductor industry cycles, validating an investment thesis for sustained high-margin growth through structural rather than cyclical drivers.

MU: price reached key mid-term resistance Price has shown strong follow-through from the support zone mentioned in the October update and has now reached the top of a key mid-term resistance area.
As long as price is closing below 219, I’m watching for selling pressure to start building and for a potential pullback toward the 160 area / rising 50-day MA.
Chart:
Previously:
• On resistance zone (Oct 3):
Chart:
www.tradingview.com
• On mid-term support (Sep 30):
Chart:
www.tradingview.com
• On pullback potential (Aug 12):
Chart:
www.tradingview.com
• On resistance (Aug 7):
www.tradingview.com
• On support zone (Jul 22):
www.tradingview.com
• On downside potential (Jul 15):
www.tradingview.com

$MU — Compression before collapse?NASDAQ:MU — Compression before collapse? ⚡
Tight wedge forming under key resistance ($205).
If the wedge breaks down, next liquidity pool sits near $192 → $174.
Bulls must reclaim $207 fast or the structure stays bearish.
#Micron #Semiconductors #VolanX #WaverVanir #TechnicalAnalysis
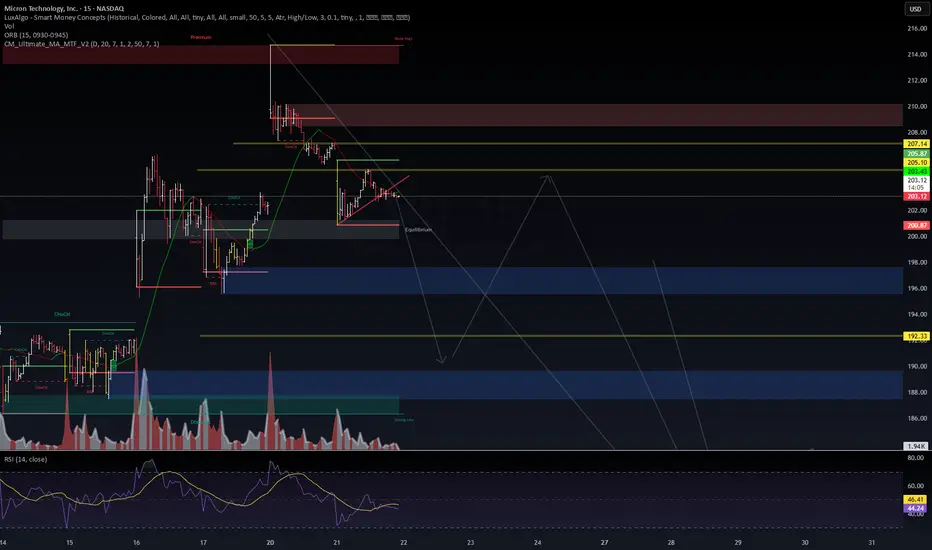
Full Observation MU, Let's see how this one plays out. NASDAQ:MU — Golden pocket rejected 📉
Bears taking control again after a weak bounce into the 0.618 zone (≈$206).
Watching for continuation to $197 → $192 range if momentum stays bearish.
A close above $206.5 invalidates this setup.
#Micron #Semiconductors #VolanX #TechnicalAnalysis

New Setup: MUI have a swing trade setup signal for MU . I'm looking to enter long if the stock can manage to stay above my "BUY" line. If triggered, I will then place a stop-loss at the "SL" line. If it eventually reaches my "TP" line, I will sell half my position and utilize the 8-EMA as my trailing stop. This setup will remain valid for five trading days or until it closes below the "SL", whichever comes first.

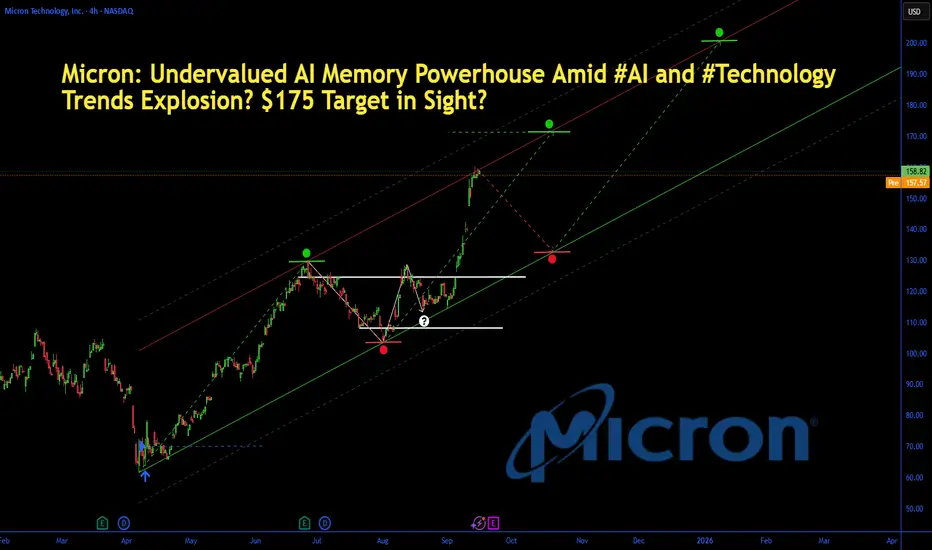
Micron: AI Memory Powerhouse Amid #AI and #TechnologyMicron: Undervalued AI Memory Powerhouse Amid #AI and #Technology Trends Explosion? $175 Target in Sight?
Micron (MU) shares hit a new 52-week high of $158.28 today, up 1.2% amid surging AI data center demand and institutional buying, with the stock soaring 86.8% YTD on memory chip tailwinds.
As Q4 fiscal 2025 earnings loom on September 23—projecting 58% EPS jump to $1.29 on $8.7B revenue—analysts have hiked targets to $175, implying 10%+ upside. Just as #AI racks up 17K mentions and #technology trends with 46K on X today (fueled by AI video generators and chip hype), Micron's HBM3E tech for Nvidia GPUs positions it as the undervalued play in the $200B+ semiconductor memory market.
But with forward P/E at 12x, is MU set to ride the AI wave higher, or will supply gluts cap the rally? Let's unpack the fundamentals, SWOT, charts, and setups for September 17, 2025.
Fundamental Analysis
Micron's resurgence is driven by AI hyperscaler demand for high-bandwidth memory (HBM), with Q2 fiscal 2025 revenue hitting $9.3B (up 93% YoY) and data center sales doubling to $2.2B.
Analysts forecast 2025 revenue of $38.5B (up 50% YoY), as HBM capacity ramps to 250K wafers amid #AI trends exploding on social media. Trading at 18% below fair value per DCF, MU's undervaluation shines with gross margins rebounding to 37%—but cyclical DRAM risks could flare if PC demand softens.
- **Positive:**
- AI boom ties into today's #technology hype, with HBM3E sales projected at $2.5B in FY2025; institutional stakes rising signal confidence.
- Q2 EPS beat of $1.18 (vs. $1.00 est.) and $1.6B FCF undervalues the stock at 12x forward earnings vs. sector 25x.
- Broader trends in edge AI and automotive chips position MU for 20%+ CAGR, amplified by #AI video generator virality.
- **Negative:**
- Inventory overhang from prior cycles could pressure pricing, clashing with #technology optimism if China trade tensions escalate.
- High capex ($8B annually) strains balance sheet if AI adoption slows amid economic jitters.
SWOT Analysis
**Strengths:** Leadership in DRAM/NAND with 20%+ market share; AI-optimized HBM tech generates 50%+ gross margins, amplified by #AI relevance in data centers.
**Weaknesses:** Cyclical exposure to consumer electronics; $7.8B net debt limits agility in a volatile #technology market.
**Opportunities:** HBM ramp to meet Nvidia/AMD demand unlocks $5B+ revenue; undervalued at 12x P/E amid 58% EPS growth and #AI boom on X.
**Threats:** Supply chain disruptions from geopolitics; competition from Samsung/SK Hynix capitalizing on #technology trends.
Technical Analysis
On the daily chart, MU is in a parabolic uptrend, breaking 52-week highs after consolidating above $140 support, with volume exploding on AI news and mirroring #AI volatility spikes. The weekly shows a cup-and-handle breakout from summer lows, now accelerating higher. Current price: $158.28, with VWAP at $156 as intraday pivot.
Key indicators:
- **RSI (14-day):** At 74, overbought but fueled by momentum—watch for consolidation amid #technology surges. 📈
- **MACD:** Bullish crossover with surging histogram, confirming AI-driven acceleration; minimal divergence. ⚠️
- **Moving Averages:** Price crushing 21-day EMA ($145) and 50-day SMA ($130), golden cross locked in.
Support/Resistance: Key support at $150 (recent breakout and 50-day SMA), resistance at $165 (Fib extension) and $175 (analyst target). Patterns/Momentum: Cup-and-handle targets $200; strong buy signals. 🟢 Bullish signals: Volume on earnings hype. 🔴 Bearish risks: Overbought RSI could pull back 5-8% on profit-taking.
Scenarios and Risk Management
- **Bullish Scenario:** Smash $165 on earnings beat or #AI catalyst targets $175 short-term, then $200 by year-end. Buy dips to $150 for entries tied to tech trends.
- **Bearish Scenario:** Breach $150 eyes $140 (200-day EMA); supply news amid #technology fade could retrace 10%.
- **Neutral/Goldilocks:** Range-bound $150–$165 if data mixed and #AI cools, ideal for straddles pre-earnings.
Risk Tips: Set stops 3% below support ($145.50) to tame volatility. Risk 1-2% per trade. Diversify with NVDA or SMH to hedge semi correlations.
Conclusion/Outlook
Overall, a bullish bias if MU holds $150, supercharged by today's #AI and #technology trends, cementing its undervalued status with 40%+ upside on memory demand. But watch September 23 earnings for confirmation—this fits September's chip rotation amid viral AI hype. What’s your take? Bullish on MU amid #AI chip trends or fading the rip? Share in the comments!
Micron (MU) Trade Plan | Resistance, Pullback & Thief Setup📊 Micron Technology (MU) | Thief Plan Swing/Day Trading Setup
⚡ Why This Plan?
Micron Technology (MU) has been showing strong momentum in 2025, driven by AI demand, DRAM revenue growth, and favorable fundamentals. The Thief Plan Strategy (layering entries + tactical exits) is designed to adapt to both swing & day trading setups, balancing technical signals with fundamental catalysts.
🎯 Thief Technical Trading Plan
Strategy: Hull Moving Average Pullback ➝ Bullish Bias
Entry Method (Layering Style): Multiple buy limit layers
$122.00
$124.00
$126.00
$128.00
(You may increase/decrease layers based on your own plan & risk)
Stop Loss: Thief SL reference @ $115.00
Adjust based on your own risk tolerance & style.
Target Zone: $146.00 (resistance barricade / overbought trap zone — best to “escape” before exhaustion).
⚠️ Note: These levels are educational references. Manage your own SL/TP — trade at your own risk.
📈 Fundamental & Sentiment Insights
52-Week Range: $61.54 – $131.41
Market Cap: $147.02B
YTD Performance: +50.4% 🚀
Investor Sentiment:
Analyst Consensus: Moderate Buy 🟢
21 Buy | 5 Hold | 1 Sell | 2 Strong Buy
Avg. PT: $147.54 (+12.3% Upside)
Institutional Ownership: 80.84%
Fear & Greed Index: 39/100 → Fear 😨
Earnings & Growth:
Q3 FY2025 EPS: $1.91 (Beat by $0.34)
Revenue Growth YoY: +58.2%
DRAM Revenue: +51% YoY (AI-driven)
Net Margin: 18.41%
Debt-to-Equity: 0.30 (healthy)
Dividend Yield: 0.4%
🌍 Macro & Market Drivers
AI Boom: HBM demand projected at $10B run-rate.
Data Center DRAM: +63% YoY expected in Q4 FY2025.
US CHIPS Act & Tariffs: Long-term tailwinds for domestic semiconductor players.
Competition: Samsung & SK Hynix applying pressure on margins.
🐂 Bullish vs 🐻 Bearish Outlook
Bullish Case (Long):
AI/Data Center demand ➝ strong revenue trajectory.
Valuation attractive (PE 23.6x vs peers 32x).
Analyst PTs reach as high as $200.
Bearish Case (Risk):
Memory market cyclicality ➝ volatile pricing.
Fear & Greed shows low confidence (39/100).
DCF suggests stock could be overvalued short-term.
📌 Summary
Outlook: Neutral ➝ Bullish short-term (AI strength offsets macro fear).
Catalyst: Q4 FY2025 Earnings (Sept 23, 2025).
Risk: Moderate (High Beta 1.47).
🔗 Related Assets to Watch
NASDAQ:NVDA - AI semiconductor sentiment indicator
NASDAQ:AMD - Semiconductor sector momentum
NASDAQ:SOXX - Semiconductor ETF for sector strength
NASDAQ:SMH - Alternative semiconductor ETF
NASDAQ:WDC - Memory sector correlation
✨ “If you find value in my analysis, a 👍 and 🚀 boost is much appreciated — it helps me share more setups with the community!”
#MU #Micron #Stocks #SwingTrade #DayTrading #ThiefPlan #Semiconductors #AI #TechStocks #TradingView

Buckle Up Buttercup - The Trend is Your FreindMU looking very powerful here on a monthly, quarterly and yearly chart. Intrinsic Value also values MU much higher. Stay tuned.

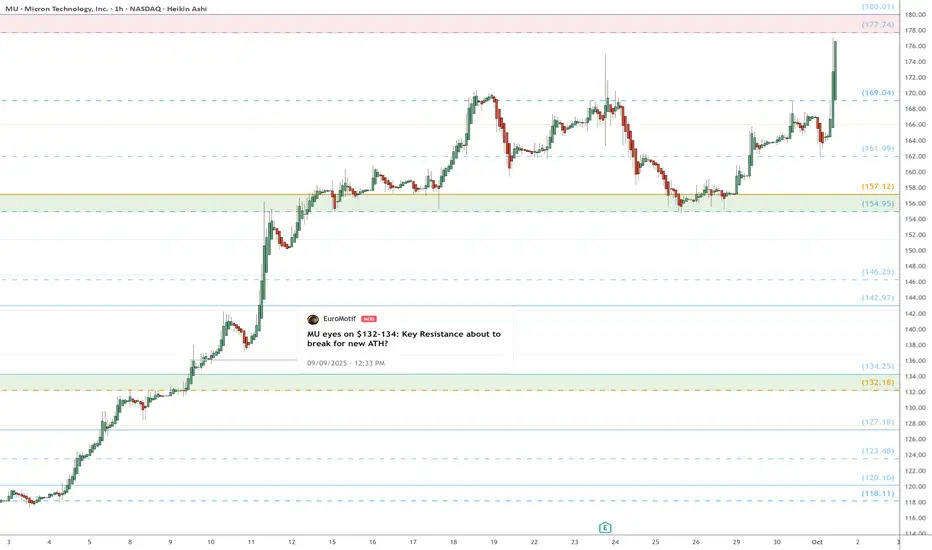
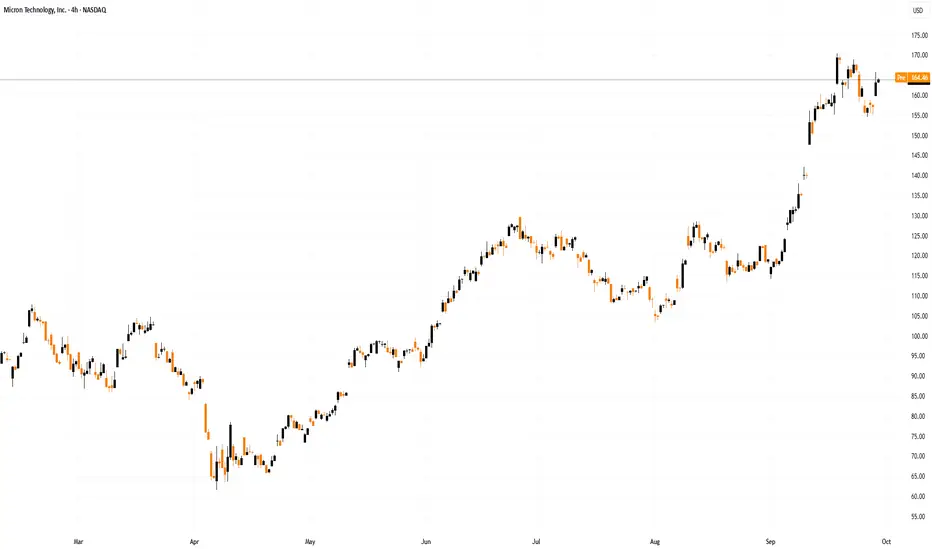
MU heads up into $180: Dual Fib Resistance could make for a TOPMU has been flying even higher than its brethren.
Approaching key Resistance zone $177.74-180.01
Look for a Dip-to-Fib (likely) or Break-n-Retest.
.
See "Related Pubications" for previous charts such as this EXACT BOTTOM call:
Hit BOOST and FOLLOW for more such PRECISE and TIMELY charts.
=========================================================
.
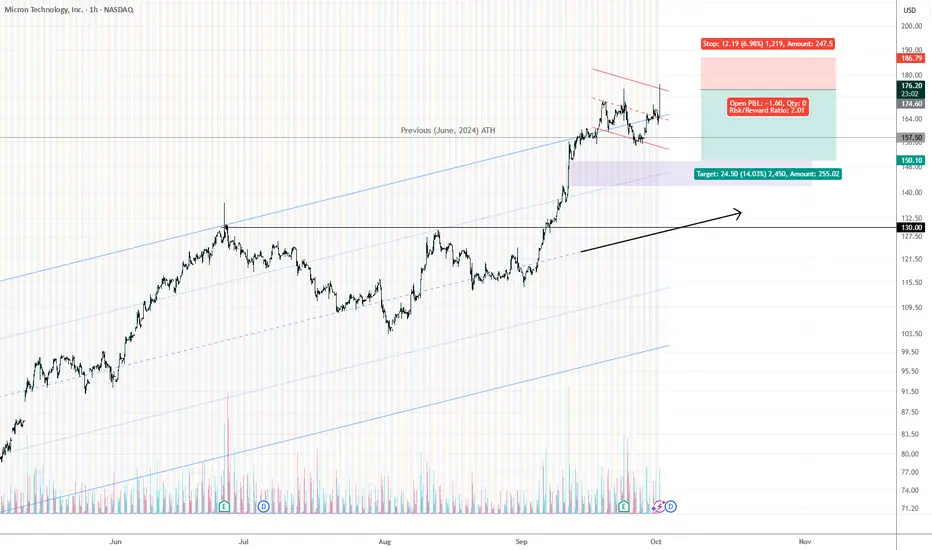
MU — Short: overboughtMU — Short: overbought → fade back into the channel
Context: After an extended run, price is stretched above the rising channel; local distribution under a minor descending channel. Expect mean-reversion back inside the broader channel.
Entry: 174–176
Stop: 186.8 (above channel top / recent spike)
Targets:
TP1: 157.5 (previous ATH / first support)
TP2: 150.0 (testing psycho level)
R/R: ≈ 1:2 toward TP2
Invalidation: Strong breakout and hold above 186.8.
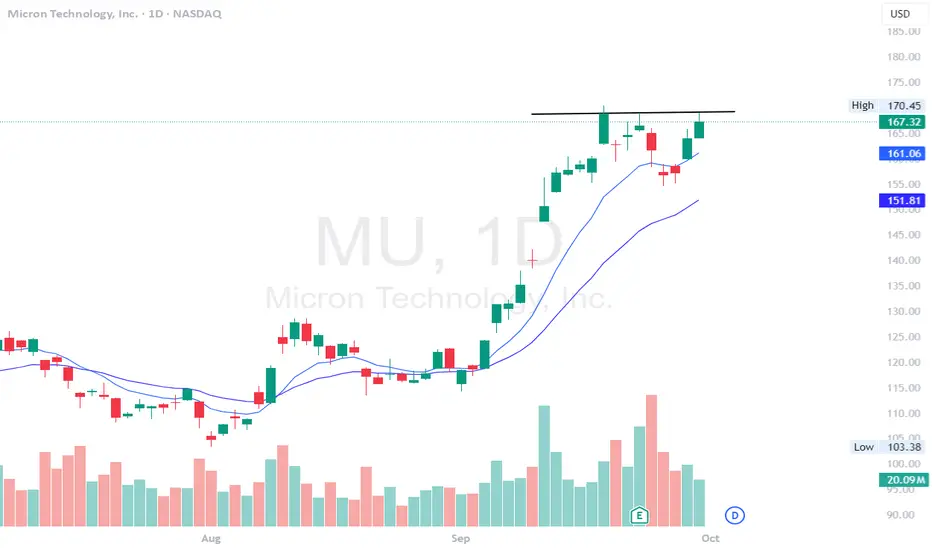
$MU - possible breakout above $170MU - Stock continues to move higher post earnings testing all time highs area around $170. Looking for breakout move post $170 for a move towards $185 and $200. Stock is looking strong a indicator level
Analysis of MU Shares Following Earnings ReportAnalysis of MU Shares Following Earnings Report
Memory chip manufacturer Micron Technology (MU) published a positive financial report for Q4 of fiscal year 2025 on 23 September:
→ Q4 Revenue: Actual = $11.32 billion, up 46% compared with the same period last year.
→ Adjusted Earnings Per Share (EPS): Actual = $3.03 (analysts’ expectations = $2.87).
The main driver behind these strong results was heightened demand for high-performance memory needed for data centres and AI model training. Micron also published an optimistic outlook, forecasting revenue of between $12.2 billion and $12.8 billion in the next quarter.
Despite strong results and guidance, the share price reaction in the first week after publication has been moderate. Trading volumes were significantly above average, yet the price did not rise. Why?
1 → It is worth noting that Micron shares have nearly doubled in value since the start of 2025, which may indicate “bull fatigue.”
2 → A significant portion of the positive expectations tied to the AI boom is already priced into the current valuation.
Technical analysis shows more bearish signals.
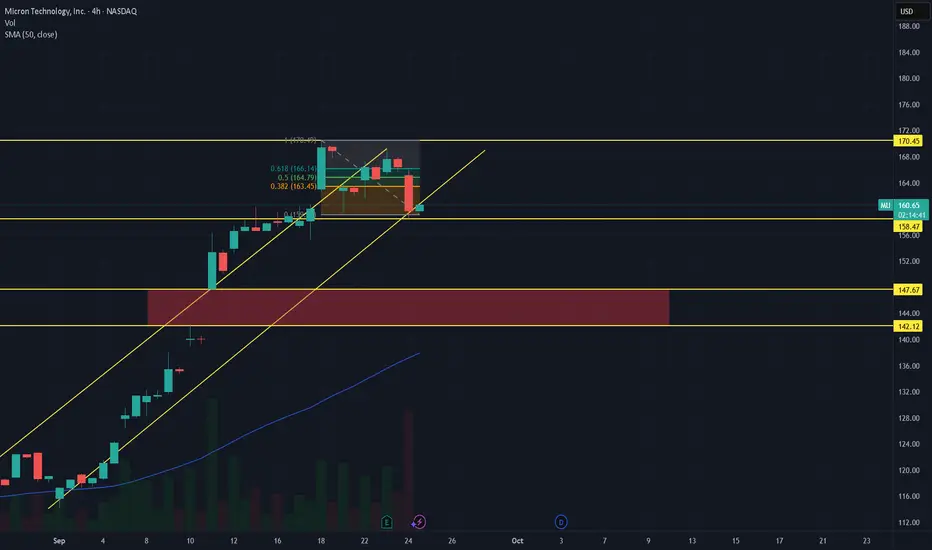
Technical Analysis of MU Shares
Since early April, Micron shares have shown staggering growth of approximately 150%, with:
→ Price fluctuations forming an ascending channel (shown in blue). After breaking through the key resistance level at $130 in early September, the price rose towards the upper boundary of the channel, which now acts as resistance.
→ During this rise, the price exceeded the previous all-time high; however, further progress has clearly slowed. It is possible that the news of the record high, combined with a strong earnings report, created a buying frenzy that allowed large shareholders to take profits, thereby placing pressure on the price.
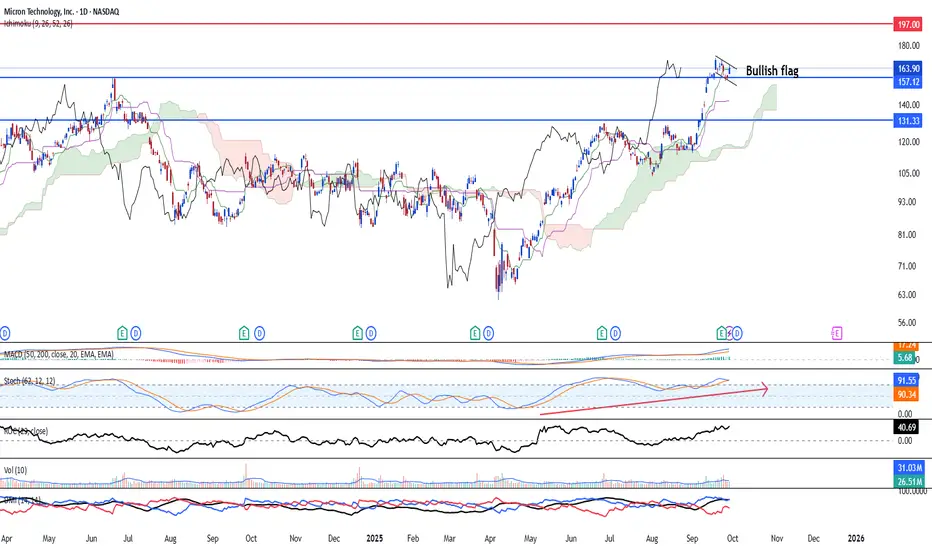
From a bullish perspective, the chart shows a correction pattern in the form of a “bull flag” (marked in red), suggesting a potential breakout and continuation of growth.
However, given the above, there are grounds to expect a deeper correction — for example, towards the median of the current channel, supported by a wide $135–150 zone (marked in purple), where the price previously rose particularly quickly, highlighting an imbalance in favour of buyers.
This article represents the opinion of the Companies operating under the FXOpen brand only. It is not to be construed as an offer, solicitation, or recommendation with respect to products and services provided by the Companies operating under the FXOpen brand, nor is it to be considered financial advice.
Further upside expected for Micron NASDAQ:MU is looking at a potential upside continuation after rising beyond our wildest expectation. Upside is likely to continue as a potential bullish flag was seen closing above the resistance turned support at 157.12. Strong continuation may see a ush to 197.00 level in the enar to mid-term. Momentum indicators across long, mid and short are healthy and rising.
Micron Technology - New all time highs!💰Micron Technology ( NASDAQ:MU ) is heading for new highs:
🔎Analysis summary:
More than a decade ago, Micron Technology entered into a significant long term rising channel pattern. Recently, we witnessed an expected rally of about +120%, perfectly rejecting support. But with the current all time high retest, we will also see a bullish breakout in the near future.
📝Levels to watch:
$140
SwingTraderPhil
SwingTrading.Simplified. | Investing.Simplified. | #LONGTERMVISION

MU Micron to go loongggg !!!I see support line @ is very very strong..
With good financial and goods TA i think it will be going up to the moon soon.
NASDAQ:MU
NASDAQ:MU
NASDAQ:MU
NASDAQ:MU
NASDAQ:MU
NASDAQ:MU
NASDAQ:MU
NASDAQ:MU
NASDAQ:MU
NASDAQ:MU
NASDAQ:MU
To the moon and beyond !!!

$MU a chart I don't likeSo, as I have been trying my hand at stock with Technical Analysis, it's definitely harder than I thought. I definitely do not like these charts for the simple reason that they all have Huge Gaps in them with new all-time highs. No real resistance and no real support. With all the Perma bulls in the market chatter, and market manipulation by Market Movers and News Update it's hard to gauge where to put your money. What a good entry point is. Like in what I describe in my AMEX:SPY report. You will see let's say a reverse cup and handle and you think ok this should have a reversal but Trump and his Perma bull following will just say yea no economy is great we are doing great, and the Markets just follow. Now your Put entry is down. Market is crying for a correction. AI investors and CEO'S are ignoring the AI bubble. While I see that there should be a gap down, there is still a potential that current price will bounce off the current support and break through to $700. But in this market, you just never know. I need to save enough money so I can get into crypto I would most likely perform better on there.
THIS IS NOT FINANCIAL ADVICE, AS ALWAYS ITS MY OPINION BE SAFE.
Pre Market Movers and News - BABA SurgingDiscussing some of the news related events today.
What do traders need to watch today?
Looking at SPY, Oil, Baba, NVDA, BE, MU, LAC

$MU Tradespoon – Long Entry $168.60Tradespoon model generated long signal for NASDAQ:MU . Predicted range: $168.60–$176.40. Trend: +3.16%. NASDAQ:MU

Micron Hit a Record High This Week. Here's What Its Chart SaysMicron Technology NASDAQ:MU hit an all-time intraday high this week as multiple analysts raised their price targets for the tech firm amid strong demand from AI-related companies for MU's high-bandwidth memory. What does technical and fundamental analysis say the Micron prepares to report earnings next week?
Let's see:
Micron's Fundamental Analysis
All of the GPUs and high-end chips destined for data centers and generative artificial intelligence need memory -- lots and lots of memory.
This has created shortages (and higher prices) for high-bandwidth, high-speed DRAM chips, and Micron is the only U.S.-based source for those. The company's top competitors for that high-end marketing are both South Korean firms, SK Hynix and Samsung Electronics.
When Micron reports fiscal Q4 earnings after the bell next Tuesday, Wall Street will be looking for the firm to report $2.86 of adjusted earnings per share on $11.1 billion of revenue.
That would crush the firm's own guidance, and also represent a 142.4% gain from the $1.18 in adjusted EPS that MU reported in the year-ago period. Revenue would also have grown some 43% from the $7.75 billion the company rang up in the same period last year.
And of the 21 sell-side analysts that I can find that cover MU, 20 have revised their earnings estimates for the period higher since the current quarter began. (One analyst lowered his forecast.)
This week, Vijay Rakesh of Mizuho Securities (rated at five stars out of a possible five by TipRanks) reiterated his "Buy" rating on MU while increasing his target price to $182 from $155.
A day earlier, CJ Muse of Cantor Fitzgerald and Timothy Acuri of UBS (both also rated at five stars by TipRanks) reiterated their own "Buy" ratings. Both also increased their target prices from an identical $155 to $185.
Micron's Technical Analysis
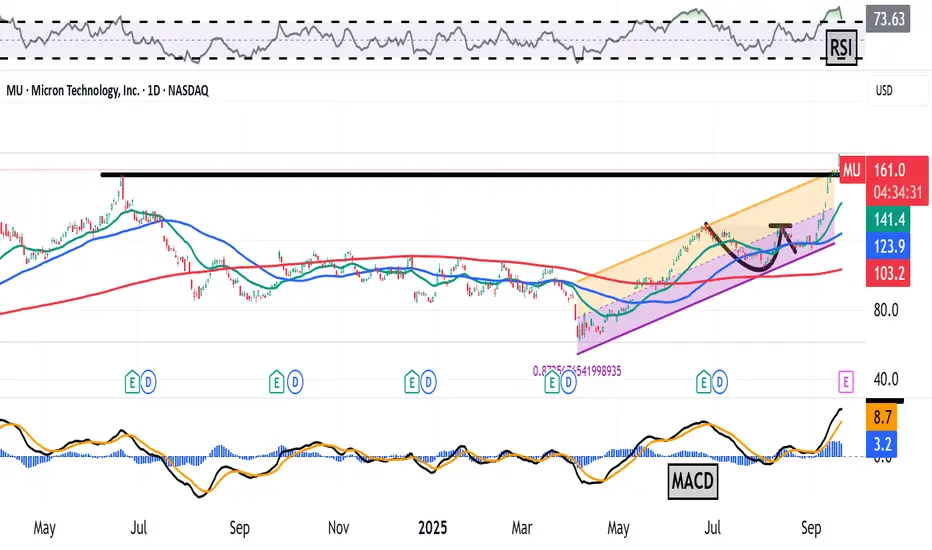
Now let's look at MU's chart going back to April 2024 and running through Tuesday afternoon:
Readers will note that MU recently broke out of a "cup-with-handle" pattern that it had been in from June through mid-August and that had a $128 pivot.
The stock does now appear to be extended from that, which might rattle a few investors (especially as MU heads into earnings).
Meanwhile, MU's Relative Strength Index (the gray line at the chart's top) is in a technically overbought state.
That said, the stock's daily Moving Average Convergence Divergence indicator (or "MACD," marked with black and gold lines and blue bars at the chart's bottom) is looking extremely bullish.
The histogram of the 9-day EMA (the blue bars) is now well above zero, as are both the 12-day Exponential Moving Average (or "EMA," marked with a black line) and the 26-day EMA (the gold line). The 12-day EMA is pulling away from the 26-day line. All of that is very bullish technically.
MU did, in fact, crash through its previous all-time high of June 2024 (marked with a heavy black line) on Thursday.
That level (about $157) was the pivot for the bulls that has now been triggered technically. (That's where all of those elevated target prices from the above-mentioned analysts came from.)
The downside pivot? It's a long way down at Micron's 50-day EMA (marked with a blue line at $121.50 in the chart above).
All in, I would not be surprised if MU remains volatile heading into and coming out of next week's earnings report.
(Moomoo Technologies Inc. Markets Commentator Stephen “Sarge” Guilfoyle was long MU at the time of writing this column.)
This article discusses technical analysis, other approaches, including fundamental analysis, may offer very different views. The examples provided are for illustrative purposes only and are not intended to be reflective of the results you can expect to achieve. Specific security charts used are for illustrative purposes only and are not a recommendation, offer to sell, or a solicitation of an offer to buy any security. Past investment performance does not indicate or guarantee future success. Returns will vary, and all investments carry risks, including loss of principal. This content is also not a research report and is not intended to serve as the basis for any investment decision. The information contained in this article does not purport to be a complete description of the securities, markets, or developments referred to in this material. Moomoo and its affiliates make no representation or warranty as to the article's adequacy, completeness, accuracy or timeliness for any particular purpose of the above content. Furthermore, there is no guarantee that any statements, estimates, price targets, opinions or forecasts provided herein will prove to be correct.
The Analyst Ratings feature comes from TipRanks, an independent third party. The accuracy, completeness, or reliability cannot be guaranteed and should not be relied upon as a primary basis for any investment decision. The target prices are intended for informational purposes only, not recommendations, and are also not guarantees of future results.
Moomoo is a financial information and trading app offered by Moomoo Technologies Inc. In the U.S., investment products and services on Moomoo are offered by Moomoo Financial Inc., Member FINRA/SIPC.
TradingView is an independent third party not affiliated with Moomoo Financial Inc., Moomoo Technologies Inc., or its affiliates. Moomoo Financial Inc. and its affiliates do not endorse, represent or warrant the completeness and accuracy of the data and information available on the TradingView platform and are not responsible for any services provided by the third-party platform.
MicronExited MU on this 4.5% wick.
Taking a small loss on this trade but pretty much back at entry.
The company releases earnings on Tuesday and with the volatility of the market this could swing the stock either way.

Micron(MU) Ceiling: A Technical Thesis for a Short PositionThis trade is a strategic short on Micron Technology (MU), grounded in a technical analysis thesis of price rejection at a significant trendline resistance. The core premise is that the strong upward momentum has exhausted itself as the price has encountered a formidable ceiling, signaling an imminent corrective move. The trade is designed to capitalize on the anticipated retracement to a key underlying support level.
The price of MU has been on a strong ascent, but this rally has recently culminated in a critical inflection point. As shown by the red arrow on the chart, the price has failed to convincingly break above a major resistance trendline, which has been respected over a long-term horizon. This rejection is a high-probability bearish signal, indicating a shift in market control from buyers to sellers.
Trade Idea:
Entry Signal: The short position is initiated at the point of rejection, precisely where the red arrow is located.
Exit Strategy: The primary profit target is set at the strong support level, marked by the green support line.
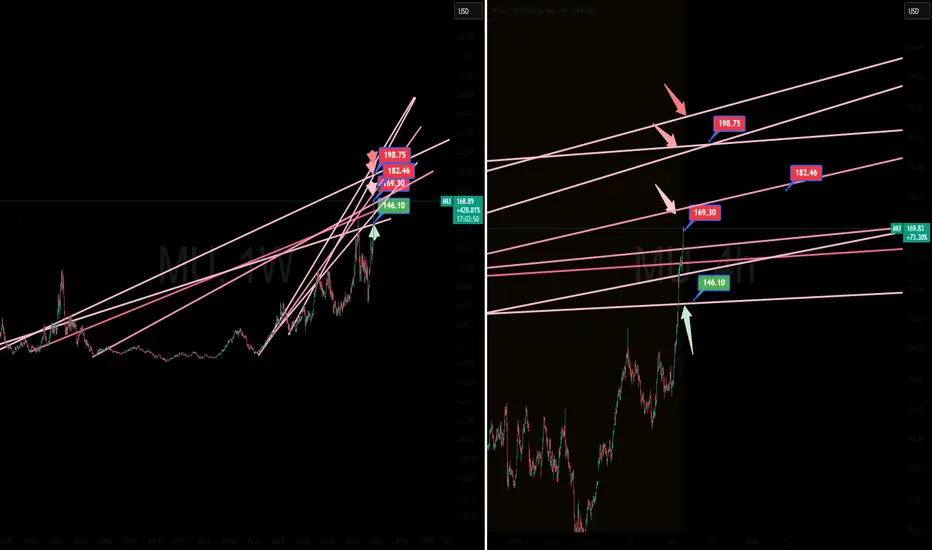
MU hitting $200?Micron technology could be hitting $200 due to an uptrend and a upcomign earnings date. Higher highs, higher lows, which indicates a strong bullish uptrend, and the breakout from 130 followed by a massive volume is also indicating a bullish uptrend. The price is ridign the upper bollinger band, indicating strong momentum.
