$NEM The BIG call So, I am finally going to share one of my big trades that I am going to use to try and grow my account it is NYSE:NEM , Newmont Corporation. It is an American Gold mining stock one of many they have all been performing especially well over the past six months and there is still a lot of signifi
Key facts today
1.65 USD
2.91 B USD
16.48 B USD
About Newmont Corporation
Sector
Industry
CEO
Thomas Palmer
Website
Headquarters
Denver
Founded
1921
ISIN
ARDEUT112570
FIGI
BBG000KXL5X3
Newmont Corp. engages in the exploration and acquisition of gold properties, containing copper, silver, lead, zinc or other metals. It operates through the following geographical segments: Canada, Mexico, Suriname, Argentina, Peru, Australia, Papua New Guinea, Ghana, and U.S. The company was founded by William Boyce Thompson on May 2, 1921 and is headquartered in Denver, CO.
Related stocks

Newmont Corporation Could Be Poised for Upside in Q4 2025 Current Price: $86.86
Direction: LONG
Targets:
- T1 = $91.50
- T2 = $94.00
Stop Levels:
- S1 = $84.00
- S2 = $82.00
**Wisdom of Professional Traders:**
This analysis synthesizes insights from thousands of professional traders and market experts, leveraging collective intelligen

Chart Pattern Analysis Of NEM
After K3 close upon the neck line of a bullish head-shoulder pattern.
K5 close upon the resistance.
And the demands keep increasing too.
It seems that the bull market is accelerating here.
A short-term target at about 100-120USD.
I will try to buy it at K5.

Newmont Corp NEM BUYNewmont has rallied on surging gold prices and persistent market demand for safe haven assets. As the largest gold producer in the world, its scale and cost efficiency make it a favourite during macro uncertainty bank rate.

Newmont showing an extremely positive outlookSome notes which can be used as arguments to the bullish outlook:
The stock is above the 200D and even the 200W EMA.
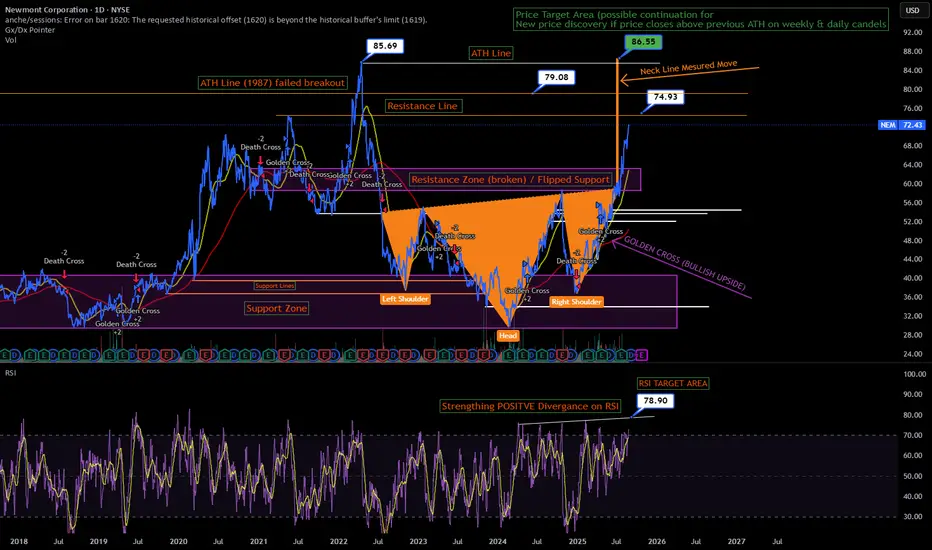
Large inverted head and shoulders structure which presents an opportunity leading up to 80$ which also turns out to be the resistance level tested in 1987 and 2022.
Locally looks

NEM H&SThis looks like an inverted Head and Shoulders doesn't it?
I wouldn't be surprised if this right shoulder had a double-bottom.

NEM Head & Shoulders technical breakout & new ATH Hi,
I actually spotted this a while ago and have keep this on the quiet but i am excited to share my first publication, This represents a clear "Ascending Inverse Head and Shoulders" with a slight favor to the upside.
I have set some price targets around potential Resistance levels also there wa
Newmont Corp | NEM | Long at $48.00While gold prices have soared recently, gold mining stocks have lagged. Newmont Corp NYSE:NEM , the world's largest gold mining corporation, may be undervalued if the miners take off to catch up to the gold demand/price. Currently sitting near $48.00 and at a historical moving average that it will

NEM ASX - breakout weeklyNEM now breaking out hard.
target is $74 AUD.
gold miners have yet to move but spot price of gold has already
started accelerating higher.
Bonds yields are still negative in real terms.
equities are overvalued. BTC is in a bubble. Gold is stability.
US empire wants to initiate more Wars. Chin

NEM - Cup and Handle - to 85Classic look. Strong despite weakening gold price. As S&P continues into new high territory, time for the laggards to pick up the pace.

See all ideas
Summarizing what the indicators are suggesting.
Oscillators
Neutral
SellBuy
Strong sellStrong buy
Strong sellSellNeutralBuyStrong buy
Oscillators
Neutral
SellBuy
Strong sellStrong buy
Strong sellSellNeutralBuyStrong buy
Summary
Neutral
SellBuy
Strong sellStrong buy
Strong sellSellNeutralBuyStrong buy
Summary
Neutral
SellBuy
Strong sellStrong buy
Strong sellSellNeutralBuyStrong buy
Summary
Neutral
SellBuy
Strong sellStrong buy
Strong sellSellNeutralBuyStrong buy
Moving Averages
Neutral
SellBuy
Strong sellStrong buy
Strong sellSellNeutralBuyStrong buy
Moving Averages
Neutral
SellBuy
Strong sellStrong buy
Strong sellSellNeutralBuyStrong buy
Displays a symbol's price movements over previous years to identify recurring trends.
N
NCMG4985652
Newcrest Finance Pty Ltd. 4.2% 13-MAY-2050Yield to maturity
5.92%
Maturity date
May 13, 2050
See all NEMD bonds
Curated watchlists where NEMD is featured.

