Nike Is -50% Over Five Years. Here's Its Chart Ahead of EarningsNike NYSE:NKE has languished in the doldrums for years, down some 12% year to date and more than 50% over five years vs. a nearly 90% gain for the S&P 500 SP:SPX during the same period. Let's see what the sneaker giant's chart and fundamental analysis can tell us ahead of its earnings report nex
NIKE, Inc. Shs B Cert Deposito Arg Repr 0.083333333 Shs B
No trades
Key facts today
1.30 USD
2.74 B USD
39.55 B USD
About Nike, Inc.
Sector
Industry
CEO
Elliott J. Hill
Website
Headquarters
Beaverton
Founded
1964
Identifiers
2
ISIN:ARDEUT111341
NIKE, Inc. engages in the design, development, marketing, and sale of athletic footwear, apparel, accessories, equipment, and services. It operates through the following segments: North America, Europe, Middle East, and Africa (EMEA), Greater China, Asia Pacific and Latin America (APLA), Global Brand Divisions, Converse, and Corporate. The North America, EMEA, Greater China, and APLA segments refer to the design, development, marketing, and selling of athletic footwear, apparel, and equipment. The Global Brand Divisions segment represents its NIKE Brand licensing businesses. The Converse segment designs, markets, licenses, and sells casual sneakers, apparel, and accessories. The Corporate segment is composed of unallocated general and administrative expenses. The company was founded by William Jay Bowerman and Philip Hampson Knight on January 25, 1964 and is headquartered in Beaverton, OR.
Related stocks

Just Bounce ItNike is currently testing the middle of a key weekly gap around the $70 level, a zone that has historically acted as a springboard for bullish momentum. A breakout above $70.75 would confirm renewed strength and open the path toward the $82.25 resistance.
NKE is also coming off oversold levels, sig

Bullish Deep Crab + Double Bottom at PCZPattern Identified: Bullish Deep Crab (0.886B/1.618XA with 2.0 BC Projection Confluence) with strong confluence at Potential Reversal Zone (PRZ).
Key Confluence:
Retracement Profile: Dual 0.886 retracements at B and C indicate powerful but potentially exhausted counter-trend momentum
Perfect Crab R

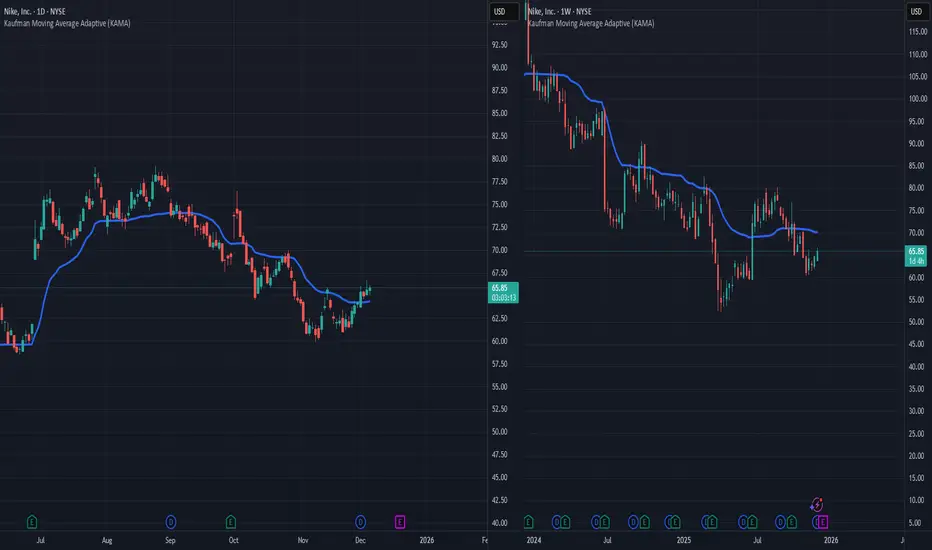
NKE // As long as we are above the Kaufman support on the daily time frame, the direction is up. Our first resistance point is the Kaufman indicator on the weekly time frame.
Nike poised for 2026 reboundWe keep coming back to the line attributed to Nike's CEO Phil Knight, “The cowards never started and the weak died along the way. That leaves us.”
Nike shares have slumped over the past 12 months, down roughly 17 to 18 percent. The weakness reflects a tough consumer stretch and pressure across g

NKE long idea Long CALLS NKE at 68. 6 weeks expire. SMT in the lows with SP500, this pattern indicates strong demand on NKE.

NKE LONG i like the break out retest and hold above the bullflag. volume picking up macd curling to the upside

NKE - Potential Bear SwingNKE - Potential Bear Swing
Timeframe - 2 weeks to 3 months
Volume
Weakening volume observed, opposed to Jul period
Price Action + Trend
- bullish trend broken
- Price broken out of downtrend line
Ichimoku
- Conversion line crossed baseline
- Lagging line crossed both base and conversion line
-

NIKE SHORT TRADING PLANI am shorting Nike because its long-term trend is downward, and the lower line represents a support level. I’m also basing my short position on RSI signals.

NKE is in the golden retracement zone after the right shoulder!NKE has formed a head and shoulder (reversed), currently sitting in the GOLDEN retracement zone. I think this is a good zone for LONG!

See all ideas
Summarizing what the indicators are suggesting.
Oscillators
Neutral
SellBuy
Strong sellStrong buy
Strong sellSellNeutralBuyStrong buy
Oscillators
Neutral
SellBuy
Strong sellStrong buy
Strong sellSellNeutralBuyStrong buy
Summary
Neutral
SellBuy
Strong sellStrong buy
Strong sellSellNeutralBuyStrong buy
Summary
Neutral
SellBuy
Strong sellStrong buy
Strong sellSellNeutralBuyStrong buy
Summary
Neutral
SellBuy
Strong sellStrong buy
Strong sellSellNeutralBuyStrong buy
Moving Averages
Neutral
SellBuy
Strong sellStrong buy
Strong sellSellNeutralBuyStrong buy
Moving Averages
Neutral
SellBuy
Strong sellStrong buy
Strong sellSellNeutralBuyStrong buy
Displays a symbol's price movements over previous years to identify recurring trends.
US654106AG8
NIKE, Inc. 3.375% 01-NOV-2046Yield to maturity
5.57%
Maturity date
Nov 1, 2046
NKEB
NIKE, Inc. 3.875% 01-NOV-2045Yield to maturity
5.55%
Maturity date
Nov 1, 2045
NKE4971170
NIKE, Inc. 3.375% 27-MAR-2050Yield to maturity
5.52%
Maturity date
Mar 27, 2050
NKEA
NIKE, Inc. 3.625% 01-MAY-2043Yield to maturity
5.46%
Maturity date
May 1, 2043
NKE4971169
NIKE, Inc. 3.25% 27-MAR-2040Yield to maturity
5.21%
Maturity date
Mar 27, 2040
NKE4971168
NIKE, Inc. 2.85% 27-MAR-2030Yield to maturity
4.07%
Maturity date
Mar 27, 2030
US654106AF0
NIKE, Inc. 2.375% 01-NOV-2026Yield to maturity
4.04%
Maturity date
Nov 1, 2026
NKE4971167
NIKE, Inc. 2.75% 27-MAR-2027Yield to maturity
3.71%
Maturity date
Mar 27, 2027
See all NKED bonds
Curated watchlists where NKED is featured.


