Bottom of RSI channel + Fib confluence in NOKIAHi everyone. Trying my hand at stonks again.,
Nokia is showing a number of potential reversal signals.
For starters, Nokia gapped down and held the 0.886 Fibonacci retracement from the July 2012 correction rally. After that rally, Nokia had what I believe to be an ABC retracement downwards, with a target for "C" being $2.42. This correction sequence in my opinion is very reminiscent to a 3-3-5 Elliott Wave correction. 3 Waves up, 3 waves down, 5 waves up which would complete the bullish correction. If indeed we are looking at a 3-3-5 bullish correction sequence, we are either on the very last, or close to the very last wave downwards for this asset. Next would in theory be a powerful 5 wave impulse upwards to complete the 5 waves of the 3-3-5 correction.
My opinion for the measurement of the "C" wave of this final 3 ABC series is located at $2.42. The local low so far this past trading week is $2.34. We can see that there was a fairly sizable bullish candle after touching the 0.886 and 1.618 "C" wave retracement. In the RSI, notice how the bottom of the channel was respected. This has also now printed bullish divergence in the weekly chart from late 2019.
With Fibonacci, we now know that we have a potential "C" wave having completed at $2.42, as well as a bullish 0.886 retracement at roughly the same price range. Confluence!
On the 30m, we can clearly see the reactions that were present when these levels were hit:
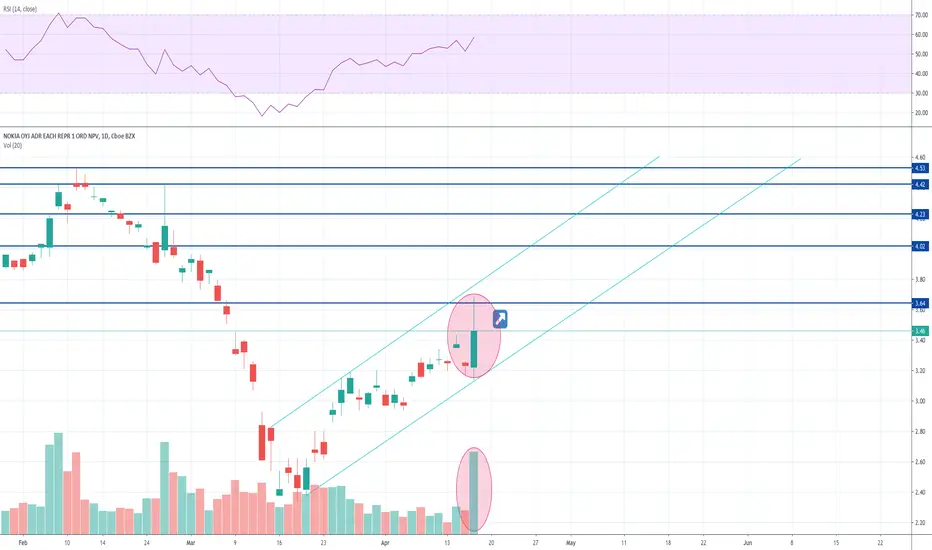
The daily is showing 4 tests of the 0.886 and 1.618 retracements. The weekly RSI channel on the daily is showing that we briefly dipped below support, but were able to re-enter back above both oversold and the channel support. There is some bullish divergence from the 12th of March. This has been accompanied by heavily increasing overall volume. Currently, price is showing a spinning top doji after breaking above a triple top. The price increased from bottom to top by 20%.
The Chaikin Money Flow indicator is showing consistent higher lows since late Oct 2016. These higher lows are accompanied by lower highs, which is in turn forming a symmetrical triangel. There are 3 touches of support and 3 touches of resistance so far. To validate a symmetrical triangle, rule of thumb is 3 touches each on both support and resistance. This will cause a very powerful move, whichever way it breaks. There is also a potential bullish falling wedge forming from Q2 2018. On this time frame we are only 3 points away from entering the accumulation portion of this indicator.
Weekly MACD is looking somewhat neutral. There have been consistent lower lows and lower highs since mid 2017. There is a flag-like channel the MACD has been following, similar to the RSI.
Interestingly, a very peculiar situation in the MACD histogram, however. There is a very strong bullish divergence in this recent drop versus the one that took place in November.
Like the weekly CMF indicator, there is a potential bullish falling wedge forming as well.
By the way. I did an analysis on Gold back in April of last year. Coming up on 1 year from the day I made it, gold is so far doing (almost) exactly what I thought it would. If Gold falls back down for a re-test of $1,350, it could mean that stocks are very near a potential bottom.
Gold is also printing a descending triangle, and is currently facing rather strong resistance in the RSI.
Consider how much fear there is in the market right now.
Consider how hard and how quickly we dumped, 35%!!! IN WEEKS!
The strongest and fastest drop in literal history.
Also keep in mind- Wuhan and mainland china are now peaking in CV19 cases.
And last but not least- just how many shorts and puts do you think there are?
nokia's have a wide reputation for being INDESTRUCIBLE.
This asset is literally screaming bull flags everywhere. wtf America?
Nokia Oyj ADR Cert.Deposito Arg.Repr. 1 ADRs
No trades
Market insights

NICE SETUP BULLISH ENGULFING #NOK PRIVATE EQUITY TRAKEOVERWith talks of Takeover by PE Firm KKR or BX or some other secret USA Player. 5G. Tech out for grabs. watch for possible gap on volume at open enter at high of pre market. no gap?
Enter on a 1min pull back if Volume is their....
Is Bitcoin going to follow Nokia's chart pattern?While evaluating Nokia stock I couldn't help but notice that Bitcoin could be following what Nokia's chart pattern did? What do you guys think leave comments below!


More downside - following the current marketExpecting more downside from current level/price. Possible entery Q2 - need confirmation on reversal.

Nokia may be worth nibbling as it approaches supportFactset, an agency that polls analysts, released a newsletter today titled "S&P 500 NOW PROJECTED TO REPORT A YOY DECLINE IN EARNINGS IN Q1 2020." The newsletter shows that analyst estimates of S&P 500 earnings have fallen from an expected 7% growth rate in Q1 to an expected -0.1% growth rate, and they're still coming down.
However, the newsletter also breaks things down by sector, and when you slice it that way, things look more complicated. The hardest hit sectors are materials, industrials, and consumer discretionary, all poised for double digit earnings decline. A few sectors are still poised for earnings growth in Q1, including communication services, with a 13+% growth rate. Information technology and utilities come in second and third place, with projected growth over 5%. Also set to grow are healthcare and real estate.
Now, earnings expectations likely will continue to decline, and even the outperforming sectors will fall with the rest of the market. But the outperforming sectors will start to find support sooner, and they will get outsized bounces when the market rallies. I don't suggest putting a lot of money here just yet, but it's worth taking a few nibbles at attractively valued companies in these sectors.
Nokia has support from about $3.30-3.50. The company has an attractive PEG of about 0.73, and it's been signing lots of deals lately in connection with the rollout of 5G. It plunged after suspending its dividend last year, but as the company recovers I think we could see the dividend return.

NOKIA LONG trade set up 27 February 2020Hi traders,
A nice bullish pinbar has formed on the daily.
The tail of the pinbar is also rejecting the last support area around 3.50, strengthening the bullish trend
I have placed a long order:
Order : 3.69
SL : 3.49
TP : 4.10
Good luck!
Spyros

NOK Going UP UP UPNew to charting, feel free to point out things I am getting wrong. This is what I see. Thanks and good luck in this bear market.

NOK Stock SHORT AND LONG Technical AnalysisNOKIA stock short and long term analysis including short-term price target(Friday) is $4.46. If it breaks the line we will see $4.61-5 range.
Watch this one closely this week;
Thank y'all NYSE:NOK

NOK Stock SHORT AND LONG technical analysisNOKIA stock short and long term analysis including price target is $4.86 end Feb or early March. Furthermore, NOK has a potential to hit $6-7 range.
Please leave your thoughts on the comment section.
Thank y'all. NYSE:NOK


NOKIA COULD BE THE 5G WINNER..!TYPICAL SAUCER PATTERN, EASY RISE TO 5.08 (15%) EASY MONEY
WE ALL KNOW NOKIA AS THE BEST PHONE PRODUCER OF EARLY MILLENNIUM WHICH HAD BEEN BEATEN SO HARD BY APPEL'S iPhones.
BUT TH FINISH MONSTER IS COMING BACK AS ONE OF THE BIGGEST 5G INFRASTRUCTURE PROVIDERS IN THE WORLD..!

NOK may face resistance near down trend line It is in strong dwntrend and may face resistance near daily downtrend line. IF price rejected then one can short NOK.

Nokia Gap Fill Opportunity
Alert set for breakout, possible entry at market \ approx $4.30
target price (1) $4.72
Target price (2) $5.00 to point of control
Stop loss $4.16
PLEASE GIVE US A LIKE IF YOU FIND OUR CONTENT HELPFUL.
THANK YOU

Nokia Earnings update - 88M Volume, earnings beatChart looks good some big volume came in today on the earnings beat along with some pumpy material from attorny general

Nokla surpasses expectations | gap FILL TRADE Nokia Corporation NOK reported impressive fourth-quarter 2019 results, wherein the bottom line and the top line surpassed the respective Zacks Consensus Estimate, and increased year over year.
In 2019, the company saw good progress in its focus areas of enterprise and software. Nokia Enterprise delivered well on its target of double-digit sales growth. Nokia Software showed its long-term promise, with profitability expansion compared to 2018. IP Routing continued its remarkable momentum, gaining significant share and increasing profitability in a difficult market, and Nokia Technologies continued to generate robust profitability.
Net Income
Reported profit for the December quarter was €563 million or €0.10 per share compared with €203 million or €0.03 per share in the year-ago quarter. The improvement was mainly driven by progress related to Nokia’s cost savings program, lower transaction and integration costs, a net positive fluctuation in financial income and expenses, lower income taxes and a net positive fluctuation in other income and expenses. However, the momentum was partly offset by lower gross profit due to its business performance. For 2019, profit was €18 million against loss of €549 million in 2018.
Quarterly non-IFRS profit came in at €821 million ($908.9 million) or €0.15 (17 cents) per share compared with €741 million or €0.13 per share in the prior-year quarter. This reflects progress in cost savings, which resulted in lower operating expenses across Networks, Nokia Software and Nokia Technologies. The bottom line surpassed the Zacks Consensus Estimate by 4 cents.


Nok 5g will blast in earningsA earnings play
Puts and calls
3.98 4.00 ressitence then 4.20 trigger
4.75 5.20 5.30 target

Nokia $NOK Feb 6 Earnings IdeaClassic cup and handle forming here, expecting strong financials after the announcements made last earnings. Mar 20 $5 Calls are 5C Looking cheap. Expecting a gap up on an earnings beat and lets see how close we can get to shooting that gap....

20200128 NOKIA LONGHi traders,
Looking to go long on NOKIA.
The chart is in a nice uptrend and just bounced off the 50 EMA after a small pullback.
There is still a huge gap to be filled until the 4.6 area
I have placed the next order:
NOKIA LONG
Order : 3.73
SL : 3.50
TP : 4.75
Rgds
Spyros

Buy Nokia around 3.0 after today's fall
After Nokia's earnings I expected it to continue falling considering no profitability in the next quarters and no dividends as well. But seems like its starting to find the floor slowly and might bounce back to its upper Fibo levels.
Nokia right now is a pioneer is 5G hardware development (besides ericsson, china mobile to name a few) and this company isnt going anywhere considering 5G revolution is just around the corner and with more and more smartphones providing 5g tech and this becoming a mainstream, the stock will fly again.
I wont involve in this trading until I see the floor today, so just need to wait for around 3.0 levels. Maybe it doesnt reach this level considering the way it go smashed from 5.12 levels to 3.2 levels today(around 38% drop)
Buy Nokia at 3.0
Tp1 3.3
tp2 3.6
Not a short term trade and neither a long term hold.

Broke and closed over resistance lineBroke the resistance line and closed over.
20 ma close to break thu 50 ma ( golden cross )
Open trade at : 3.5582
Set TP : 4.3045
Set SL : 3.4205
Risk/Reward Ratio : 4,61

NOK Ready for Bull Run!!!NOK Just had a Breakout of the Raising Wedge supported by sufficient Daily Volume. Secondly, the 14 Day & 52 Day Moving averages are about to have a GOLDEN CROSS.
With NOK controlling 25% of the 5G Telecon Equipments Market, it is looking to go for a RUN before the upcoming earnings
NOTE : NOK is expected to have a strong Q4 as per Projections. Given that they have cut dividends already, their Cashflow should increase by a Minimum of 500M Euros this excludes the cash from Operating Profit.
