NVDA OutlookNot going in-depth on any macros here.
For that you can check my BTC Outlook.
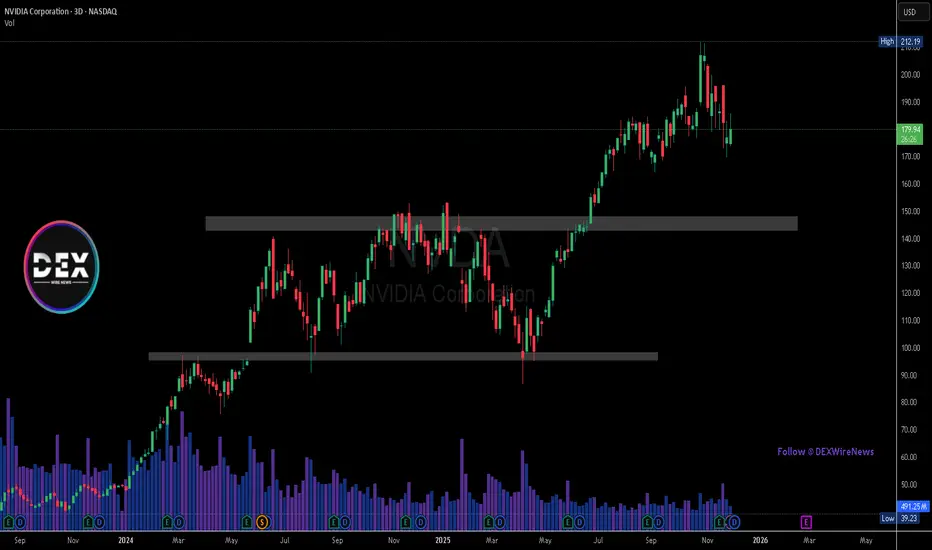
For NVDA my expectation is to play the range for now (yellow line). Looking for entries around $173.01, back to 50% of the range, vwap, etc.
If we do break down our last hope is the grey-ish box below to bring us back up.
As to why these levels are important or how I get them I don't wanna go into detail here.
If the grey box does not hold we'll see $130.17 - $148.39 again. If that happens, I will personally, load up heavy as that's insane discount.
Bubble or not, this thing wont pop for another good while.
If we manage to break above $182.61 and see acceptance, we can expect another test of the ATH, unless any unforeseen economic events happen.
Pay yourself along the way my friends.
As always, just my two cents.
NVIDIA Corporation Shs Cert Deposito Arg Repr 0.04166667 Sh
No trades
Market insights

NVIDIA – 1D Timeframe1. Price Action Analysis (NVIDIA – 1D Timeframe)
✔️ Long-term trend is still bullish
From 2023 to the peak in 2025, the stock was in a very strong uptrend. After reaching the all-time high, it entered a correction and consolidation phase.
✔️ Price is currently stabilizing after the correction
The recent decline has slowed down, and the price is moving sideways.
This usually indicates that the market is preparing for its next major move — either a breakout or a breakdown.
✔️ Key support level: $136
This level has acted as a major support/resistance in the past.
If the stock drops toward this zone, strong buying interest may appear.
✔️ Recent candles show loss of bearish momentum
Selling pressure is noticeably weaker compared to the previous decline.
🔍 2. MACD+RSI Combined Indicator
✔️ MACD is slowly exiting bearish momentum
The red histogram bars are getting shorter, showing weakening selling pressure.
The MACD and Signal lines are moving closer together.
This suggests a possible bullish crossover developing soon.
⚠️ However:
The MACD has not yet crossed into positive territory, and no confirmed bullish crossover has occurred.
➡️ This is an early sign of a possible trend reversal, not a confirmed one.
🔍 3. Stochastic RSI Analysis
✔️ Stoch RSI is in the overbought zone (above 90)
This indicates:
Recent upside momentum is strong
A short-term pullback is possible
However, in strong trends, the Stoch RSI can remain overbought for extended periods.
✔️ Momentum is recovering, but no breakout has happened
The indicator shows renewed buying strength, but since price is still in a consolidation zone, this is not enough to confirm a trend reversal.
🔍 4. Overall Summary (Most Important Section)
📌 There is no strong confirmation of a bullish reversal yet.
However, there are clear signs that bearish momentum is weakening.
📉 Short-term pullback risk is elevated
because the Stoch RSI is overbought.
📈 If MACD gives a bullish crossover, that will be the first reliable signal for upward continuation.
🔥 Two Main Scenarios
Bullish Scenario (requires MACD confirmation)
If the MACD line crosses above the Signal line and histogram turns positive:
Target 1: $195
Target 2: $210 (near the all-time high)
A breakout above $210 could start a new long-term bullish wave.
Bearish Scenario (if consolidation breaks downward)
If the price fails to hold current levels:
First support: $165
Major support: $136
The $136 level would be an attractive zone for long-term buyers.
⭐ Final Conclusion
The market is in a neutral consolidation zone.
MACD shows early signs of recovery, but no confirmation yet.
Stoch RSI warns of potential short-term pullback.
The next major move depends on whether MACD confirms upward momentum or price breaks down from consolidation.
If you'd like, I can also provide:
✔ precise entry/exit strategy
✔ risk-management planning
✔ weekly/monthly timeframe analysis
⚠️ Disclaimer (as you requested):
This analysis represents my personal view only. I take no responsibility for your buy or sell decisions.

NVDA SELLIf you have not SELL NVDA, than be prepare to SELL NVDA riding it back down to 93.00 to 77.00 as Profit Targets, Stop Loss will be determine later!
If anyone likes long mumbo jumbo garbage analysis, than this is NOT for you.
Also, if you are afraid of risk, failure, and want only a 100% sure thing, than
run as fast as you can from the market, because the market is NOT a sure thing,
so it is definitely NOT for you.
WARNING: This is just opinions of the market and its only for journaling purpose. This information and any publication here are NOT meant to be, and do NOT constitute, financial, investment, trading, or other types of advice or recommendations. Trading any market instrument is a RISKY business, so do your own due diligence, and trade at your own risk. You can loose all of your money and much more.

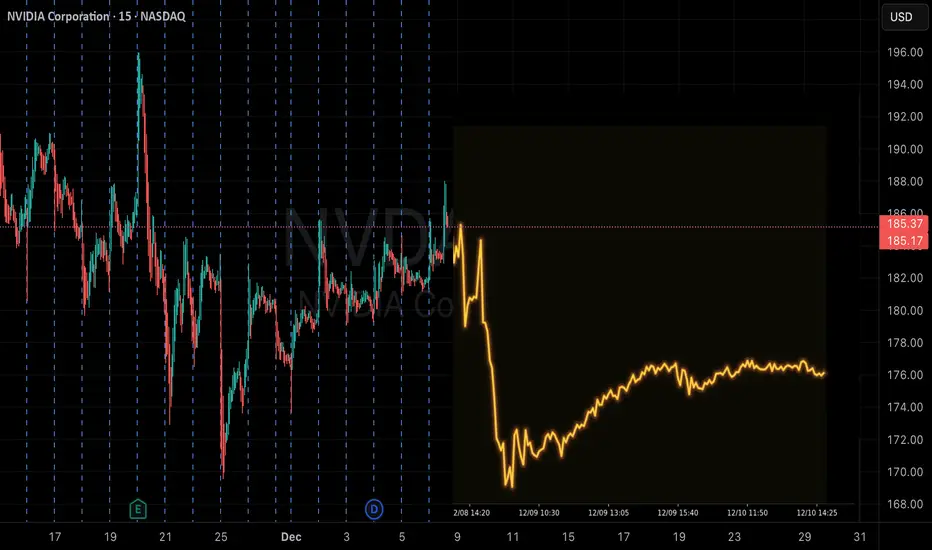
NVDA – Price Compression Near Key Gamma Levels (Dec 17 Focus)NVDA is currently trading in a tight consolidation range after a strong rebound from the lower channel. Price action on the 15-minute chart shows NVDA holding above the rising trendline support but failing to expand higher, suggesting the market is waiting for a catalyst or liquidity grab.
From a structure perspective, NVDA remains range-bound within an ascending channel, but momentum has clearly slowed. Buyers are defending the mid-range, while sellers continue to cap price near prior intraday highs.
Key Technical Levels (15m Structure)
* Immediate resistance: 177.80 – 178.20
* Upper channel / rejection zone: ~178.80 – 179.20
* Range support: 176.20 – 175.80
* Major downside support: 174.50 – 174.00
Price is currently compressing just below resistance, which often precedes an expansion move — but direction depends heavily on options positioning.
GEX Insight – Why NVDA Is Stalling
GEX data aligns very cleanly with the price behavior:
* Highest positive NET GEX / CALL resistance sits around 183–184, well above current price
* PUT support / negative GEX clusters between 174–175, matching the lower channel support
* HVL (high volatility level) is centered near 177, explaining the tight chop and mean-reversion behavior
This positioning tells us market makers are comfortable pinning NVDA inside the 175–178 zone. As long as price remains inside this GEX pocket, expect choppy, rotational price action, not trend continuation.
Scenarios to Watch
Bullish Scenario:
A clean break and hold above 178.20 with volume opens the door for a push toward 180 → 183, where heavy CALL resistance and gamma walls are stacked. Any rally into that zone is likely to face aggressive hedging pressure.
Bearish Scenario:
Failure to hold 176.20 shifts control back to sellers, with downside magnet levels at 175 → 174.50, where strong PUT support sits. A breakdown below 174 increases the odds of accelerated downside due to reduced gamma support.
Bottom Line
NVDA is currently trapped between strong gamma walls, which explains the slow, frustrating price action. Until price escapes this GEX range, scalping the edges makes more sense than chasing breakouts. Expansion will come — but only after liquidity is taken on one side.
This analysis is for educational purposes only and does not constitute financial advice. Always manage risk and confirm with your own analysis.

NVDA Testing the 100MA....Bulls Need To Step Up SoonI know there are a lot of Nvidia bulls out there but this chart is not looking strong at the moment. Price is back in a range that it was stuck in from July - October and we also cracked the 100MA(177.9) today. If bulls can't reclaim 178 and if 175 breaks I would be short to test 170 and if price breaks and holds below 170 I would be pressing shorts for the 200MA(164). If price can reclaim 178 I would be long to test 180, 183 and if price can break/hold back above this range I would be pressing longs for 190, 195. Lots of weakness here just like you're seeing in the NQ so bulls need to step up soon or this will break down further.

NVDA – TA for Dec 8–12Compression Under Resistance, Demand Below (Full TA + GEX Insight)
NVDA is entering the week sitting right beneath an important resistance band while holding onto a broader ascending structure. The stock is consolidating after a strong run, and the market is now deciding whether this pause leads to continuation or a deeper pullback. This week’s movement will hinge on how NVDA behaves at the key levels that have repeatedly controlled price throughout November and December.
Daily Timeframe (1D)
On the daily chart, NVDA has been drifting sideways-to-lower ever since rejecting the upper supply zone near 198–212. The structure hasn’t broken down completely — the stock is still defending its rising trendline — but momentum has clearly cooled.
A key observation on the daily chart is how NVDA keeps holding above the mid-line around 176–178, which acts as both a structural support and a zone where prior liquidity was collected. Beneath this, deeper demand sits between 164–170, with a much larger demand block far lower on the chart that has not been touched in months.
If NVDA loses the 176–178 zone on the daily, the market will likely move swiftly into the 164–170 liquidity pocket. But if buyers continue defending the trendline, NVDA may attempt another approach toward resistance.
A daily close above 185–186 would be the first sign of strength returning.
1-Hour Timeframe (1H)
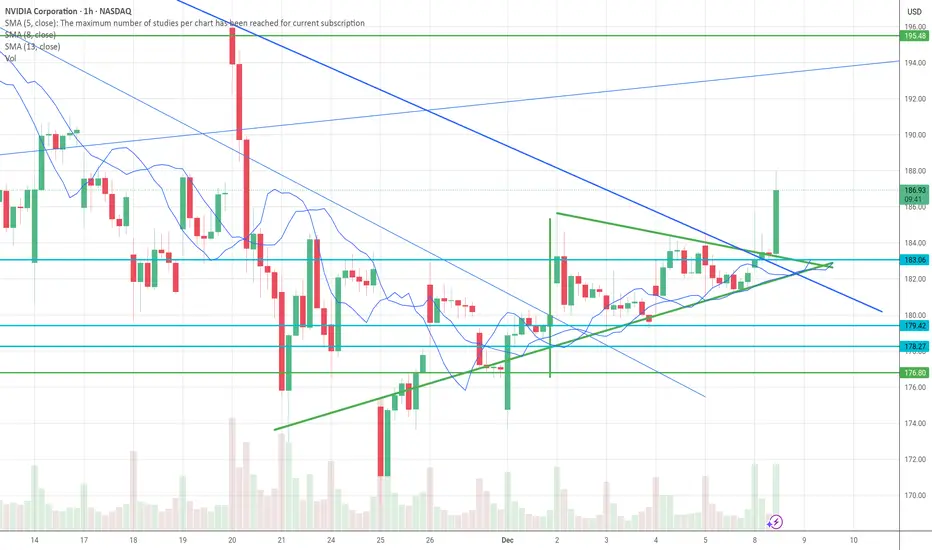
On the 1H chart, NVDA is compressing beneath a clear supply shelf between 183–186. This area has acted as a ceiling multiple times over the past sessions. Each approach into the zone has produced a rejection, and the most recent push created a BOS but failed to maintain follow-through.
At the same time, NVDA is sliding into a rising intraday trendline, creating a tightening wedge. This type of structure often forces a decisive move — either a breakout into the supply zone or a breakdown into the liquidity block below.
A reclaim and hold above 184–186 is the confirmation needed for bullish continuation. Without that, the 1H chart continues to lean toward a retest of 180, 178, or even the stronger demand at 174–176.
Short-term momentum is weakening, but buyers are still defending intraday demand. This makes NVDA a range-bound market heading into the week.
15-Minute Timeframe (15M)
The 15M timeframe highlights this compression even more clearly. NVDA is trading within a tight descending channel inside a larger demand zone. Each bounce is getting smaller, but sellers also haven’t been able to break the lower block around 180–182 despite repeated tests.
This type of price action suggests the market is building energy for a larger move. The path becomes clear once NVDA either:
* sweeps the 180–182 demand and sharply reverses
or
* breaks cleanly above the 183–186 supply band and retests it as support
Until that happens, price is likely to remain choppy, and intraday trades should be taken with caution.
A break below 180 on the 15M would shift the structure decisively bearish intraday.
GEX Insight (Options Positioning & Dealer Influence)
NVDA’s gamma landscape explains why the stock has been stuck between 180 and 186.
The region around 184–186 aligns with the highest positive NET GEX, which creates a natural resistance band where dealer hedging suppresses upward momentum. This matches the repeated intraday rejections you’re seeing on the chart.
Above 190, gamma begins to thin out significantly. If NVDA can break and hold above the 186 supply zone, the path toward 192–195 becomes much easier because hedging pressure shifts from restrictive to supportive.
Below 180, gamma flips and begins pulling price toward lower put-heavy regions:
* 172
* 165
* 162.5
These areas align cleanly with the chart’s major liquidity blocks.
In summary:
* Staying below 186 keeps NVDA pinned
* Breaking 186 opens the path toward 190–195
* Losing 180 exposes liquidity down to 172–165
GEX and price action are in full agreement this week.
Trading Focus for the Week
NVDA is coiling into a decision zone. The idea is not to predict the breakout but to react once the market commits.
The cleanest long setups come from:
* A liquidity sweep into 180–182 followed by a clear reversal
* A breakout and hold above 186
The cleanest short setups come from:
* Rejection wicks in the 183–186 supply zone
* A confirmed breakdown below 180
With momentum fading but structure still intact, NVDA is preparing for a directional move — traders just need to wait for confirmation.
Disclaimer
This analysis is for educational and informational purposes only and does not constitute financial advice. Trading involves risk, and traders should conduct their own research and apply proper risk management before entering any position.

Not sure how this is UBER bullish...That support line is now VERY important for Nvidia.
possible 20% drop

NVDA 1 hour pennant formation. Looking good. Holding nicely in the pennant formation break up and target $185. Break down and $178. I believe we may see $190's next week. Good luck.
This is not financial advice. Do your due diligence.

Long trade
🟩 Buy-Side trade
Pair: NVDA
Date: Mon 1st Dec 2025
Time: 12:30 pm
Session: NY Session PM
Entry: 180.25
TP: 195.71 (8.57%)
SL: 178.54 (0.949%)
RR: 9.04
🟦 STRUCTURE
NVDA formed a bullish MSS → BOS on the 1H
Price retraced into discount (0.618 fib region)
Strong displacement candle confirmed the long bias
FVG inside retracement zone provided algorithmic entry logic
Target aligns with HTF premium zone around 195–200
🟨 LIQUIDITY
Sweep of sell-side liquidity beneath 178.50–179.00
Inducement engineered before bullish expansion
Upside liquidity magnets:
187.80 (0.382 retracement)
195.70 HTF equilibrium level
Gap above → likely draw-on-liquidity
Large volume cluster supports bullish continuation
🟧 SENTIMENT
NVDA remains fundamentally bid due to AI/semiconductor strength
Broader tech sector showing rotation back into high-beta names
NY PM session typically generates continuation moves
Market repricing risk-on after morning volatility clearance

Let's buy nvidiaMine is a purely technical analysis that is supported by multiple factors: we can first notice in the daily timeframe that Nvidia is squeezing through this descending triangle creating a slight downtrend, retracing by about 15% from the historical high and arriving in an area of particular importance that in recent months has acted as a very important support, as we can see from the arrow. The price also tried to break the resistance looking for a further decline but failing to do so, it ended up closing the day's candle with enormous lower weakness as can be seen in the yellow area, finally arriving at the point of interest where we can notice the structural change in h4 and the break, now for 5 days, of the descending triangle.

New Energy Market Trends1. Rapid Growth of Renewable Energy Capacity
One of the most dominant trends in the new energy sector is the unprecedented expansion of renewable power capacity—mainly solar, wind, and hydropower. Solar energy is leading the transition due to plummeting module costs, scalable technology, and supportive government policies. Large-scale solar parks, rooftop installations, and floating solar plants are becoming mainstream. Wind power, especially offshore wind, is growing rapidly thanks to improved turbine technology, higher capacity factors, and falling installation costs.
Developing countries, particularly India, China, and parts of Southeast Asia, are experiencing the fastest renewable capacity growth due to rising electricity demand and favorable national policies. Many countries are committing to Net Zero targets and increasing their proportion of renewable energy in the grid-mix. This shift is also being supported by private players, as corporate Power Purchase Agreements (PPAs) gain popularity for decarbonizing operations.
2. Energy Storage Becomes Essential for Grid Stability
With renewable energy’s intermittent nature, energy storage systems—especially lithium-ion batteries—have become critical. Storage allows solar and wind energy to be stored during peak production and used during high demand or low generation hours. This enhances grid reliability and reduces blackout risks.
Battery storage prices have been falling consistently, supported by innovation in lithium-ion chemistry, solid-state battery development, and economies of scale in production. Grid-scale battery farms, home energy storage, and industrial storage systems are growing globally. Additionally, alternative storage technologies like pumped hydro storage, flow batteries, and thermal energy storage are emerging as powerful solutions for long-duration needs.
Countries with high renewable penetration, such as Australia, Germany, and the United States, are heavily investing in hybrid renewable-plus-storage projects, which combine solar/wind with batteries to stabilize supply. This trend will continue as more renewable energy is integrated into power grids worldwide.
3. Green Hydrogen Gains Global Attention
Green hydrogen—produced using renewable energy through electrolysis—is becoming a key pillar of the clean energy transition. It provides a decarbonization pathway for hard-to-abate sectors like steel, cement, fertilizers, shipping, and heavy industries.
Major economies such as the European Union, Japan, South Korea, India, and China are investing heavily in national hydrogen strategies. Electrolyzer prices are expected to fall significantly as production scales up, similar to the trend seen in solar panels. Industrial clusters across the world are piloting hydrogen-based steel production, hydrogen fuel cells for vehicles, and hydrogen-powered power plants.
Hydrogen also acts as an energy storage medium, helping balance renewable power supply. The future will likely see widespread hydrogen hubs, export-import corridors, and integration with heavy industries.
4. Growth of Electric Vehicles (EVs) Reshapes Energy Demand
Electric mobility is one of the biggest disruptors in the energy market. EV adoption is accelerating due to falling battery costs, government incentives, improving charging infrastructure, and increasing environmental awareness. With automotive giants transitioning to all-electric fleets, EVs are reshaping the demand for electricity, metals, energy storage, and charging technology.
Charging infrastructure is becoming more widespread—public stations, fast chargers, home charging units, and battery swapping stations (popular in Asia) are expanding rapidly. Vehicle-to-grid (V2G) technology, which allows EVs to feed energy back into the grid, is another emerging innovation that may stabilize electricity networks.
The shift from internal combustion engines to EVs also affects the oil and gas industry, reducing long-term demand for petrol and diesel while increasing dependence on electricity and battery raw materials.
5. Digitalization and Smart Grid Technologies Transform Energy Systems
Smart grids and digital energy solutions are essential for managing the growing complexity of modern power systems. Real-time data, automation, smart meters, IoT-connected devices, and AI-driven energy management platforms are dramatically improving energy efficiency.
Smart grids help utilities balance demand and supply more effectively, reduce transmission losses, and manage decentralized renewable resources. Consumers also benefit through smarter home energy devices, solar-plus-storage systems, and real-time consumption insights.
AI and machine learning are being used for:
Predicting energy demand patterns
Optimizing renewable generation
Monitoring grid assets
Reducing energy waste
Enhancing power trading
Blockchain-based energy trading is also emerging, allowing peer-to-peer power purchase in local microgrids, making energy more democratized.
6. Carbon Markets and ESG Investing Accelerate Clean Energy Adoption
Global carbon markets—both compliance and voluntary—are growing as companies and nations commit to decarbonization. By putting a price on carbon emissions, governments incentivize cleaner technologies and penalize polluting industries. This pushes industries toward renewable energy, energy efficiency, and sustainable operations.
ESG (Environmental, Social, Governance) investing has gained tremendous momentum, with institutional investors increasingly allocating funds to companies with strong sustainability practices. Renewable energy companies, green bonds, and climate-focused funds are benefiting from this capital inflow.
Carbon credit trading, carbon offset projects, and nature-based solutions are becoming new investment categories. Companies are adopting internal carbon pricing to make environmentally conscious decisions and prepare for stricter regulations in the future.
7. Energy Transition Metals See Rising Demand
Clean energy technologies rely heavily on specific metals—lithium, cobalt, nickel, graphite, copper, and rare earth elements. As EVs, batteries, solar panels, and wind turbines scale up, demand for these minerals is surging.
This has triggered investments in sustainable mining, recycling technologies, and alternative materials to avoid supply chain bottlenecks. Countries are also exploring domestic mineral reserves to reduce dependence on dominant exporters. Circular economy initiatives—battery recycling, solar panel reuse, rare metal recovery—are gaining traction globally.
8. Distributed Energy and Microgrids Expand
Distributed energy resources (DERs) such as rooftop solar, small wind systems, home batteries, and local microgrids are becoming popular for both residential and commercial users. These systems reduce dependence on central grids and improve energy resilience.
Microgrids are particularly valuable for remote regions, military bases, industrial facilities, and disaster-prone areas. They can operate independently during grid failures, providing reliable and clean power.
DERs and microgrids help reduce transmission losses, lower consumer bills, and decentralize energy production—making energy more democratic and community-driven.
Conclusion
The new energy market is evolving faster than any previous phase in global energy history. Renewable power growth, battery storage, green hydrogen, EVs, smart technologies, and carbon markets are fundamentally reshaping how the world generates, distributes, and consumes energy. Innovations in digitalization, materials science, and policy frameworks further accelerate this transformation.
As nations pursue sustainability and energy security, the new energy sector will continue attracting massive investments and technological advancements, unlocking long-term economic, environmental, and social benefits. The coming decade marks a decisive shift towards decentralized, digital, and decarbonized energy systems—defining the future of global markets.

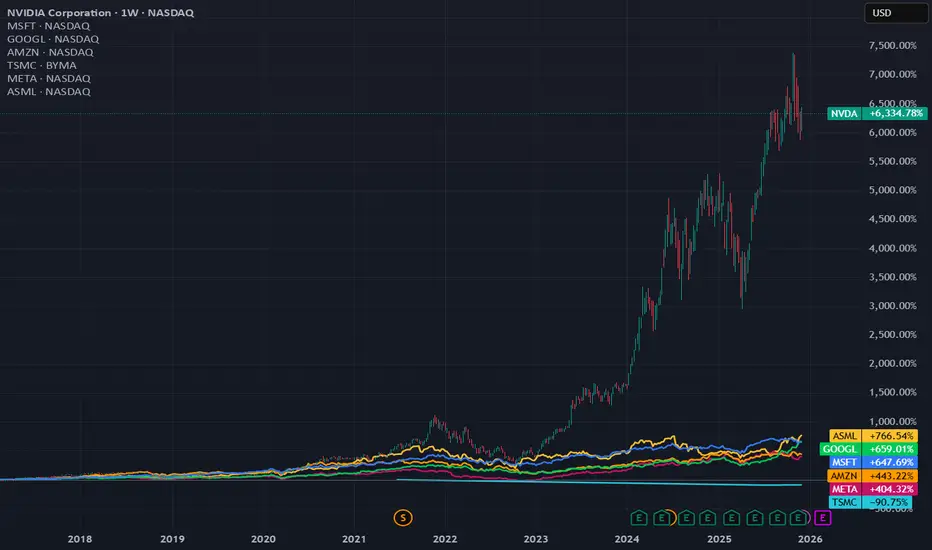
Comparative Performance of Key Stocks in Technology and AIThis chart presents a long-term analysis of the cumulative return of the most influential stocks in the technology ecosystem, focusing on companies central to Artificial Intelligence (AI) infrastructure and application.
Nvidia likely to sell off throughout December 2025Nvidia has dominated 2025 with an exceptional upward trend, driven by relentless AI infrastructure demand. Recently, NVDA has finally broken below that steep up-channel — a signal that the stock may need a short-term cooldown before its next leg higher.
A retracement into the mid-$150 range would bring price back to a well-established support zone visible on the chart. This would represent a constructive pullback rather than a change in the long-term trend, especially heading into new product and AI-spending catalysts expected in early 2026.
For perspective: just three years ago, NASDAQ:NVDA was trading near $12 per share — a staggering +1,375% gain in only 36 months. Given that magnitude of appreciation, a modest pullback to $150 should be viewed as healthy consolidation rather than bearish pressure.

NVDA Put Signal Triggered: Institutions Turning BearishNVDA QuantSignals V3 Weekly 2025-12-08
Direction: PUT Bias
Confidence: 58% (Medium)
Expiry: 2025-12-12 (4 days)
Entry Zone: $1.62 – $3.02 (depending on strike)
Recommended Strikes:
$182.50 (higher delta, stronger move)
$180.00 (safer, cheaper, wider buffer)
🧠 Why NVDA Shows Downside Risk
Katy AI forecasts a short-term decline of –0.73% to –1.70%
Options Flow: Extremely bearish — PCR 5.20 → 7.05 (institutions buying puts aggressively)
Technical Levels:
Strong resistance at $188.00 – $188.34
Key support around $180.00
Volume 2.4× above average → exhaustion at the highs
News: Mixed sentiment, increased volatility, China export headlines
🎯 Trade Setup (Simple Version)
Buy Puts
Strike: 180–182.5
Entry: $1.62–$3.02
Target: $2.45–$4.50
Stop Loss: $1.20–$2.10
Position Size: Small (2%)
⚠️ Risk Note
Katy’s confidence is only 50% and LLM shows conflict, so treat this as a high-risk, short-duration weekly trade.
NVDA breaks out of wedge and above 20ema. Mega bullish. NVDA’s push above the wedge and reclaim of the 20‑EMA tilts the very short‑term bias back to bullish, but it’s breaking into nearby resistance rather than into empty space.
Where price sits now NVDA is trading around 187–188, just above today’s 20‑EMA (~184) and basically on top of the 50‑EMA/50‑SMA cluster near 187–188.
The prior month’s action had price oscillating around these MAs, so this area is a battle zone, not clean air. Short‑term technical services still flag 20‑EMA as a “Sell” and 50‑EMA as “Sell/neutral,” reflecting recent downside momentum despite today’s pop.
Wedge breakout implications A breakout above a falling wedge after a pullback in a larger uptrend is typically bullish, with measured‑move targets often taken as the wedge height projected from the breakout.
Given NVDA’s broader uptrend (200‑day EMA/SMA rising around 155–163), this looks more like a continuation setup; the breakout favors a retest of the upper recent range (low 190s, then 200+) if it holds above the 20‑EMA.
Key intraday / short‑term levelsSupport to hold the breakout:183–185: 20‑EMA zone and today’s intraday low area; losing this quickly would make today look like a fake‑out 178–180: prior micro‑swing area; below here, wedge breakout thesis weakens and risk shifts back toward 170s.Resistance / upside magnets:190–192: recent local resistance band flagged by several TA services and discretionary analysts as a sell zone on first touch.
Above 192 on strong volume opens room toward the prior high zone near 200–212 over days to weeks if the AI/semis tape cooperates.
Good luck. Fortune awaits.
This is not financial advice. Please do your due diligence.
NVDA Market Preview – December 5NVDA heads into tomorrow’s session sitting at a major decision zone. Price has been tightening inside a rising channel, and the structure suggests a directional break is getting close. Supply and demand zones are well-defined, and current positioning gives a clear sense of where the next move may develop.
Higher-Timeframe Structure (1H)
NVDA is still holding a mid-term bullish structure that began at the 176–178 demand zone. Buyers have consistently defended this region, confirming its significance.
However, the 183.50–185 area continues to act as the main supply zone, rejecting price multiple times.
Key Zones
* Supply: 183.50–185.00
* Demand: 178–180
Price is now pressing toward the apex of a rising channel. This type of compression often leads to a decisive breakout or breakdown once the market chooses a direction.
Intraday Structure (15M)
A recent CHoCH did not lead to strong continuation, and NVDA is currently retesting its internal trendline with diminishing momentum.
Bearish signs
* Consistent rejection inside the supply zone
* Multiple upper wicks showing absorption
* Declining volume into resistance
* GEX resistance overhead
Bullish signs
* Rising trendline still holding
* No confirmed bearish BOS
* Liquidity resting above 185 that could attract a sweep
The structure remains balanced, but vulnerable. The next clean break will likely dictate direction for the session.
GEX Outlook for December 5
* Call wall: 187.5–190
* Put support: 179 / 177
* Neutral magnet: 182–183
A breakout above 183.50 creates room for 185 → 187.50.
A rejection here increases the probability of a rotation back toward 180 and possibly 178, aligning with demand and put support.
Dealer positioning is fairly neutral, suggesting the session may be two-sided unless a clear breakout occurs.
What to Watch for Tomorrow
Bullish Scenario
Requires a strong break and hold above 185, followed by a clean retest.
Targets: 187.50, then 190 (likely rejection area).
Bearish Scenario (favored unless macro shifts)
Needs another failed test at 183.5–185 and a loss of the 15M trendline.
Targets: 181.5 → 180 → 178.5–179.
Bias Going Into the Session
The lean is bearish-to-neutral unless NVDA reclaims and holds above 185.
Key reasons:
* Momentum softening at resistance
* Lower highs forming intraday
* SMC sell zones consistently respected
* GEX resistance overhead
* CHoCH has not converted into bullish structure
Expect chop early, followed by clearer direction once the trendline breaks.
Trading Thoughts
For possible longs:
* Wait for confirmation above 185
* Look for retest entry, not breakout chasing
* First upside target: 187.50
For possible shorts:
* Preferred zone: 184–185
* Downside targets: 181.5 → 180 → 178.8
For scalpers:
* 183.10 is the first micro pivot
* Trendline break on 15M will define direction
* Avoid trading the center of the range — poor R/R
Disclaimer
This outlook reflects personal market analysis and is for educational purposes only. It is not financial advice. Always trade your own plan and manage risk accordingly.

NVDA Wave Analysis – 4 December 2025- NVDA reversed from support zone
- Likely to rise to resistance level 194.30
NVDA recently reversed with the daily Hammer from the support zone between the multi-month support level 170.00 (which has been reversing the price from August), lower daily Bollinger Band and the support trendline of the daily down channel from October.
NVDA just broke the aforementioned down channel from October – which is lily to strengthen the bullish pressure on NVDA .
Given the clear daily uptrend, NVDA can be expected to rise to the next resistance level 194.30 (which reversed the price at the end of November).

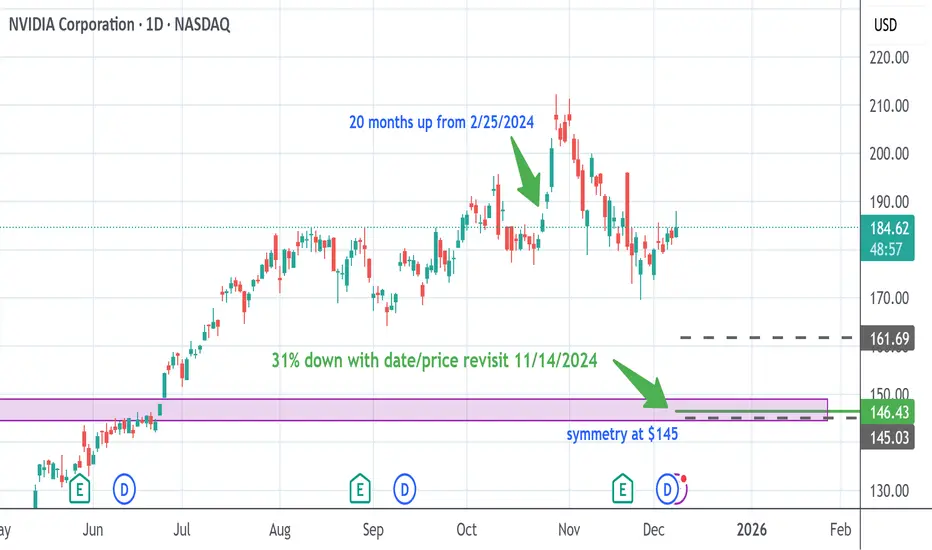
How low do we go? NVDAI get my information on where stocks might be headed based on my dowsing- as-in, with a pendulum. A super interesting thing occurred, which is that I did a reading on NVDA back on Feb. 25, 2024, which suggested a future date to be aware of in 20 months from then.
I just put the date in my my phone calendar for Oct. 24th 2025 with a couple alerts so I can pay attention. When I saw NVDA made these highs and pulled right back, I was super intrigued as it was in my date window. It's now head and shouldersy looking, and as such, I did draw a couple symmetry lines (are annotated as gray dashes) for reference.
(Love than my target is right above the second symmetry.)
I have been getting lower levels on NVDA, but I'm getting tired of some of these multiple numbers I get, so I just asked what advice there is and it said to get a date.
When I get a date, it often means a price revisit, or could be a pattern repeats from the past.. In this case, it's suggesting a price revisit to where NVDA traded on 11/14/2024. Then, I asked how many percent down from the ath at $212 & it gives me 31%.
My joy came when I drew the price lines out for the date, and lo and behold they overlay the 31% down price (146.41)!
I attempted to find out when this may hit, and I get Feb. 20th or 26th zone.
Let's boogie!
NVDA Swing Trade – Bearish Reversal SetupInstrument: NVDA
Direction: Buy Puts (Short)
Strike: $165.00
Entry Price: $1.08
Profit Target 1: $1.85
Profit Target 2: $2.50
Stop Loss: $0.65
Expiry: 14-day horizon
Position Size: 3% of portfolio (medium conviction)
Confidence: 65%
Risk Level: Moderate – counter-trend trade against broad market strength
Analysis Summary:
Katy AI predicts a bearish move toward $165-$170 based on technical weakness.
BEARISH_ENGULFING candlestick pattern confirmed; VWAP and momentum indicators suggest selling pressure.
High put/call ratio (3.60) shows strong institutional hedging.
Moderate risk due to broad market bullishness; monitor SPY/QQQ correlations.
This trade is a contrarian play, designed to capture downside in NVDA despite overall market strength.

Sub $100 Incoming?Textbook UTAD • LPSY Formation • Bearish Divergence on 3D QQQ Trend
📌 Overview
NVDA is showing a complete Wyckoff Distribution across all major timeframes. The Monthlys last major push has been extremely weak volume, The Weekly chart printed a clean UTAD, the Daily/3D shows a fractal UTAD, and the 3-Day QQQ trend reveals a bearish divergence by closing above its last swing, while NVDA closed below — confirming supply dominance.
This combination strongly suggests NVDA is transitioning from Phase C → Phase D, with markdown likely into the AR and below.
🟦 1. WEEKLY — Completed UTAD, Now Phase D
The Weekly structure is extremely clean and follows classic Wyckoff logic:
Phase A
PSY
Buying Climax (BC)
Automatic Reaction (AR)
Secondary Test (ST)
Phase B
Wide, choppy rotation while the Composite Operator distributes.
Phase C — UTAD
NVDA broke above Phase B highs, failed immediately, and reversed with increasing sell pressure.
This is the exact spot where smart money typically finalizes distribution.
Phase D — Current
The last two rallies have formed LPSYs, each weaker than the last:
Lower highs
Shortened thrust
Volume fading on upswings
Downside volume expanding
Interpretation:
Weekly is firmly in Phase D, preparing to test the AR (≈ $120). Followed by SOW-B ≈ $93
Failure of this zone opens Phase E (markdown).
🟪 2. 3-DAY NVDA — Fractal UTAD of the Weekly Distribution
On the 3-Day chart, NVDA produced a smaller UT and UTAD inside the larger weekly UTAD.
This is a fractal distribution, confirming:
A smaller distribution nested inside a larger one
CO selling on both timeframes
Supply overwhelming diminishing demand
This also aligns perfectly with the behavior of Phase C → D.
This is one of the strongest bearish Wyckoff signals you can get.
🟦 3. 3-Day QQQ Trend — Clear Bearish Divergence
Above the NVDA 3D chart is the QQQ 3-Day
• When NVDA closes below its last swing, while the market held above, that shows weakness.
This is momentum divergence:
Demand decelerating
When the leaders start to lag, thats something to cause concern.
Its a classic condition during UTADs in distribution tops
When a UTAD forms with divergence, Wyckoff views it as Demand is drying up.
🟧 4. MONTHLY — Macro Distribution Entering Phase D
The Monthly chart confirms the big picture:
Massive vertical run → PSY + BC
First shift in behavior → AR
Controlled retest → ST
Drift sideways → Phase B
Final push → Monthly UTAD
Rejection with increased supply → Phase C complete
Now price is failing the retest and rolling over into Phase D.
The Monthly and Weekly now align, which greatly increases the probability of sustained markdown.
🟥 5. Wyckoff Markdown Projection Path
Based on the current structure:
1️⃣ Current Zone
Weak LPSY → low-volume rally failures. I expect some chop, followed by one last UT of the chop highs, with a rejection between $185-$195. IF we reclaim and hold $195 = Invalidation, otherwise:
2️⃣ SOW (Sign of Weakness)
A decisive breakdown below the most recent structure lows.
3️⃣ First Major Target: AR Zone
$120
Every completed distribution returns to test the AR.
4️⃣ Sow Break (Phase E Begins)
Targets:
$102 (Phase A low)
$90-102 (Redistribution zone)
$76 (Final stopping area; Monthly value reset)
5️⃣ Bear Market Behavior
If the SoW breaks, NVDA enters a true Phase E markdown —
smooth, directional, and supply-driven.
🟩 6. Invalidation
To negate this bearish Wyckoff view:
➡️ NVDA must reclaim and HOLD above the UTAD high.
Given the 3D divergence and repeated LPSYs, this has low structural probability.
🟦 7. Final Thoughts
NVDA is aligning across all major timeframes in one of the clearest Wyckoff distribution sequences of the year:
Monthly UTAD
Weekly UTAD → LPSYs → SOW
Daily/3D fractal UTAD
3-Day QQQ divergence
Volume shift confirming supply
Everything here points toward Phase D → Phase E, with markdown into the AR and below. I think its important to not repeatedly try and call tops so if this idea is invalidated I will remain neutral, until I see redistribution below phase b, but I also think that the weakness in volume, and the MTF alignment is too much to ignore
If this continues to play out that would make all of 2025 a distribution. If that is the case, the markdown phase could play out throughout all of 2026 and into 2027. I know people say this every year/month/day but this is the first time, I personally, have seen this kind of alignment and supporting evidence across timeframes. Time will tell.
Good luck in 2026 everybody

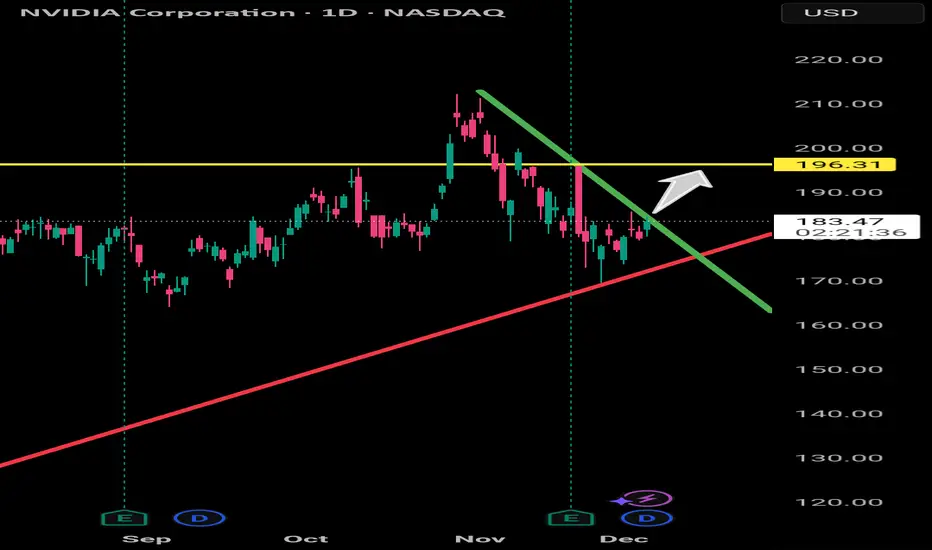
NVIDIA (NVDA) – Daily AnalysisNVIDIA (NVDA) – Daily Analysis
The chart is showing something interesting here:
Price has been trending down under the green bearish trendline, but we’re now seeing bullish pressure building right on top of the red long-term bullish trendline.
This creates a compression zone — and usually, NVIDIA doesn’t stay quiet in these zones for long.
What’s the key idea?
If price breaks and closes above the green trendline, momentum can shift bullish again, and the next logical magnet is the yellow horizontal level at 196.31.
Why that level?
It’s a major historical reaction zone.
It aligns as a clean liquidity pool.
Market loves to revisit these "00-zones" and round-number clusters.
Probability Outlook
With current price basing at 183.59 and respecting the bullish diagonal:
➡️ A move toward the yellow line (196.31) is highly probable once the trendline break is confirmed.
Indices in the Global MarketWhat Is a Market Index?
A market index is a statistical measure that represents the value of a group of stocks. These stocks are chosen based on specific criteria such as industry, market capitalization, liquidity, or sectoral allocation. The purpose of an index is to track the performance of a market segment over time.
Indices provide:
A benchmark for investors to compare their portfolios.
A snapshot of market conditions.
A tool for passive investing through index funds and ETFs.
A reference point for derivative products like index futures and options.
Global indices summarize the performance of economies worldwide, making them vital for understanding international trends.
Types of Global Market Indices
Global indices can be categorized based on their scope and underlying composition. Here are the major types:
**1. Country-Specific Indices
These indices track the performance of a particular country’s stock market.
Examples:
United States:
S&P 500
Dow Jones Industrial Average (DJIA)
Nasdaq Composite
India:
Nifty 50
Sensex 30
Japan:
Nikkei 225
TOPIX
China:
Shanghai Composite
Hang Seng (Hong Kong market)
These indices reflect the economic condition of the respective nation, investor confidence, and market trends.
**2. Regional Indices
These track the combined markets of specific geographic regions.
Examples:
STOXX Europe 600 — represents Europe
FTSE Europe Index — major companies across Europe
S&P Asia 50 — top companies across Asian countries
Latin America 40 (LATAM 40) — top Latin American stocks
Regional indices help investors understand broader continental trends rather than country-level movements.
**3. Global Indices
These reflect the performance of companies worldwide.
Examples:
MSCI World Index — covers developed countries globally
MSCI Emerging Markets Index — tracks emerging economies
FTSE All-World Index — combines developed + emerging markets
Global indices are useful for gauging the health of the worldwide equity market.
**4. Sector-Specific Indices
These track particular industries such as technology, finance, energy, or healthcare.
Examples:
NASDAQ-100 Technology Index — tech-oriented companies
S&P Global Clean Energy Index
MSCI Global Financials Index
These help investors diversify or focus on high-growth sectors.
5. Weighted Indices (Price-Weighted, Market Cap-Weighted, Equal-Weighted)
Most global indices use one of the following methods:
Market Cap Weighted
Larger companies have more influence.
Examples: S&P 500, MSCI World.
Price Weighted
Stocks with higher prices have more influence.
Example: Dow Jones Industrial Average.
Equal Weighted
All stocks contribute equally regardless of size.
Why Global Indices Matter
Indices are more than just numbers—they drive major financial decisions.
1. Indicators of Economic Health
Indices reflect how well sectors or economies are performing.
A rising index generally signals economic expansion, while a falling one indicates slowdown.
For example:
When the S&P 500 rises consistently, it often signals strong U.S. corporate earnings.
When the Nikkei 225 falls sharply, it may indicate issues in Japan's industrial or export sectors.
2. Benchmarks for Portfolio Performance
Investors compare their returns to indices:
If a portfolio grows 10% while the S&P 500 grows 15%, the portfolio underperformed.
Fund managers aim to outperform benchmarks.
3. Underlie Passive Investment Products
Indices form the foundation for:
Index mutual funds
ETFs
Index futures
Index options
This allows investors to gain exposure to entire markets with ease.
4. Tools for Global Diversification
Investors use indices to diversify across:
Countries
Regions
Sectors
Market capitalizations
For example, someone in India can invest in global indices like Nasdaq 100 to gain exposure to U.S. technology giants.
Major Global Market Indices Explained
Below are some of the most influential indices across the world:
1. S&P 500 (USA)
Tracks the top 500 publicly traded U.S. companies.
Considered the most accurate representation of the U.S. economy.
Covers about 80% of U.S. market capitalization.
2. Dow Jones Industrial Average (USA)
Oldest U.S. index.
Tracks 30 large blue-chip companies.
Price-weighted.
3. Nasdaq Composite (USA)
Tech-heavy.
Includes over 3,000 stocks.
Reflects innovation and growth sectors.
4. Nikkei 225 (Japan)
Price-weighted index of 225 major Japanese companies.
Represents Asia’s most influential market.
5. FTSE 100 (UK)
Top 100 companies listed on the London Stock Exchange.
A key benchmark for the UK economy.
6. DAX 40 (Germany)
Tracks Germany's top 40 blue-chip companies.
Represents the powerhouse of the European Union.
7. Hang Seng (Hong Kong)
Represents Hong Kong’s free-market financial hub.
Strong exposure to Chinese companies.
8. Shanghai Composite (China)
Includes all stocks listed on Shanghai Stock Exchange.
Represents China’s domestic economic health.
9. Nifty 50 & Sensex (India)
Nifty 50: Top 50 companies by market cap.
Sensex: 30 large companies.
Both reflect India’s fast-growing economy.
How Global Indices Influence Each Other
In today’s interconnected economy, movements in one major index affect others.
Example:
If U.S. indices crash, Asian and European markets often fall the next day.
When China reports weak economic data, indices like Hang Seng, Nikkei, and even DAX may decline.
Global indices move in a chain reaction due to:
Trade relations
Currency fluctuations
Global risk sentiment
Monetary policy decisions
Indices as Tools for Traders
Global indices are widely used for:
1. Technical Analysis
Price trends, support/resistance levels, and chart patterns influence trading decisions.
2. Futures and Options Trading
Indices like Nifty, Dow, and Nasdaq have liquid derivative markets.
3. Hedging
Investors hedge their equity portfolios using index derivatives.
Conclusion
Global market indices are essential components of the financial ecosystem. They summarize economic performance, guide investment strategies, influence global capital flow, and provide transparent benchmarks for evaluating market trends. Understanding these indices gives traders and investors the ability to make informed decisions, diversify globally, and interpret the broader financial landscape. Whether you follow the S&P 500, Nikkei 225, FTSE 100, or Nifty 50, each index tells a story about its economy, sector, and global interconnectedness—making indices indispensable tools for navigating the world of finance.

Nvidia (NASDAQ: $NVDA) $2B Synopsys Bet Reshapes AI’s FutureNvidia’s recent $2 billion investment in Synopsys signals one of the company’s most strategic and transformative moves in the AI and semiconductor race. The purchase—completed at $414.79 per share for a 2.6% stake—pushes Nvidia deeper into the core infrastructure that powers advanced computing, chip design, and the next generation of AI hardware.
While mainstream attention often focuses on AI chatbots, consumer apps, and model breakthroughs, Nvidia’s Synopsys stake shows a different priority: controlling the foundational technologies that make AI possible. Synopsys is one of the world’s most critical companies in electronic design automation (EDA), providing the tools used to design semiconductors, aerospace systems, and highly complex digital architectures. By aligning with Synopsys, Nvidia effectively plugs into the heart of global chip innovation.
Experts suggest this isn’t merely a passive financial investment—it’s a strategic partnership aimed at accelerating breakthroughs in AI-optimized chips, automation tools, and silicon-level performance. With Nvidia already dominating GPU computing, securing influence within Synopsys strengthens its command over the entire AI hardware pipeline, from design to deployment.
This move also positions Nvidia ahead of rivals as the semiconductor landscape becomes increasingly defined by custom silicon, automated chip design, and hardware-accelerated AI systems. A deeper integration between both companies could unlock new workflows where AI models help design better chips—and those chips, in turn, train better AI models.
While media narratives often revolve around front-end AI products, Nvidia’s quiet focus on infrastructure reveals its long-term strategy: build, own, and optimize the invisible technological backbone of the AI revolution. With Synopsys now in its orbit, Nvidia is not just participating in the future of AI—it’s helping engineer it.
Technical analysis
Nvidia (NASDAQ: NVDA) is bouncing from a key demand zone after pulling back from the $212 resistance area. Price is reclaiming short-term momentum as it holds above the major support region around $145, which previously acted as a strong accumulation zone. As long as NVDA maintains support above this level, the structure favors a continuation toward the $200+ range, with $212 remaining the next major hurdle. A breakdown below $145 would open room for a deeper correction, but current price action signals buyers are defending the trend.