$NVDA Structure keeps improving for a move lower.Just added to my NASDAQ:NVDA short.
Structure keeps improving for a move lower.
And the competitive pressure is real:
NASDAQ:GOOGL ’sTPU stack is becoming a legitimate alternative to Nvidia for training/inference.
Trade ideas
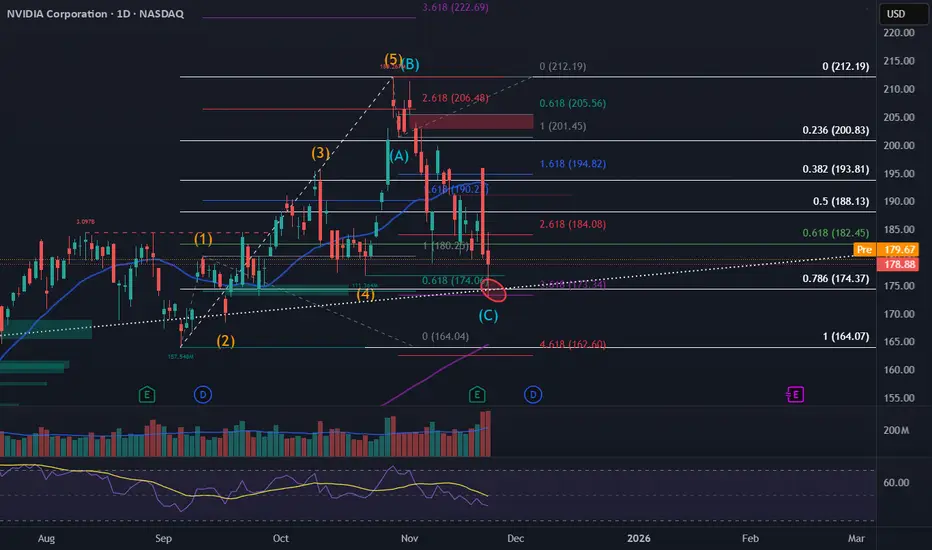
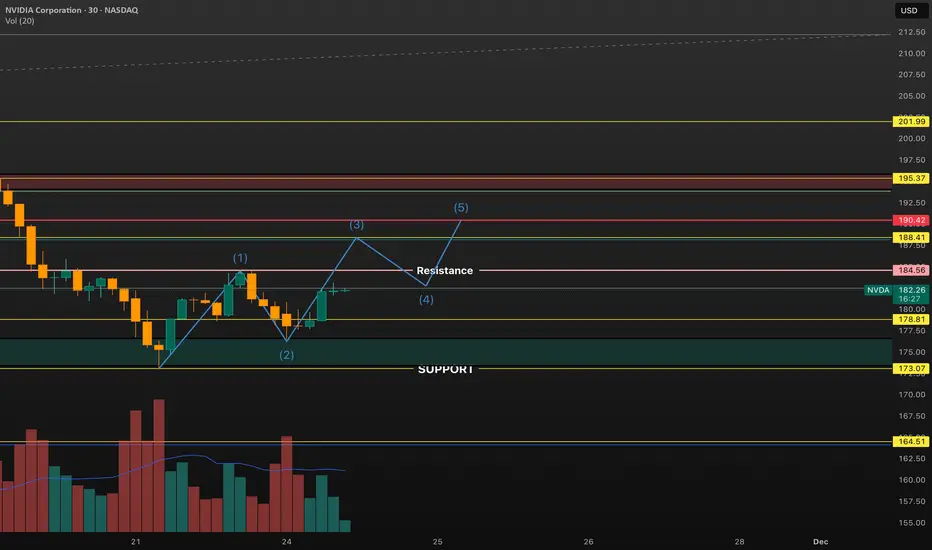
NVDA Corrective Structure Completing? Critical Fib & Trendline CNVIDIA is completing an ABC correction after the recent top. Price is now sitting on a strong support area around 174–177, where multiple Fibonacci levels and a long-term trendline meet.
If this zone holds, NVDA may start a new move up toward 182–194.
If it breaks below 174, deeper levels like 164 become possible.
Watching for a reaction here to confirm the next direction.
Nvidia poised for rebound as support holds despite recent sell-o
Current Price: $183.11
Direction: LONG
Confidence Level: 68%
Targets:
- T1 = $186.00
- T2 = $193.00
Stop Levels:
- S1 = $180.00
- S2 = $175.00
**Wisdom of Professional Traders:**
When I combine what multiple professional traders have been sharing, I'm seeing a setup where the recent pullback in Nvidia is being treated more as a buying opportunity than a sign of deeper trouble. Several traders are watching the $180 area as a key short-term support, pointing out that despite intense volatility and "pump-and-dump" style reversals around earnings, the underlying fundamentals and demand for AI hardware remain strong. The collective view leans toward upside if key resistance levels are reclaimed this week.
**Key Insights:**
Here's what's driving my thinking — the $184 level has been cited over and over as a critical pivot. A sustained move above that could quickly attract momentum buyers again. While bears have been vocal post-earnings, the consensus from market experts is that Nvidia’s growth story hasn’t changed; the sell-off was largely technical and sentiment-driven. Repeated mention of potential rallies into gaps above $190 adds weight to a bullish bias.
What's interesting is that traders are balancing concerns over valuation with the reality of Nvidia’s unique market position. Many acknowledge Michael Burry’s short and general AI bubble fears, but they’re countering that with hard numbers: record revenues, data center and networking growth, and still-dominant market share. That tug-of-war is exactly why reclaiming $184 is such a big psychological shift.
**Recent Performance:**
This all played out in the price action last week. Nvidia gapped up after its earnings beat, ran into resistance just under $200, and then reversed hard, dropping almost 6% in a single session to tag its 21 EMA around $179. We saw multiple intraday swings of 3-5%, reflecting just how reactive traders were to each headline. Still, the $180 zone held into the week’s close.
**Expert Analysis:**
Several professional traders I track are framing the $180-$184 band as the immediate battlefield. They expect buyers to defend $180 in the short term, with any push above $184 potentially triggering a squeeze toward $190-$193 — levels mentioned by more than one commentary. Others note that the stock has pulled back into a prior consolidation zone from August, which often acts as a demand area for swing traders.
The professional consensus also points out that Nvidia still commands a 90% share of the AI chip market, and demand massively outpaces supply. That fundamental backdrop is why even technically-oriented traders are leaning to the long side here despite recent bearish chart patterns.
**News Impact:**
The main news catalyst remains U.S.-China trade policy chatter — any positive movement toward allowing Nvidia to sell advanced chips to China has prompted immediate price spikes. On top of that, the market is still digesting blockbuster earnings that were overshadowed by valuation worries. If geopolitical developments break positively this week, they could be the trigger that catches shorts off guard and propels price above the critical $184 level.
**Trading Recommendation:**
Here’s my take — with support at $180 still intact and multiple traders eyeing a move above $184, the risk-reward for a tactical long makes sense this week. I’d look to enter around current levels, with stops just under $180 to protect capital. Initial target sits at $186 for a quick momentum trade, and if that breaks, aim for $193 where the next overhead supply is likely to show up. This remains a short-term swing idea while the technical and news catalysts align.

NVDA Cooked!?If you find this information inspiring/helpful, please consider a boost and follow! Any questions or comments, please leave a comment!
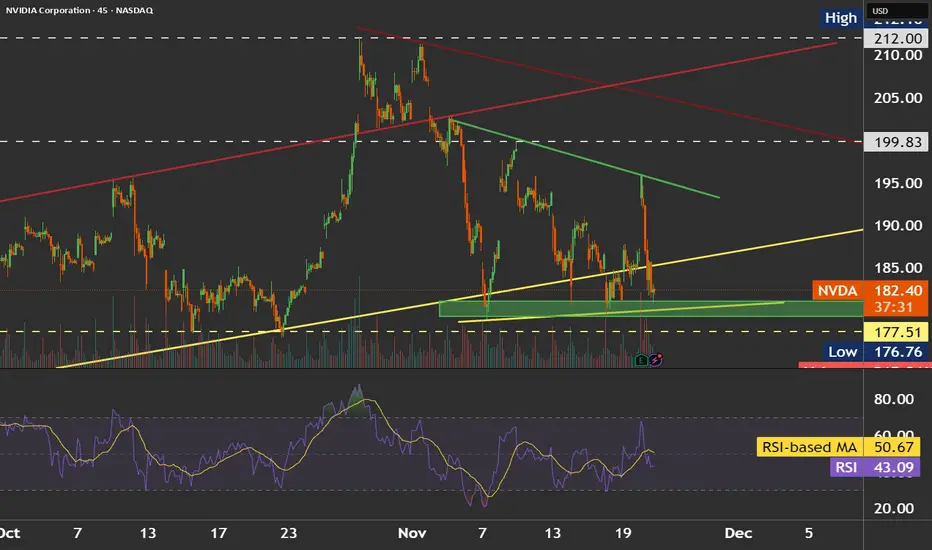
NVDA Price Action Update: Key Levels To Watch
NVDA is cooked if it cannot reclaim the key levels overhead. Price is currently testing 178 and this area is critical for determining whether buyers still have any momentum left.
To flip this structure back upward, NVDA needs an impulse through 178 and then 184. Anything that retraces in a choppy or corrective manner within the impulsive range from 195 is suspect and suggests continuation lower.
If buyers fail to generate an impulsive move from here, the downside levels below come back into play. Seller control increases with every failed retest and every weak bounce.
This is a simple structure play. Impulsive strength is required to shift control. Corrective behavior keeps the door open for further decline.
Trade safe and trade clarity.
UIA Lite – Trend Structure Preview Release|Full Explanation of T⭐ UIA Lite – Trend Structure Preview Release|Full Explanation of T / E / H / X (Free Preview)
Hello everyone, this is UIA Institute.
We focus on developing clean, systematic, and repeatable market structure tools based on pure price action.
Today, we are releasing the UIA Lite – Trend Engine (Free Preview).
This preview showcases the four core structural events used in the UIA Trend Engine.
These four events form the “structural backbone” of a trend.
🔵 The Four UIA Structural Events (T / E / H / X)
T — Trend Start
Marks the beginning of a trend.
Price transitions from consolidation into a directional move.
E — Trend Extension
Confirms that the trend is healthy and continuing.
Often appears after a controlled pullback or continuation pattern.
H — Structural High / Low
Key swing points formed during the trend.
These are commonly used for scaling out or tightening risk.
X — Trend Exit / Reversal
Indicates that the trend has completed and the market may shift into
either sideways consolidation or a reversal phase.
These four events together define the life cycle of a trend.
🔵 What’s included in the Free Preview
To help more traders understand UIA’s structure-based methodology,
this Preview version focuses on:
Clean labeling of T / E / H / X
Minimal parameters
No prediction, no signals
100% price-action-based logic
Simple, transparent structural rules
The full version of UIA Lite will include additional filters,
higher-precision logic, and more stable structural mapping.
🔵 UIA Lite – Free Preview indicator link:
👉
Feel free to add it to your chart and experiment with it.
🔵 About UIA Institute
We are developing a complete structural analysis framework:
UIA Trend Engine (Trend Structure)
UIA Wave Engine (Swing Structure)
UIA TSX Engine (Early-Structure Signals)
Our philosophy is simple:
No prediction, no emotional trading, no over-indicator setups.
Only structure, rhythm, and repeatability.
**We welcome English-speaking users to join the discussion.
More UIA content will be released soon.**
NVDA Katy AI Analysis – Neutral, Monitor for BreakoutNVDA QuantSignals Katy 1M Prediction – 2025-11-24
Current Price: $179.09
Final Prediction: $179.64 (+0.30%)
30-min Target: $179.46 (+0.20%)
Trend: NEUTRAL
Confidence: 55%
Volatility: 13.3%
⚠️ Trade Signal:
No trade generated – insufficient confidence and move size
🧠 Analysis Summary:
Katy AI shows minor upside but not enough for actionable entry
Low expected movement implies limited risk/reward opportunity
Traders may monitor for upcoming catalysts or volatility spikes

Nvda break through ~184? Can we see higher this week Nvda looks good this week with bounce on support and look for a test of 184. There is a lot of selling pressure in 190's get through that back to all time high. But for this week lets get over 184 first. My opinion only
Analysis of the Nvidia (NVDA) Share ChartAnalysis of the Nvidia (NVDA) Share Chart
Last week, we published a post titled “Ahead of Nvidia’s (NVDA) Earnings: How the Price Could Move”, in which we:
→ Drew an ascending channel (shown in blue);
→ Suggested that market participants’ overly high expectations would likely not be met when earnings were released, leading to a decline in NVDA’s price towards the lower boundary of the ascending channel, where support lies at $165.
In reality, the earnings report turned out to be very strong:
→ Gross revenue: actual = $57bn, forecast = ~$54.9bn.
→ Earnings per share (EPS): actual = $1.30, forecast = $1.26 (previous quarter = $1.05).
The surge in price with a bullish gap towards point A reflected the initial reaction to the strong figures, but the share price then began to fall (reaching a two-month low), thereby confirming our expectations.
Technical Analysis of the Nvidia (NVDA) Chart
An analysis of NVDA’s price action suggests that the current situation can be viewed as a correction (shown with red lines), forming within an expanded ascending channel.
If NVDA’s share price declines towards the $165 level, where the lower boundary of the channel lies, this could encourage the bulls to attempt to resume the 2025 uptrend and mount a new push towards the psychological $200 mark.
This article represents the opinion of the Companies operating under the FXOpen brand only. It is not to be construed as an offer, solicitation, or recommendation with respect to products and services provided by the Companies operating under the FXOpen brand, nor is it to be considered financial advice.

I guess it is a bubble...When the CEO is selling, the CFO is selling, SoftBank is unloading, Peter Thiel is selling, and Michael Burry is short, you have to stop and ask the only question that matters:
Is it actually smart to buy the dip here?
I didn’t even bother checking the latest SMH holdings, but if anyone wants to post the updated weightings, it would help frame how much passive-flow risk still sits above price.
The real question is whether there’s room left on the downside and whether this is anywhere near a bottom. If you want an example of how low “too low” can go, just study META during its unwinding. Fundamentals didn’t matter. Valuation didn’t matter. Price just kept repricing until forced sellers were done.
The one positive about this environment is volatility. When liquidity thins out and ranges widen, both sides can pull money out — but only if you treat it like a scalp environment, not a swing-long hero trade.
Because think about it rationally:
Do you want to be the one buying while billionaires, insiders, and institutions are selling into strength?
We’re moving into year-end — historically the period where funds clean books, tax-loss harvest, and unwind risk. Pair that with the probability of crypto-liquidation bleed-through, and you can easily get a chain reaction. Markets don’t fall in straight lines; they fall like Jenga blocks, dominoes, or a card tower collapsing from the bottom up.
This isn’t doom posting — it’s just market structure.
Flow dictates direction, and right now the flow is one-directional.

NVDA Head and Shoulders- Dec Rate Cuts has changed setupNvidia’s setup has shifted. With the Fed signaling a likely rate cut on December 10th, the market will start baking that optimism into asset prices ahead of time. When monetary conditions ease, high-valuation tech often gets an extra tailwind, which means the expected head-and-shoulders pattern on NVDA may fail to play out cleanly. The chart might still roll over, but the macro backdrop now works against a decisive breakdown. Short positions here demand caution.
Original post
Nvidia’s bear case rests on one core idea: the stock price assumes a flawless, world-eating AI future, and markets almost never deliver on “perfection narratives.” NVDA trades at extreme valuation multiples for a hardware-driven, highly cyclical business. Those multiples only hold if AI infrastructure spending keeps compounding at its current breathtaking pace for years. But that demand is dangerously concentrated in a handful of hyperscalers who are spending now and rationalizing later. Michael Burry’s recent argument sharpens this point: he claims true end-demand for AI horsepower is vastly overstated, and that much of the current GPU frenzy is a self-reinforcing loop of capital, hype, and accounting gimmicks rather than broad, organic need. If boards pause to question real ROI, or if the circular funding loop breaks Nvidia’s revenue curve can flatten quickly, dragging the valuation down with it.
Competition, long dismissed by NVIDIA bulls, is another structural headwind. AMD is now shipping accelerators that hyperscalers are actually integrating, and every major cloud provider is building in-house silicon to reduce dependence on NVDA’s margins. Even if Nvidia maintains leadership, it doesn’t need to lose the crown to lose the multiple, slight shifts in workload allocation or a handful of missed design wins are enough to pressure margins. And Burry’s critique deepens this point: he argues Nvidia’s reported profitability is flattered by depreciation assumptions and massive stock-based compensation that buybacks have failed to offset, meaning the “true” economic profit is less bulletproof than headlines suggest. Add to that the fact that U.S. export controls have effectively erased the China data-center market, once 20–25% of revenues and expectations of a seamless global TAM look increasingly unrealistic.
Technically, NVDA is doing exactly what a euphoric, overowned stock does when gravity starts tugging: momentum is fading, the price is slipping under short-term moving averages, and reactions to spectacular earnings have been strangely sluggish. That’s often the early signature of distribution rather than accumulation. And this lines up directly with Burry’s broader thesis: when a narrative becomes crowded and reflexive, the slightest wobble triggers violent air pockets. NVDA has become the ultimate proxy for the AI boom, the most crowded long in the market, meaning it’s the first thing funds sell when risk appetite cools, and the last thing buyers chase during corrections.
Put simply, Nvidia is a phenomenal company priced as if nothing can ever go wrong, while Burry is arguing that much of what looks “perfect” is not what it seems. The bear case isn’t that Nvidia collapses. It’s that the AI boom normalizes, competition accelerates, accounting realities catch up, margins slip toward something earthbound, and investors recalibrate how much they’re willing to pay. In that world, NVDA doesn’t need bad news to fall. It only needs the news to arrive slightly less euphoric than the fantasies currently baked into the price.
#NVDA #Bearish #HeadandShoulders #MichaelBurry

Bear case $NVDAIf we’re sitting in a 1999-style setup — which the chart strongly suggests — then the next move shouldn’t surprise anyone:
NASDAQ:NVDA

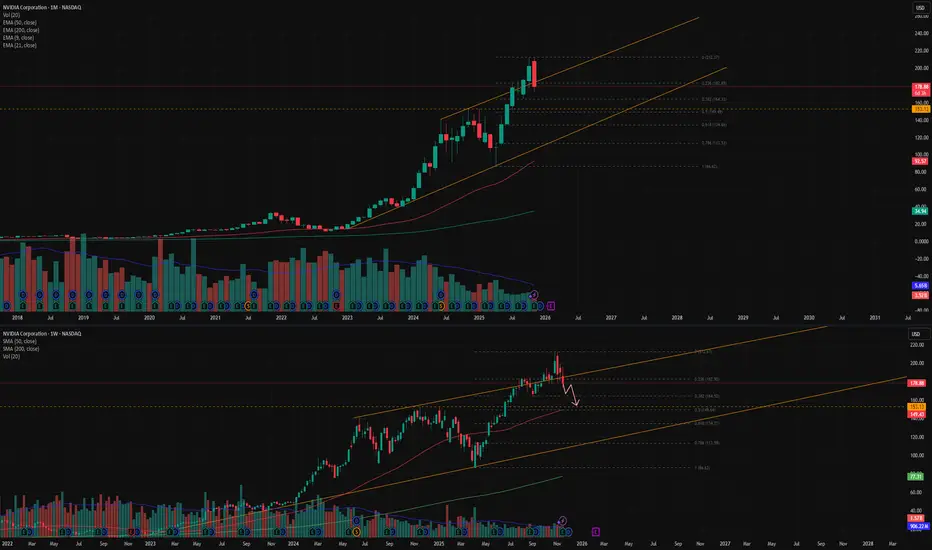
NVDA CORRECTION - MONTHLYThe last 2 corrections based on Monthly chart were roughly 55% and 65%.
Weekly and Monthly charts on indices look like they are trending down. Weekly VIX is in an uptrend. Weekly DXY is in an uptrend.
Overall, it feels like the safest bet is cash or maybe bonds. I don’t love the bond charts, so cash?? Even Buffet has a big cash position…
** This post is my opinion on investment positions, not trading. I use daily or intraday for trading TA.

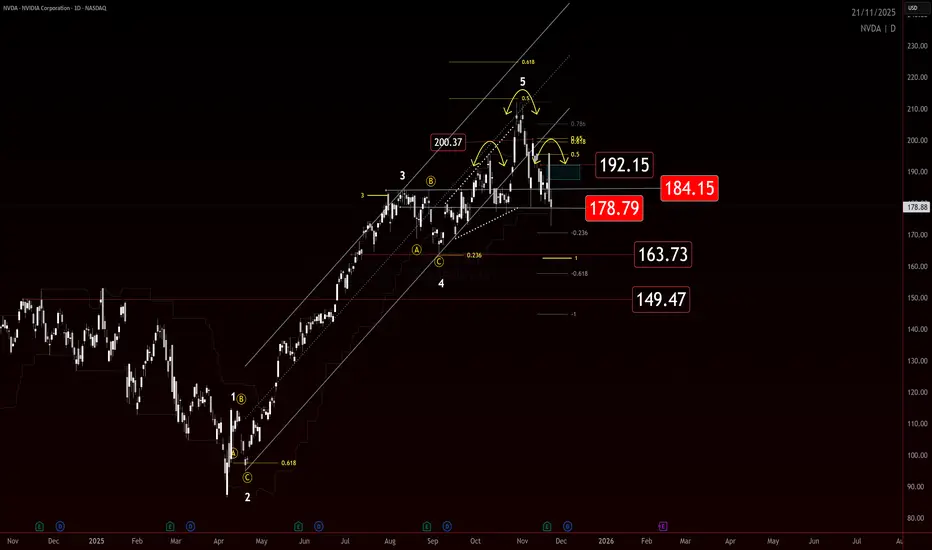
NVDA ALERT: Critical Drop AheadNvidia remains in a broader uptrend, but the chart shows a clear trendline breakout followed by the beginning of a pullback.
Using Fibonacci, a correction typically starts after a red candle forms following a sequence of green candles. In most cases, the pullback continues toward the 0.5 retracement level. In this setup, the 0.5 level aligns with a major key support, increasing its importance.
On the weekly timeframe, the 50 EMA is also converging at the same zone, which often acts like a magnet for price. This creates multiple confirmations pointing toward a potential move downward.
The weekly chart has printed a bearish engulfing , followed by three consecutive red candles, adding another strong confirmation for a continued correction.
Both MACD and RSI are sloping downward, supporting the bearish momentum.
If price reaches the expected zone, monitoring the reaction will be critical. A deeper decline into the global trendline is possible only if the key level is broken, though this scenario appears less likely.
Overall, NVDA shows several aligned signals indicating a move toward the correction zone before any potential recovery.
NVDA TARGETSupport and 200 ma down at 155. Where it goes from there is a ?? — that 😈 top seems hard to get above.

Hi, i'm trying to revisit the Nvidia Journey here i'm trying to do some historical analysis , trying to find some important historical patterns which impacted the Nvidia price movement then and still valid or might impact the future price movement
I' hv a strong believe that price move within the constraint of the historical patterns and form new one for the future
full analysis will take few days, today , i'm starting with simple tl/angles formed by the first 2 monthly candles , in next 3 graphics u will find the impact of these 2 angles

NVDA PUT Trade — QuantSignals Katy High-Conviction ShortNVDA | QuantSignals Katy 1M Prediction (2025-11-21)
Current Price: $178.81
Predicted Close: $173.03 (-3.23%)
30-min Target: $177.19 (-0.91%)
Trend: Bearish
Confidence: 75%
Volatility: 49.6%
Trade Signal
Direction: PUT
Entry: $178.81
Target: $174.18
Stop Loss: $181.49
Expected Move: -3.23%
Summary: 1 trade signal generated from 1 successful analysis.

NVDA Head and Shoulders- Neckline BrokenNvidia’s bear case rests on one core idea: the stock price assumes a flawless, world-eating AI future, and markets almost never deliver on “perfection narratives.” NVDA trades at extreme valuation multiples for a hardware-driven, highly cyclical business. Those multiples only hold if AI infrastructure spending keeps compounding at its current breathtaking pace for years. But that demand is dangerously concentrated in a handful of hyperscalers who are spending now and rationalizing later. Michael Burry’s recent argument sharpens this point: he claims true end-demand for AI horsepower is vastly overstated, and that much of the current GPU frenzy is a self-reinforcing loop of capital, hype, and accounting gimmicks rather than broad, organic need. If boards pause to question real ROI — or if the circular funding loop breaks — Nvidia’s revenue curve can flatten quickly, dragging the valuation down with it.
Competition, long dismissed by NVIDIA bulls, is another structural headwind. AMD is now shipping accelerators that hyperscalers are actually integrating, and every major cloud provider is building in-house silicon to reduce dependence on NVDA’s margins. Even if Nvidia maintains leadership, it doesn’t need to lose the crown to lose the multiple — slight shifts in workload allocation or a handful of missed design wins are enough to pressure margins. And Burry’s critique deepens this point: he argues Nvidia’s reported profitability is flattered by depreciation assumptions and massive stock-based compensation that buybacks have failed to offset — meaning the “true” economic profit is less bulletproof than headlines suggest. Add to that the fact that U.S. export controls have effectively erased the China data-center market — once 20–25% of revenues — and expectations of a seamless global TAM look increasingly unrealistic.
Technically, NVDA is doing exactly what a euphoric, overowned stock does when gravity starts tugging: momentum is fading, the price is slipping under short-term moving averages, and reactions to spectacular earnings have been strangely sluggish. That’s often the early signature of distribution rather than accumulation. And this lines up directly with Burry’s broader thesis: when a narrative becomes crowded and reflexive, the slightest wobble triggers violent air pockets. NVDA has become the ultimate proxy for the AI boom, the most crowded long in the market — meaning it’s the first thing funds sell when risk appetite cools, and the last thing buyers chase during corrections.
Put simply, Nvidia is a phenomenal company priced as if nothing can ever go wrong — while Burry is arguing that much of what looks “perfect” is not what it seems. The bear case isn’t that Nvidia collapses. It’s that the AI boom normalizes, competition accelerates, accounting realities catch up, margins slip toward something earthbound, and investors recalibrate how much they’re willing to pay. In that world, NVDA doesn’t need bad news to fall. It only needs the news to arrive slightly less euphoric than the fantasies currently baked into the price.
#NVDA #Bearish #HeadandShoulders #MichaelBurry

Concerns on market specifically NVDA - Not financial adviceSome thoughts and concerns watching the market as an amateur investor looking at historical shifts and trends. This is not a prediction and not to be considered financial advice in any manner shape or form. It is simply a personal opinion based on my impression of the market. Please discuss any choice you make in the market regarding trades with a financial advisor or planner as this opinion is just an uneducated perspective to be taken with a grain of salt from someone who does not work in the financial industry. There are several factors I have taken into account regarding the economy, job losses, looming Debt Wall, real estate market concerns, tariff pain points for US, recession chatter, dollar weakness, US debt and my personal gut check.
Disclosure - I do not currently hold NVDA but I have a standing buy order for my personal account for NVDA at $50. I do not know the market well enough to short.

DECODED ANALYSIS OF NVIDIANVIDIA is currently in its second last quarterly pattern. After correcting its uptrend form, to restore this pattern the price must either move above $213.99 or hold the support levels at $158.96, $156.29, with major support at $151.05.
Broken pattern support, $106.90
Quarterly skip support, $27.51
Multiple skip supports, lowest at $0.0385
Above current resistance levels are $213.99, $229.61, $250.86, $269.46
Resistance noted for 2030 at $618.83
This message is for educational purposes only.
Always DYOR.

Berish ViewAfter 1 way rally in this stock and after Q3 Good No. We think it's now going to Consolidate face or seen some corrections.
Berish H&S Pattern seen so below yday low .
The confirmation done and stock min 5 to 10% down side seen.
SL is yday high closing.
Disclaimer:- it's my Personal view.

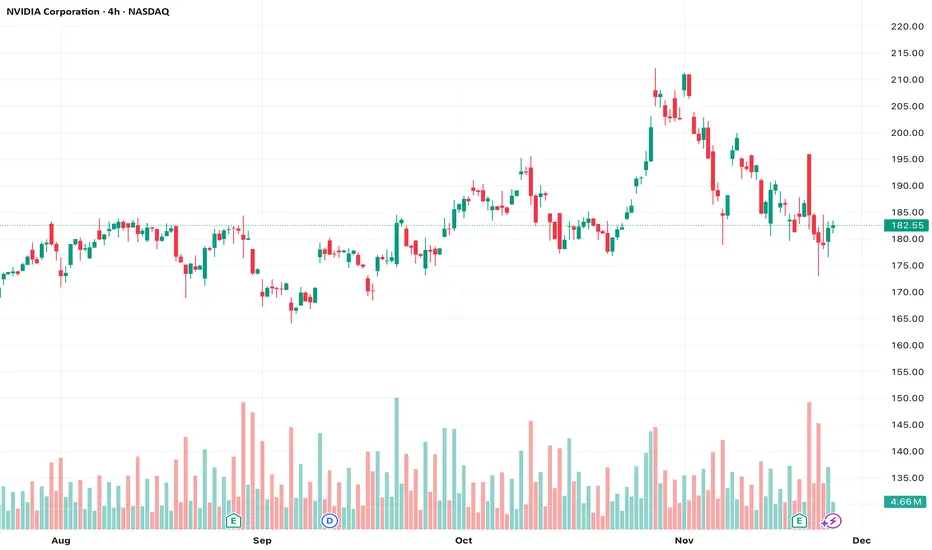
Nvidia Erases Post-Earnings RallyShortly after publishing its earnings, shares of tech giant Nvidia jumped more than 5% at the start of the session; however, a new bearish sentiment quickly took hold of the market, and the stock fell over 7% in the final trading hours, wiping out the gains seen after the results. The company reported strong figures, with revenue of $57 billion, above the expected $54 billion, and projected fourth-quarter sales near $65 billion.
Despite the positive numbers, selling pressure began weighing on the price, mainly because the optimism was likely already priced in, prompting short-term profit-taking. In addition, growing concerns about emerging competition have fueled ongoing weakness in the stock. If market confidence fails to recover soon, selling pressure could intensify in the coming sessions.
Uptrend Losing Momentum
Since November 11, indecisive price action has led to a break of the long-standing upward trendline that had been guiding the stock’s movement. This uncertainty has created a short-term sideways range, with a ceiling at $196 and a floor at $179 per share. As long as these levels hold, a neutral and sideways phase is likely to dominate, indicating lack of clear direction in the short term.
RSI
The RSI remains slightly below the neutral 50 level, suggesting that selling momentum slightly outweighs buying pressure, though not strongly enough to establish a consistent short-term trend. As long as the RSI stays near 50, neutrality in price movement is likely to persist.
TRIX
The TRIX indicator shows a downward slope, moving closer to the zero line, indicating a balance in the strength of the exponential moving averages. This reinforces the indecision in the stock’s short-term behavior.
Key Levels to Watch:
$196 – Main Resistance: Corresponds to the most recent upward retracement zone. A break above this level could revive the bullish bias and reactivate the long-term uptrend.
$188 – Nearby Barrier: Area aligned with the 50-period simple moving average. Price moves near this level could support the formation of a more defined sideways range.
$179 – Key Support: Represents the lowest area from the past two months and serves as the most critical bearish barrier. A drop below this level could trigger a stronger selling bias and mark the start of a short-term downtrend.
Written by Julian Pineda, CFA, CMT – Market Analyst

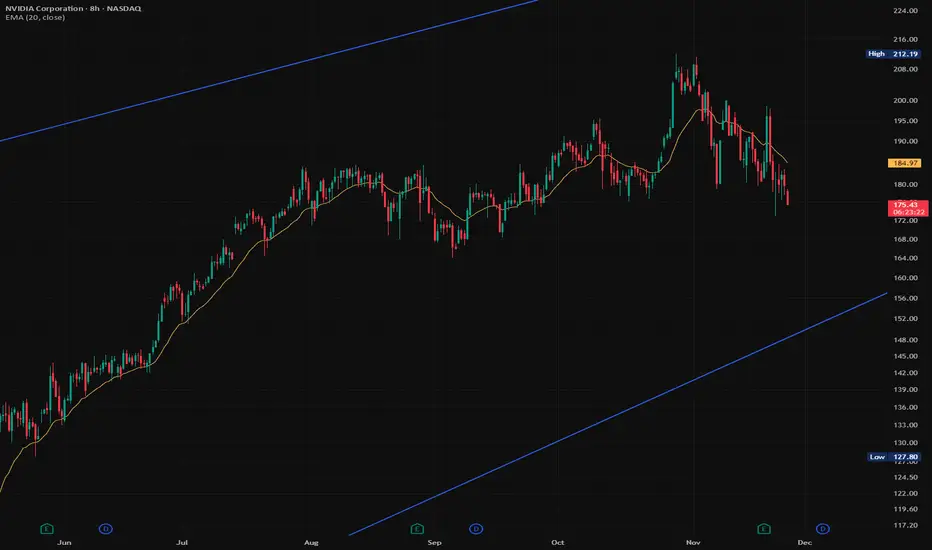
Nvidia Bearish Engulfing Candle at 100 DMAIf this breaks through the 100DMA and has a sustained drop, expect it to go to the next support level of $150 to $152.

How dip can this get ?,bulls needs to defend 181-180 rangeNASDAQ:NVDA bears pushed market lower from a high of 196 ;looking at the chart we see price breaking-through our channel and price trading below our 50 day moving Average ,bulls have to defend 181-180 range a break will signal more selling pressure with remediate support at 177 and 164