Quick intelligence read on $OKLO (Oklo Inc.) based on price-actiQuick intelligence read on NYSE:OKLO (Oklo Inc.) based on price-action + newsflow:
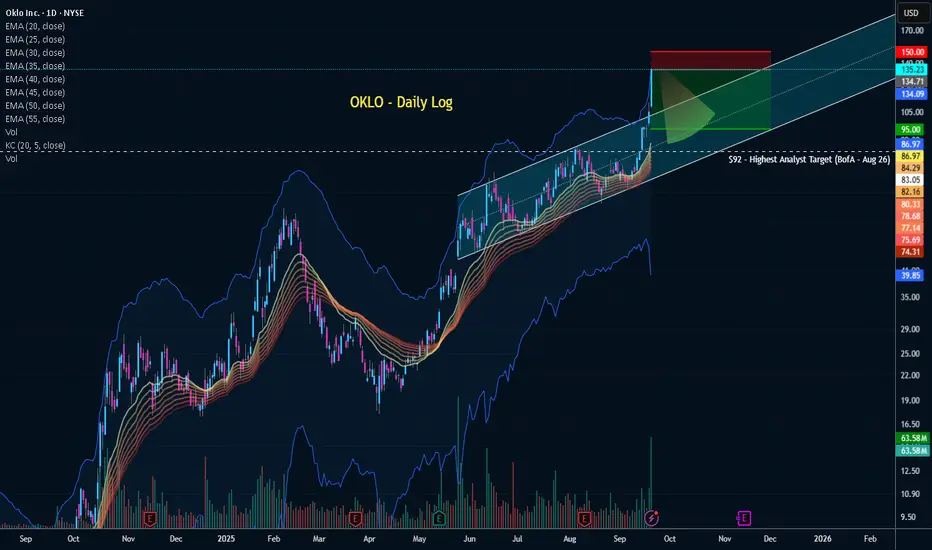
Momentum: Parabolic advance into your 2.414–2.618 fib band (~135–143). That’s a risk-of-blowoff zone, but trend continuation is still viable if price holds 139–143 and builds a tight flag on declining volume (Edwards et al., 2013).
Catalysts still active (bullish tailwinds):
INL groundbreaking for the first Aurora plant + builder named (Kiewit). (Barron’s, 2025).
Barron's
DOE Reactor Pilot Program selections (Oklo + Atomic Alchemy)—policy momentum and pathways to earlier demos. (Oklo IR, 2025; Power-Technology, 2025).
Oklo
+1
NRC process progress (Phase-1 COLA readiness assessment complete). (Oklo IR, 2025).
Oklo
AI datacenter narrative (sector CAPEX surge; OKLO up triple-digits YTD; sell-side target lifts). (IBD, 2025).
Investors.com
Macro narrative boost from U.S.–U.K. advanced-nuclear pact headlines. (Seeking Alpha, 2025).
Seeking Alpha
Counterpoints (risk): Pre-revenue until ~2027 with regulatory and execution risk; valuation stretched after a multi-hundred-percent run (IBD; Seeking Alpha).
Investors.com
+1
Bottom line
“Is it done?” Not necessarily. As long as 139–143 holds as support and we see a 2–5 day digestion with lighter volume, the up-leg can extend toward 177 → 199 (your 3.618/4.236 projections).
“Or still going?” It’s trend-up but late-stage. Treat any close <135 as a momentum failure likely pulling back to ~100–98 → 90.
TradingView post (copy-paste)
NYSE:OKLO – Parabolic leg into 2.414–2.618: Pause or push?
Price just tagged the 135–143 fib band. I’m looking for hold + flag above 139–143 to keep momentum alive.
Plan A (continuation):
Entry: Break/close above 143 after a tight 2–5 day flag.
Risk: Stop <135 or ATR(14)×1.5 below entry (whichever is wider).
Targets: 177 → 199 (3.618 / 4.236).
Plan B (fade to value):
If daily close <135, look for mean-reversion toward ~100–98 → 90 demand.
Why now (catalysts): INL groundbreaking + DOE Reactor Pilot selections + NRC Phase-1 COLA readiness + AI-datacenter power narrative. Manage size; this is late-stage momentum.
Educational only. Not financial advice.
#OKLO #SMR #Nuclear #AI #Breakouts #RiskManagement
In-text citations (APA 7)
INL groundbreaking & builder (Barron’s, 2025).
Barron's
DOE Reactor Pilot selections (Oklo IR, 2025; Power-Technology, 2025).
Oklo
+1
NRC readiness assessment (Oklo IR, 2025).
Oklo
Momentum/valuation context (Investor’s Business Daily, 2025; Seeking Alpha, 2025).
Investors.com
+1
References (APA 7)
Barron’s. (2025, Sept. 22). Oklo stock rises as start-up pushes ahead with first nuclear power plant.
Barron's
Edwards, R. D., Magee, J., & Bassetti, W. C. (2013). Technical analysis of stock trends (10th ed.). CRC Press.
Investor’s Business Daily. (2025, Sept. 22). This nuclear stock isn’t expected to report revenue until 2027 but has surged 560% this year.
Investors.com
Oklo Investor Relations. (2025, Aug. 13). Selected for three projects under DOE’s Reactor Pilot Program.
Oklo
Oklo Investor Relations. (2025, Jul. 17). Advances licensing with completion of NRC readiness assessment.
Oklo
Power-Technology. (2025, Aug. 14). US DoE Reactor Pilot Programme selects Oklo and its subsidiary.
Power Technology
Seeking Alpha. (2025, Sept. 22). Oklo: Another nuclear energy bubble stock to avoid.
Seeking Alpha
Oklo Inc. CEDEAR
No trades
Trade ideas

9/22/25 - $oklo - less power than a potato9/22/25 :: VROCKSTAR :: NYSE:OKLO
less power than a potato
- won't take credit for WagieCapital's post on X that says "if you want something that generates more power than NYSE:OKLO will over the next 3+ years you just need to buy a single potato"
- the reality is, there's a lot of high expectations baked into this spud
- and while power generation is all the rage, there r a ton of gas generating co's (like NYSE:GEV ) that while expensive... r actually investable in a lot ways. my favo is NASDAQ:NXT as many ppl know.
- i wish the husband/wife duo really "wow" me, but reminds a lot of a wework without the kombucha. the credentials here and believability are sky high.
- while it's tough to short. esp easier to short breaks. sometimes the px action becomes so wile and outside of the bolli bands that i just need to pull the trigger. right now NASDAQ:RGTI , NYSE:IONQ , NYSE:OKLO have been my shorts of choice. it's a sport for me. not for the faint of heart. and these things are starting to look weak even in a tape that hasn't lost it's footing for even a moment.
- a sneeze and these high flying memes will catch covid $25.
V

Ascending breakout could go to 200The notion that this is as high as it goes could prove many wrong. The catalyst and this sector in general has been relatively generous this past week. The sentiment is still growing, and even though you will have dips, seller, you still have a short float that could also contribute to the squeeze.

OKLO BUY OPPORTUNITYPrice has broken the ascending triangle, supported by strong fundamentals.
Oklo’s $1.68B fuel recycling facility plan and strong investor sentiment around nuclear + AI energy demand suggest momentum could continue.

OKLO Mania - Time to fade?Why the recent parabolic move?... Friday US-UK nuclear energy deal called the Atlantic Partnership for Advanced Nuclear Energy. The deal is meant to speed up the use of next-generation nuclear technologies like OKLO.
I have nothing bad to say about the company. I recommended buying it earlier this year in March when it was trading in the $20-$30 range (see related publication).
These types of parabolic moves without meaningful fundamental improvement are not super rare, but the pendulum has swung pretty hard here and I think in the next 2 weeks we'll be at a lower price, perhaps still above $100. I don't think it will be necessary short selling but perhaps pull back from either another offering, insider trading, or locking in some profit at these levels.
Insider selling news:
www.barrons.com
Daily Chart for Oklo Inc.Exiting into strenght is VERY diffifcult, and does not mean you are bearish!
distance from 36 day moving average starting to get close to FOMO zone

OKLO — when nuclear momentum breaks resistanceSince late 2024, OKLO had been consolidating inside a clear rectangle between $17 and $59. The breakout from this long-term range triggered a new bullish impulse. The price has since returned to retest the breakout zone, now aligned with the 0.618 Fibonacci retracement at $51.94. The retest has completed, and the price is bouncing upward, confirming buyer interest.
Technically, the trend remains firmly bullish. The price closed above the prior range, EMAs are aligned below, and the volume spike during breakout supports genuine demand. The volume profile shows a clean path toward $100, indicating limited resistance ahead. The structure suggests a controlled rally rather than an exhausted move.
Fundamentally, OKLO is a next-generation SMR (Small Modular Reactor) company focused on delivering compact, efficient nuclear power solutions. Following its public debut via SPAC and recent capital injection, OKLO is transitioning from development to implementation. Institutional interest is holding strong, and the broader move toward decarbonization and energy independence places the company in a strategic position.
Target levels:
— First target: $100 — psychological and technical resistance
— Second target: $143 — projected from prior range breakout
OKLO isn’t just another clean energy ticker — it’s a quiet disruptor with nuclear potential. The chart broke out. The volume confirmed. Now it’s time to see if the market follows through.

OKLO at critical trend lineOKLO is currently pushing against the red trend line to complete this bullish pennant. Since the RSI is making lower lows while the price is making higher highs, it is signaling bullish divergence
September 17th FOMC meeting could see this go both ways, with a 25 point rate cut leading to disappointment, or a 50 point cut taking us all the way to euphoria. Nobody knows, but with this one I'm keeping a tight stop loss
Important info: The red trend line is the master trend line across most of the chart, it is consistent with multiple AI stocks as they all approach this critical moment. Anything above the red trend line signals the euphoria stage in my S & P 500 chart
Nvidia has lead the charge by breaking their red trend line. Perhaps we'll see smaller stocks follow in it's wake

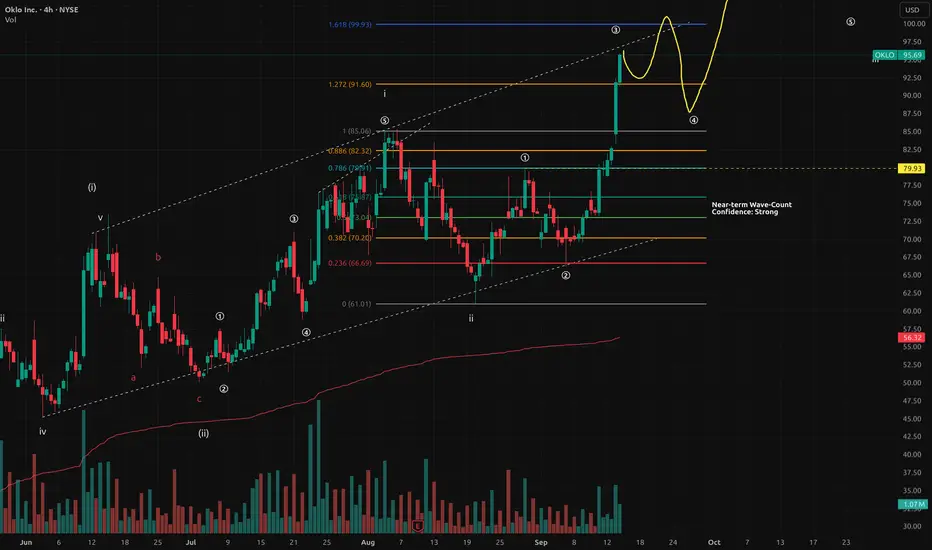
OKLO - Awaiting EntryOKLO is on the precipice of $100 a share, and on the heels of a rather volatile move up. The nuclear industry as a whole has been taking off over the last week. Looking for a mini-expanded flat to contradict the zig-zag we had on wave 1-2.
I am not in this stock currently, just posting this chart as it eyes the level I'm looking to enter. That level being $88-$84, will see how structure plays out.
Wave-Count Confidence: Strong
WARNING! Alternate wavecount is present that shows a potential expanded flat in progress, if that's the case price goes down to sub $61.00 - I feel chances of that are very low given this structure and overall count though.
OKLO (OKLO) – Institutional & DSS AlignmentPrice is breaking out above key resistance, with confluence across technical structure, institutional forecasts, and options flow.
🔹 Technical Setup
Clean breakout above $81.35 resistance and descending trendline.
Support zones: $79.79 (immediate), $73.11 (secondary).
Upside targets:
$88 (supply zone + fib alignment)
$95–98 (institutional target)
$108+ (extension zone)
🔹 Institutional Forecast
Signal: Strong Buy
Target Price: $95.13 (+15%)
Stop Loss: $72.04
Risk/Reward: 1.16:1
Model Agreement: 8 of 9 bullish
🔹 Options Flow (Smart Money)
Heavy sweeps spotted into Sep 19 calls:
$83C ($135k)
$85C ($78k)
$87C ($68k)
Confirms near-term bullish momentum, positioning for upside >$85.
🔹 WaverVanir DSS Projection
15-Day Forecast: $116.90 (+41.3%)
30-Day Forecast: $176.51 (+113.4%)
Sentiment Score: 66 (Bullish Bias)
✅ WaverVanir Trade Plan
Entry: $82–83
Stop: $72
TP1: $88
TP2: $95
Runner: $116+
📊 Outlook: Multi-layer confirmation suggests bullish continuation. Institutional models and smart money flows align with DSS projections—this move could accelerate.
#WaverVanir #VolanX #OptionsFlow #InstitutionalTrading #DSS #OKLO

OKLO - channel breakout here on the dailyOKLO - Stock breaking out of triangle pattern on the daily here. Swing calls added in the group. Seeing some $100 strike calls coming in here. looks like stock ready for triple digits. looking for more calls as long as $80 holds for a move towards $90 and $100.

OKLO - Buckle up for a pullback upto 200MAOKLO sliding along with the rest of the AI names.
This can test the 200MA soon imo.
Short anywhere here and have a tight stop to secure profits.
Target 1 - 60
Target 2 - 50
Target 3 - 40 , most likely, if 50 fails to hold.
Stop loss - 80

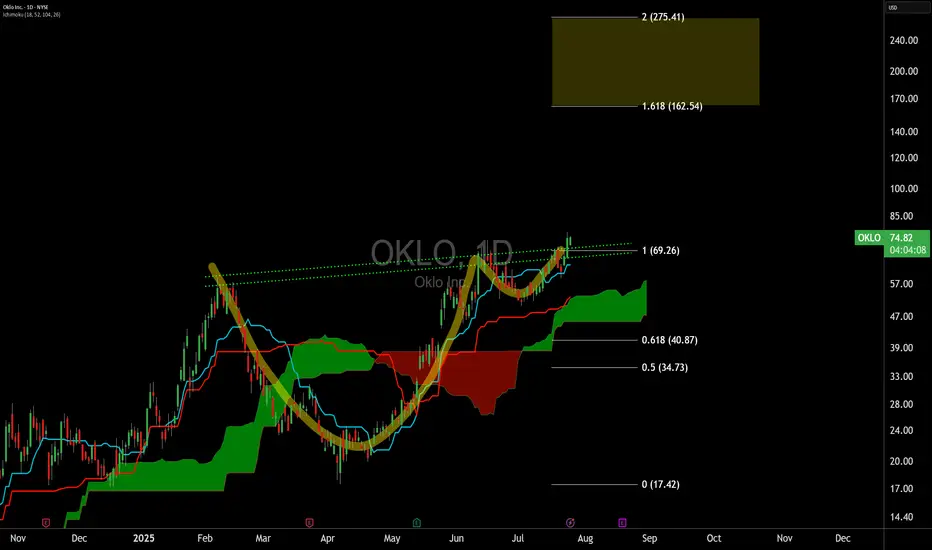
Oklo Stock Chart Fibonacci Analysis 082225Trading Idea
1) Find a FIBO slingshot
2) Check FIBO 61.80% level
3) Entry Point > 68.4/61.80%
Chart time frame:B
A) 15 min(1W-3M)
B) 1 hr(3M-6M)
C) 4 hr(6M-1year)
D) 1 day(1-3years)
Stock progress:A
A) Keep rising over 61.80% resistance
B) 61.80% resistance
C) 61.80% support
D) Hit the bottom
E) Hit the top
Stocks rise as they rise from support and fall from resistance. Our goal is to find a low support point and enter. It can be referred to as buying at the pullback point. The pullback point can be found with a Fibonacci extension of 61.80%. This is a step to find entry level. 1) Find a triangle (Fibonacci Speed Fan Line) that connects the high (resistance) and low (support) points of the stock in progress, where it is continuously expressed as a Slingshot, 2) and create a Fibonacci extension level for the first rising wave from the start point of slingshot pattern.
When the current price goes over 61.80% level , that can be a good entry point, especially if the SMA 100 and 200 curves are gathered together at 61.80%, it is a very good entry point.
As a great help, tradingview provides these Fibonacci speed fan lines and extension levels with ease. So if you use the Fibonacci fan line, the extension level, and the SMA 100/200 curve well, you can find an entry point for the stock market. At least you have to enter at this low point to avoid trading failure, and if you are skilled at entering this low point, with fibonacci6180 technique, your reading skill to chart will be greatly improved.
If you want to do day trading, please set the time frame to 5 minutes or 15 minutes, and you will see many of the low point of rising stocks.
If you want to prefer long term range trading, you can set the time frame to 1 hr or 1 day

OKLO I love the look of this chartLoves that angle the boxes are exactly the same .73 cents difference in the to drops. What can I say about the stripper pole action it has off that trendline

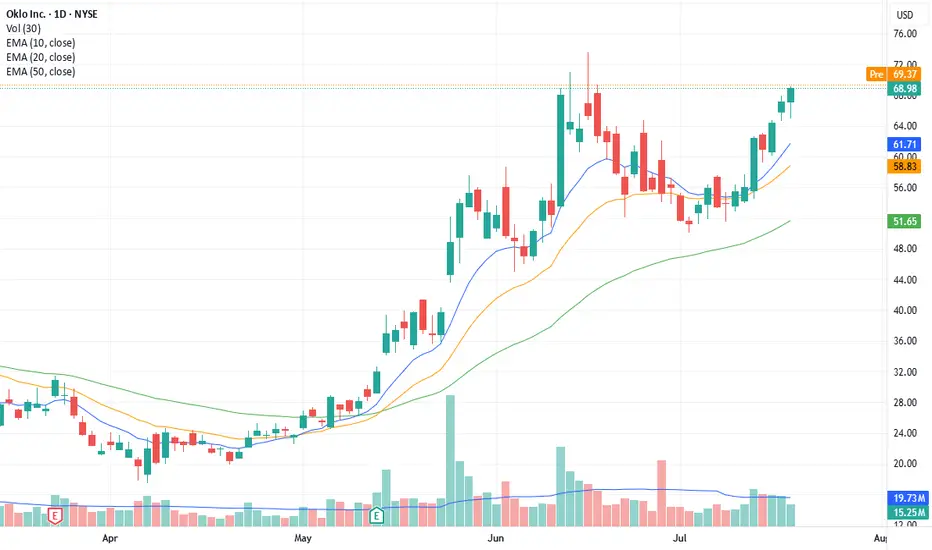
oklo break out The 14 jul 25 was probably a day to buy. of course hind sight is 20/20 but the chart gave a good indication to enter. risk wise maybe the reward we looking for is too much.
alternatively, there have also been places where the chart looked good but in the end getting stopped out. so likely that this one is a missed chance but not one that is perversely glaring
OKLO ALERT: BEARISH OPTIONS SETUP NEAR EARNINGS ⚛️ OKLO Earnings & Options Play (2025-08-11)
### Oklo Inc. \ NYSE:OKLO — **Moderate Bearish Ahead**
---
### 🚨 Quick Snapshot:
* **Revenue:** Development stage, no sales yet — no growth momentum.
* **Margins:** Profit Margin 0%, ROE -56%, ROA -22.8% — severe inefficiencies.
* **Guidance:** Historically weak, avg surprise -87.7%, beat rate only 25%.
* **Analyst Sentiment:** Mixed, forward EPS -\$0.39, target price swings, high skepticism.
### 🔍 Options Market Insight:
* Elevated IV, VIX normal (\~15.9), but \$73 & \$72 puts show strong OI (\~7,271 contracts).
* Put-heavy skew signals institutional bearish hedging.
* Moderate gamma risk near earnings.
### 📉 Technicals:
* Price at \$75.32, above 20 & 50-day MAs but volume fading (avg 10-day vol 18M vs 9.9M now).
* RSI neutral at 61.2 — possible consolidation or bearish pause.
* Resistance: \$76 | Support: \$72
### 🌐 Macro & Sector Context:
* Clean energy tailwinds from gov’t policies, but nuclear regulation & cost pressure linger.
* Market volatility normal; sector structural risks remain.
---
### 🎯 Trade Setup:
**Buy \$73 Put — Exp 08/15**
* Entry: \$4.50
* Stop Loss: \$2.25 (50%)
* Profit Target: \$9.00 (200%)
* Position Size: Max 2% portfolio risk
* Timing: Enter pre-earnings close, exit within 2 hrs post earnings to avoid IV crush
---
### 🔥 Why This Trade?
* Weak fundamentals + bearish options flow
* Technical signs of fading momentum
* Regulatory & cost headwinds in clean energy sector
---
### ⚠️ Risk/Reward Table:
| Metric | Value |
| ------------- | -------------- |
| Entry Price | \$4.50 |
| Profit Target | \$9.00 (+100%) |
| Stop Loss | \$2.25 (-50%) |
| Confidence | 75% |
---
### 📊 JSON Trade Signal for Bots/APIs:
```json
{
"instrument": "OKLO",
"direction": "put",
"strike": 73.00,
"expiry": "2025-08-15",
"confidence": 75,
"profit_target": 9.00,
"stop_loss": 2.25,
"size": 2,
"entry_price": 4.50,
"entry_timing": "pre_earnings_close",
"earnings_time": "BMO",
"expected_move": 5.00,
"iv_rank": 0.65,
"signal_publish_time": "2025-08-11T14:41:19-04:00"
}

$OKLO – Back to the Moneymaker: HTF + C&H Combo at $77.50NYSE:OKLO – Back to the Moneymaker: HTF + C&H Combo at $77.50
Back to my bread and butter setup — NYSE:OKLO is setting up again, and it’s 🔥. We’ve got a high tight flag forming right above the 9 EMA, and to sweeten the deal, there’s a cup and handle structure layered in too.
🔹 The Setup:
After a strong breakout, NYSE:OKLO has spent the past week consolidating tightly above the 9 EMA.
Price action is coiled, volume has dried up — exactly what I want to see before a power move.
This is a high tight flag + cup and handle combo, one of my favorite high-probability setups.
🔹 Trigger Level:
Watching the $77.50 breakout zone — that’s the line in the sand. If you get a good intraday dip to support you can pre-empt the play i like to often scale in a half in anticipation if the market is in a runup phase
A clean push through with volume, and this can speed up fast.
🔹 My Trade Plan:
1️⃣ Entry: Either starter near 9 EMA support or confirmation on breakout over $77.50.
2️⃣ Stop: Under the 9 EMA — no reason to stay if it breaks down.
3️⃣ Target: Measured move extension if it clears $77.50 with juice.
Why I Love This Setup:
HTF + C&H = momentum fuel
This name has already proven itself — we’ve made money here before
The structure, the consolidation, and the setup are all textbook
OKLOunder the current administration, OKLO has potential to continue to surge. Two cups, a gap to fill above, the market may continue to pullback but OKLO has potential long.

OKLO (NYSE: $OKLO) – 15M Liquidity Hunt & Expansion Path📈 OKLO (NYSE: NYSE:OKLO ) – 15M Liquidity Hunt & Expansion Path
Chart by WaverVanir International LLC | VolanX Protocol
We're observing clean SMC structure post-CHOCH (Change of Character) with strong demand defense off equilibrium. Price just reclaimed the ORB high (77.81) and is consolidating under a weak high near $80.42, inside a premium rejection block.
🧠 Institutional Narrative
CHoCH → BOS confirms bullish intent post-manipulation.
Volume spike on reclaim of fair value gap shows potential absorption and re-accumulation.
Fib confluence at 0.618 (78.20) with bullish rejection and internal liquidity grab.
🎯 Targets
Minor: 80.42 (weak high), expect sweep.
Primary: 82.70 (Fib 1.382 extension) aligns with prior premium inefficiency.
Aggressive: 84.99–86.24 (1.786–2.0 extension zone).
🛡️ Invalidation
Break below ORB low 75.52 would invalidate current bullish structure short term.
🧭 VolanX Signal
This aligns with a Liquidity Expansion Playbook inside the institutional price delivery model. Watching for continuation if $80.42 sweep holds with strength.
Disclaimer: For educational purposes only. Not financial advice. #VolanX #SMC #Trading #OKLO #Stocks #LiquidityHunt #MarketStructure #InstitutionalTrading

OKLO 75.50RECOMMENDED STRATEGIC ENTRIES
Bullish: (75.60/80.00) Target (82.00–83.00) Stop (74.50)
Bearish: (72.40/70.00) Target (71.00–70.00) Stop (74.00)

OKLO C&HC&H chart pattern in a hot sector seeing support by the US Government. The intersection of energy, uranium, nuclear, utilities, data centers, the grid, AI, etc.
SL = LL at 58
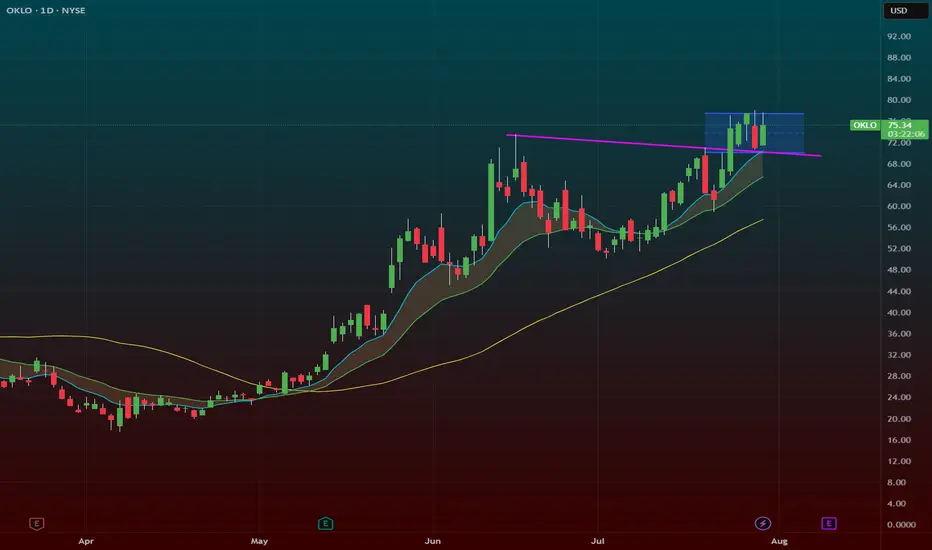
OKLO ($OKLO) — Consolidation After a Powerful Run: What’s Next?NYSE:OKLO After a +180% breakout earlier this year and a strong return above the $60–62 resistance zone, OKLO is now consolidating under $73.40. Let’s break it down 👇🔍 Technical Overview (4H chart)
• Breakout above key resistance ($59–62), which now acts as support.
• Price is consolidating in a bullish flag formation.
• Bollinger Bands are tightening — potential volatility ahead.
• Volume declining — market in a wait-and-see mode.
📉 Indicators:
• Stochastic Oscillator: curling down from 80+ zone — short-term exhaustion
• RSI: rolling over below 60 after peaking near 70 — momentum is fading
• Price Action: Still holding above support, but losing bullish strength📰 What drove the price to $55 (Feb 2025)?
• ✅ Wedbush sets $55 target, highlighting AI data center energy demand
• ✅ Q1 earnings: net loss narrowed to $0.07/share from $4.79/share
• ✅ Regulatory optimism: fast-track support for SMRs by U.S. government
📉 The following correction was largely technical (profit-taking after overextension).🚀 Why OKLO surged again to $73+ (June 2025)
• 🛡 $100M DoD contract for Aurora reactor on Eielson Air Force Base
• 💸 New capital round ($460M), backed by Bill Gates and Nvidia Ventures
• 📈 Wedbush upgrades target to $75, citing defense + AI synergy📐 What I’m Watching Now
Price remains above key support (~$61.8), but both RSI and Stoch are weakening. A breakdown below support may open the way for deeper correction — but volume will be the trigger.
📌 Break above $73.40 on strong volume could mark the next bullish leg

OKLO eyes on $72.37: Golden Genesis fib that should give a DIP OKLO going nuclear into a Golden Genesis fib at $72.37
Looking for a Dip-to-Fib or a Break-n-Retest new longs.
Most likely a few orbits around this ultra-high gravity fib.
.
Last Plot caught break and sister Genesis Fib
.
Older Plot caught the perfect Dip-to-Fib buys:
.
Hit the BOOST and FOLLOW to catch more such EXACT trades.
=======================================================
