ORCL Bearish Break: Katy AI Signals Downward MomentumORCL QuantSignals Katy 1M Prediction 2025-12-11
QuantSignals Katy AI Stock Analysis
Analyzed 1 stock(s): ORCL
📈 ORCL Analysis
Current Price: $198.71
Final Prediction: $194.76 (-1.99%)
30min Target: $196.42 (-1.15%)
Trend: BEARISH
Confidence: 63.3%
Volatility: 27.4%
🎯 TRADE SIGNAL:
Direction: PUT
Entry: $198.71
Target: $195.55
Stop Loss: $201.69
Expected Move: -1.99%
Summary: Generated 1 trade signals from 1 successful analyses out of 1 symbols.
Oracle Corporation Shs Cert.Deposito Arg.Repr. 0.3333 Shs
No trades
Market insights

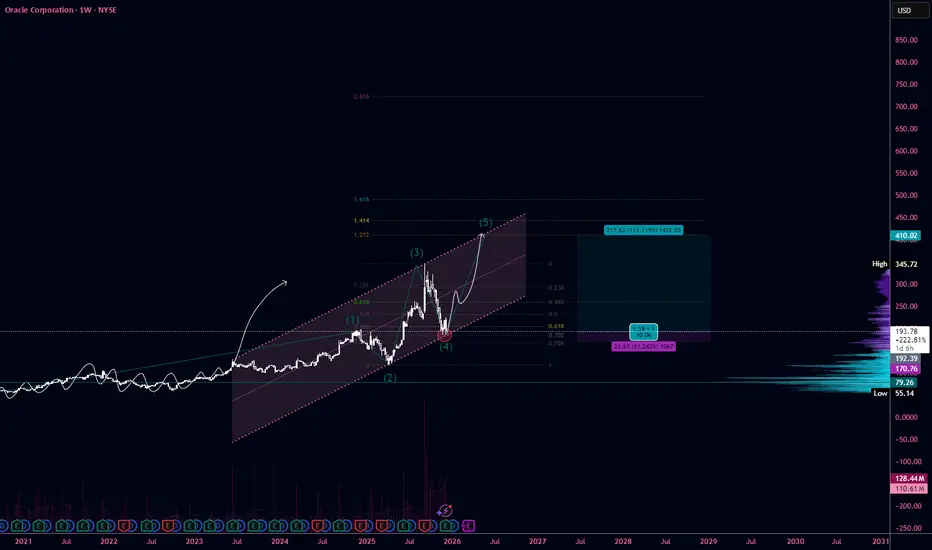
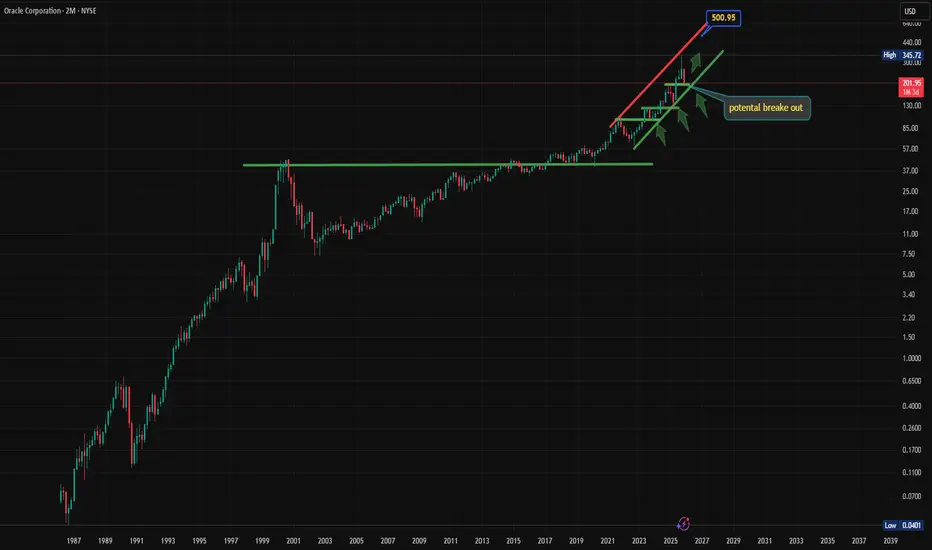
#ORCL R:R 1:10 The start of the fifth wave target $400NYSE:ORCL
TF: 1W
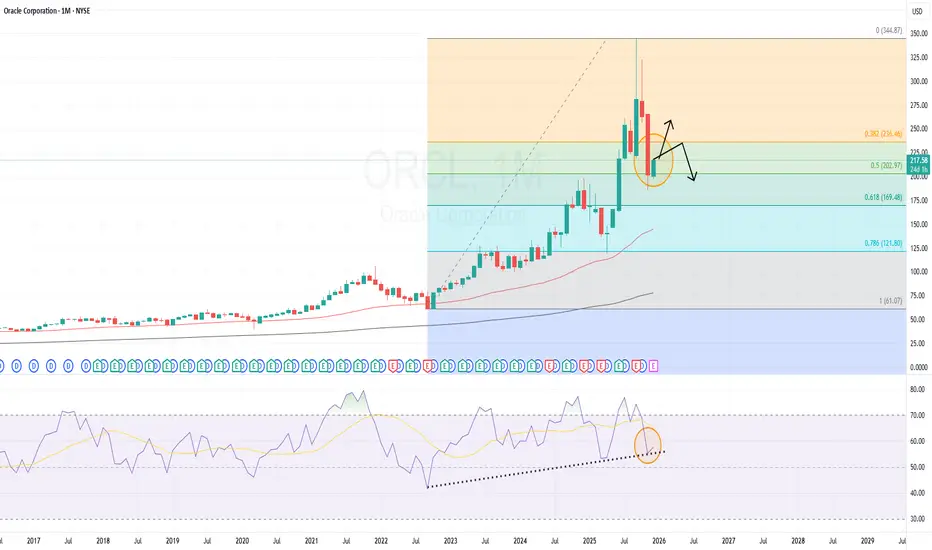
Oracle continues to move within a well-defined ascending channel, forming a clean 5-wave impulsive structure. The price is currently coming out of a completed wave (4) correction, which perfectly tapped into the key retracement zone:
• 0.618–0.786 Fibonacci retracement
• High-volume node on VPVR
• Lower boundary of the rising channel
This creates a strong technical cluster that supports a bullish continuation.
••Main Idea
I expect a full development of the final wave (5), which may extend further as Oracle continues to benefit from cloud growth, AI infrastructure demand, and corporate IT spending.
•••Why This Looks Like Wave (5)
1.Wave (3) was strong and impulsive with a clear vertical expansion.
2.Wave (4) formed a prolonged and corrective pullback — typical for large caps.
3.VPVR shows a dense demand cluster at the correction bottom.
Price respected the long-term trendline and re-entered the channel.
ORCL long-term TAWatch out for Oracle to break the current uptrend on weekly, it's getting weaker along with the distribution on daily which has started about a month ago and still ongoing. The current weekly uptrend is still holding up but it's getting weaker and in danger for a possible downtrend, for now we need more time to see the confirmation.
Watch the blue lines as pivots to hold the support.

ORCL, Extended Base Going OnLongTerm Swings
NYSE:ORCL is still working on a base. The shape looks good and we are waiting for the new Bullish Break.
The Weekly scenario is 100% bullish IMO.
The previous LW returned a +50%
#TCLevels

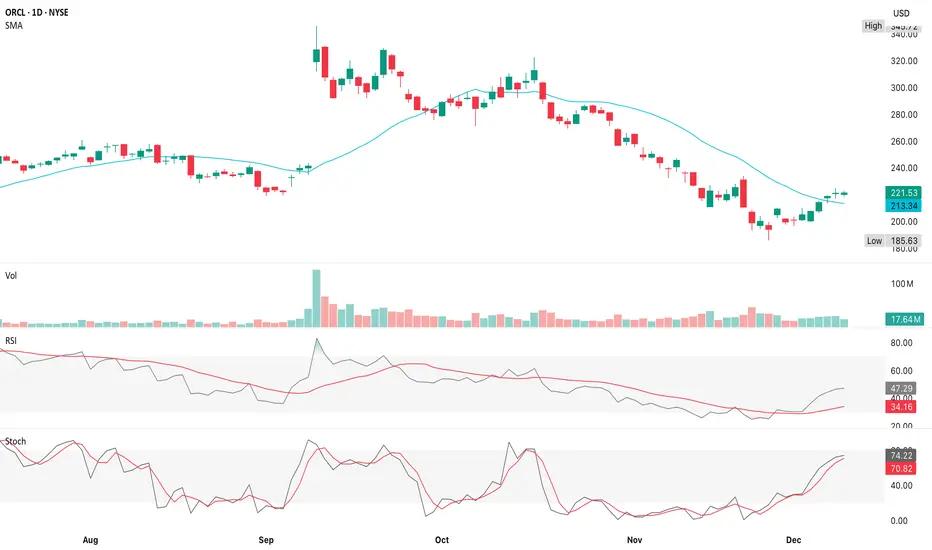
ORCL A Tradable Bounce?ORCL is in a deep downtrend, a capitulation low & now a first bounce back toward the declining 50d MA
ORCL sold off brutally from the $320s to $185
The recent bottom was high-volume, capitulation-like, followed by a sharp multi-day reversal
Price has now reclaimed $220, which was an important support-turned-resistance in the prior trend
The stock is approaching the declining 50d MA, which is almost always a test in the first rebound after a major trend break
A technical rebound is underway, but ORCL has not confirmed a trend reversal
The stock is in a repair phase, not a confirmed uptrend
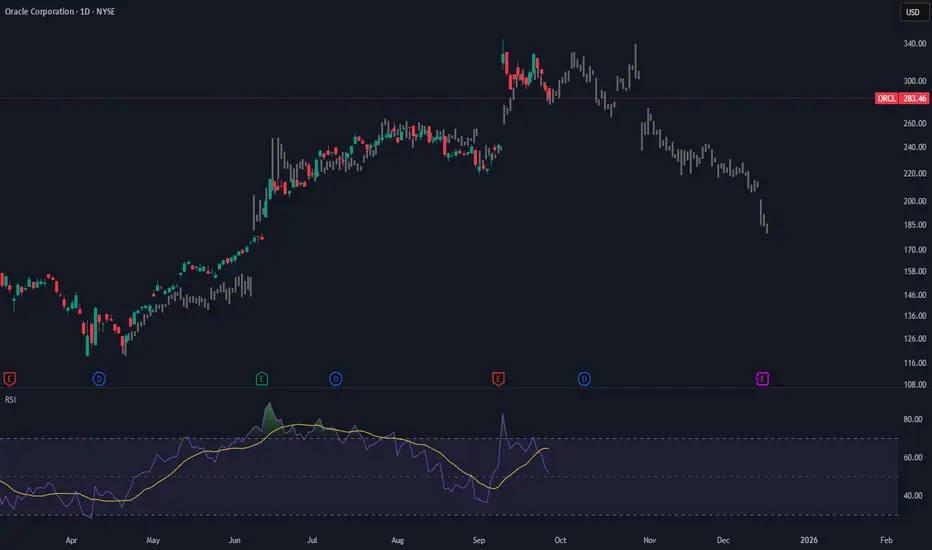
RSI has lifted from deeply oversold levels and is now around 47-48
That’s a constructive shift - rising momentum off oversold levels is bullish, but not yet a momentum breakout
Stoch is fully overbought (~70–75) & still rising
In the context of a downtrend, this often signals a pause or pullback is coming before trend reversal is confirmed
Momentum is improving but stretched short-term, raising odds of chop or a retest into earnings
ORCL’s volume spike at the low looks like flush + reversal demand
Subsequent up-days have lighter demand, suggesting early buyers grabbed the low, but institutions have not returned aggressively
This is a tradable bounce, but not a major accumulation
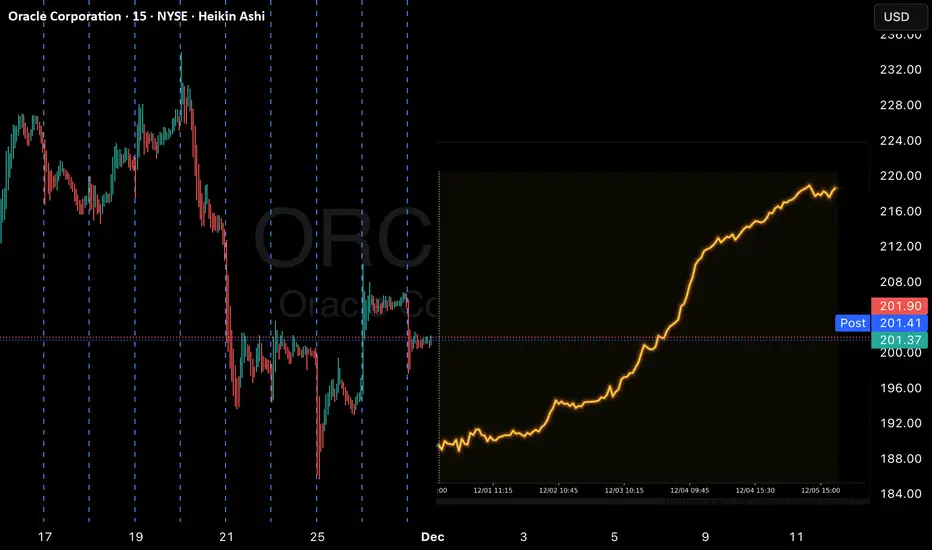
ORCL typically carries +/-4% to +/-6% expected move into earnings
For price at ~$223, that implies a post-earnings range of roughly $211-$236
If volatility spikes ahead of earnings (as it often does for ORCL), the upper end can reach +/-7% (~$207–$239)
ORCL rarely makes outsized earnings moves unless guidance shifts meaningfully
ORCL tends to drift higher into earnings after selloffs
Post-earnings first day moves are usually +3% to -4%, with relatively few >8% outliers
Guidance commentary typically matters more than the headline numbers
The current relief rally fits ORCL’s typical pre-earnings posture, but historical reactions skew toward moderate moves, not blowouts
Resistance
$225–$230 is immediate resistance near the 50d MA
$240 is a strong supply level from the October breakdown
$260 is only reachable on a major earnings beat + guidance upgrade
Support
$210 is the first level buyers must defend
$200 is a psychological + structural support
$185–$190 is the the capitulation low & losing this would signal a failed recovery & potential new down-leg
1. Bullish (high-quality beat + upbeat cloud/AI commentary)
Price breaks above the 50d MA with volume
Push into $235-$240
Follow-through toward $250 possible if guidance confirms acceleration
~30%
2. Base Case (meets expectations, but no powerful guide)
ORCL stalls at/near the 50d MA
Post-earnings drift into $215-$225
No trend reversal, but also no collapse
~50%
3. Bearish (miss, weak bookings, soft guide)
Price rejected at 50d MA & drops below $210
Retest of $190-$200
If $185 breaks, downtrend resumes
~20%
The rebound is real, but it is early, it is approaching the first major resistance, momentum is short-term overbought & ORCL remains in a primary downtrend until proven otherwise
This setup favors a modest move higher into earnings, not necessarily after earnings
Upside is possible, but requires a strong fundamental catalyst
AMEX:SPY
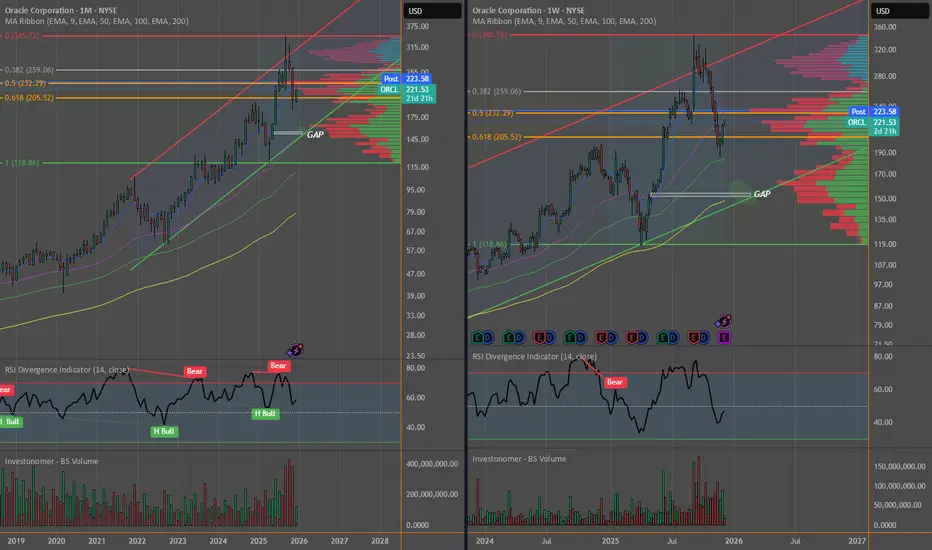
Potential Long-term Setup for ORCLORCL may pull back into the $150–$175 zone — a confluence of long-term trend support, a weekly gap, and high-volume profile levels. If earnings disappoint or macro/AI sentiment weakens, a retest of this area is likely before the broader uptrend resumes. If Earnings are strong & Guidance is good, potential upside towards the ~$250 level.
Technical Overview:
Price has already retraced significantly (~ -40%) from its highs and continues to close prior gaps on the daily and weekly charts. One meaningful gap remains at $152–$154, which aligns with:
- The bottom of the long-term upward trend channel
- A high-volume node on the YTD Volume Profile
- The 50 EMA (monthly) and 200 EMA (weekly)—both historically respected support levels
This stacking of structural support levels creates a high-probability demand zone. If price reaches this region, I will look for confirmation such as a bullish reversal pattern on the daily/weekly, RSI divergence, or strong buying pressure.
On shorter timeframes, the 5 Year Fibonacci retracement adds another layer to the structure. the 61.8% retracement sits ~ $168, aligning closely with the long-term trendline support and reinforcing the $150-175 demand zone.
Fundamental Context
ORCL has benefited from AI-driven optimism and continues to guide for strong growth. However, rising debt concerns, elevated CAPEX, and negative FCF in recent quarters introduce short-term risk, especially as ORCL CDS spreads have risen sharply, signaling increased perceived credit risk. Revenue growth remains healthy and EPS has grown meaningfully over the past five years, and operating cash flow remains strong.
Analysts maintain bullish long-term expectations (consensus ~ $340), but a near-term pullback is reasonable as investors reassess the ROI of recent investments. The lowest price targets sit around the $175 level.
Fair Value Estimates:
Intrinsic: ~$380
Relative valuation: ~$320
Historical multiples: ~$120
Blended fair value: ~ $275
This aligns with the top of the YTD Value Area — a reasonable medium-term target if earnings are solid.
Profit Targets:
On the upside, the 5 Year retracement ~ $278 lines up with the medium fundamental target and matches upper value-area on the YTD Volume Profile. Looking shorter term, the 1 Year Fibonacci retracement ~ $260 coincides with the previous ATH, which creates a clear near-term resistance level. Likewise, the 5 Year chart highlights a retracement level ~ 236 while the daily chart shows a cluster of the 50EMA & 100EMA ~ $237, creating a strong technical resistance in the near term before seeing a shift back towards the upside.
- Target 1: $260
- Target 2: $275
- Target 3: $345
Confirmation:
- Bullish reversal candle on daily/weekly
- RSI bullish divergence
- High-volume cluster at the lower trendline
- Bounce from weekly gap close
Summary
ORCL remains a strong long-term name positioned to benefit from AI adoption, but short-term weakness may bring price back into a structurally important support zone. A pullback into $150–$175 offers an attractive risk-reward long setup supported by technical confluence and long-term fundamental upside.
$ORCL - Oracle Earnings On WednesdayAfter blasting off a couple of months ago, Oracle stock has dipped over 45% from its all time high.
Oracle’s upcoming earnings report is expected to highlight the company’s accelerating transition toward high‑margin cloud and AI-driven infrastructure. Wall Street is focused on whether Oracle can sustain mid‑teens revenue growth while expanding operating margins amid heavy capital spending.
Cloud Infrastructure, or OCI, remains the key swing factor, with demand from AI model training and enterprise workloads driving backlog and remaining performance obligations. Capital expenditure levels and free cash flow trends will be critical, given rising debt tied to data center expansion. A strong update on cloud growth and forward visibility could support the stock, while cautious guidance could pressure shares in the near.
Using Intrinsic Valuation methods such as DCF/FCF models, we get an estimated fair value stock price of $247.20 per share.
Earning Report is expected on Wednesday.
Disclaimer:
I do not provide personal investment advice and I am not a qualified licensed investment advisor. I am an amateur investor.
All information found here, including any ideas, opinions, views, predictions, forecasts, commentaries, suggestions, or stock picks, expressed or implied herein, are for informational, entertainment or educational purposes only and should not be construed as personal investment advice. While the information provided is believed to be accurate, it may include errors or inaccuracies. I will not and cannot be held liable for any actions you take as a result of anything you read here.
Conduct your own due diligence, or consult a licensed financial advisor or broker before making any and all investment decisions. Any investments, trades, speculations, or decisions made on the basis of any information found on here, expressed or implied herein, are committed at your own risk, financial or otherwise.
Feel free to give us a follow and shoot us a like for more analysis updates

Analysis of the $ORCL stock chart
NYSE:ORCL is set to release its earnings later this week, so I wanted to take a closer look ahead of the report. On the 1-month timeframe, plotting the Fibonacci sequence shows that the recent pullback found support at the 0.5 Fibonacci level, accompanied by a bullish engulfing pattern — a potential signal for further upside.
The RSI remains above 50 and is trending upwards, which adds to the bullish case. However, earnings could be a key swing factor, potentially moving the stock sharply in either direction.
From a technical standpoint, this setup suggests a watchlist-worthy opportunity. If the stock holds above key support levels, momentum could carry it higher, but traders should be mindful of volatility around the earnings release.
NYSE:ORCL heads into Dec 10 earnings with the stock down from Sept highs. Cloud & AI growth could drive a beat, but debt & cap‑ex weigh. A strong report may lift the stock, a miss could keep it under pressure. #Oracle #AI #Cloud #EarningsSeason
ORCL: Possible traceHello,
I found a pattern ORCL might be following, this is just for information purpose.
This may fail or may follow exactly same.
Happy investing
NYSE:ORCL
ORCL Weekly Signal: Overbought & Set for PullbackORCL Weekly Signal | 2025-12-01
Instrument: ORCL
Strategy: Weekly PUT (Short)
Strike Price: $195.00
Entry Price: $8.75 – $9.20
Target 1: $13.85 (50% gain)
Target 2: $16.65 (80% gain)
Stop Loss: $6.50 (≈30% loss)
Expiry: 2025-12-05 (4 days)
Position Size: 2% of portfolio
Confidence: 58%
Weekly Momentum: NEUTRAL (+0.85% 1W)
Options Flow: Neutral
Risk Level: MODERATE-HIGH
Technical Notes: RSI overbought at 78.8; price near session high; 70% of Katy AI predictions below current price
News Sentiment: Mixed; recent weakness in Oracle cloud sector
Katy AI Prediction: Bearish, price could drop to ~$197.36
⚠️ High Risk Warning: Use only a small position size due to conflicting signals and moderate confidence.
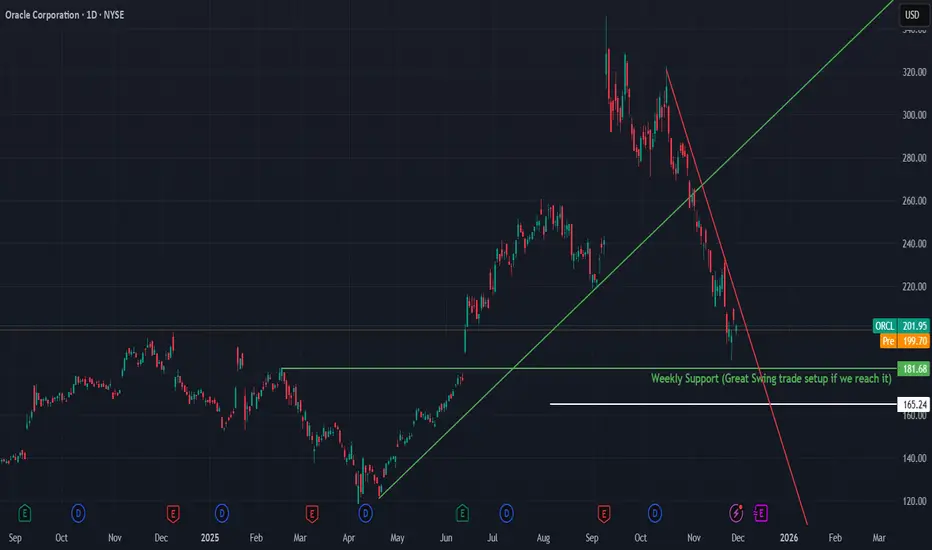
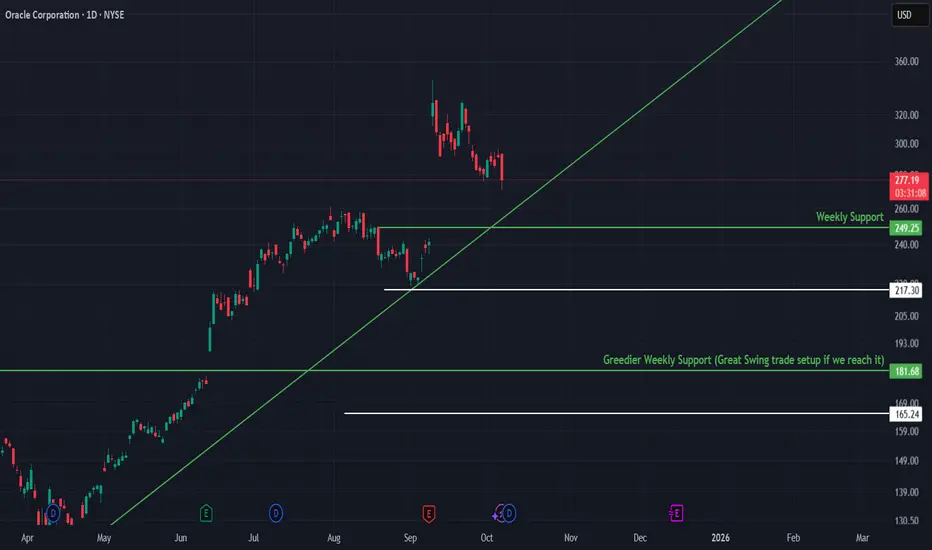
Oracle (ORCL) Approaches Key Weekly Support After Trend BreakOracle experienced a strong multi-month uptrend before breaking its major ascending trendline (green line). This break triggered a sharp downside move, forming a new short-term downtrend (red line). Price is now moving toward a critical weekly support at $181.68, which stands out as a major reaction zone.
🔍 Technical Analysis
Current Price: ~$202
Recent price action highlights:
A confirmed break of the long-term uptrend
A clean, accelerating downtrend in place
Price heading toward major weekly support at $181.68
Structure:
Clear downtrend with well-defined support levels that may offer strong risk–reward setups if reached.
🛡️ Support Zones (if pullback continues)
🟢 $181.68 | Stop-loss: $165
Major Weekly Support — Great swing trade setup if reached.
🧭 Outlook
There are three valid approaches depending on the trader’s style:
1️⃣ Enter now and wait
A trader may open a starter position before support is reached. This avoids the risk of missing the move entirely but requires patience as price develops.
2️⃣ Wait for the $181.68 weekly support
This is the cleanest structural level, but there is a real possibility price does not reach it, leaving no entry.
3️⃣ Wait for a break of the downtrend to go long
This is the safest confirmation-based entry. A breakout above the red trendline signals momentum reversal, but usually results in a higher entry price.
Bias:
Bullish only if $181.68 holds or if the red downtrend breaks.
🌍 Fundamental Insight
Oracle’s fundamentals remain intact despite the recent technical weakness. Cloud and AI infrastructure revenue (OCI) continues expanding, supported by strong cash flow, dividends, and buybacks. The correction reflects broader market tech volatility more than company-specific deterioration.
✅ Conclusion
Oracle is trading within a well-defined downtrend while approaching a major weekly support at $181.68.
This is one of the cleanest swing levels on the chart. Traders can choose between early positioning, waiting for the support, or waiting for trendline confirmation depending on their risk tolerance.
If you found this useful, don’t forget to like & follow for more structure-based insights.
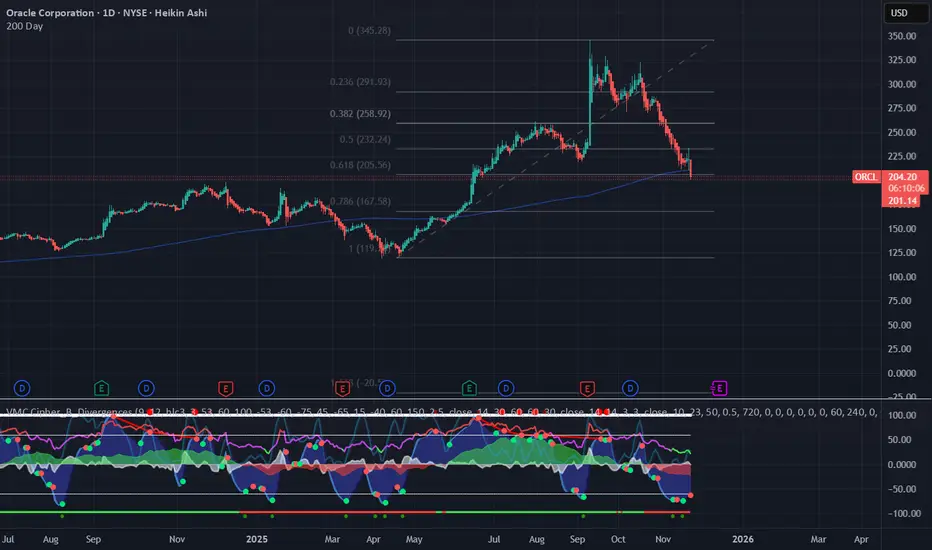
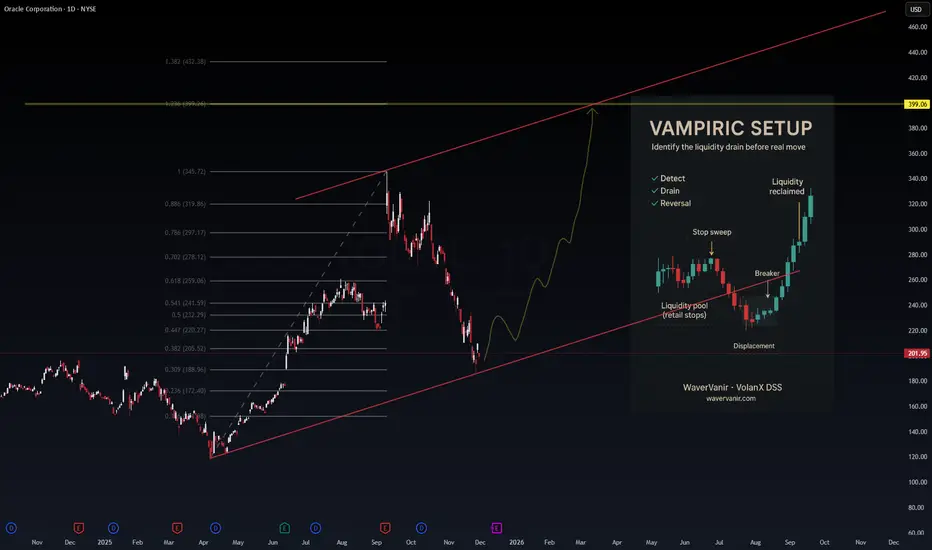
$ORCL — WaverVanir Edge (Vampiric Setup)NYSE:ORCL — WaverVanir Edge (Vampiric Setup)
(Educational Only)
Market Structure:
Price tapped the ascending trendline after a full liquidity drain from the June–Sept highs.
The selloff created a deep retracement into 0.702 → 0.786 zone, a common SMC reversal region.
ORCL is now positioned for a Vampiric Setup — the market drains retail liquidity before revealing the real directional move.
Vampiric Setup Components (From the chart):
Retail stop pools swept
Breaker structure formed
Bullish displacement confirms aggressive repricing
Liquidity reclaimed with momentum
Bias:
As long as structure respects the trendline, bias favors a multi-month rally toward:
Fib 1.0 → $345
Fib 1.382 → $399 (primary target)
Liquidity Map:
Below: liquidity vacuum already drained — limited downside unless macro breaks.
Above: large inefficiencies between 260 → 315 → 345 now become magnets.
Momentum:
A classic “drain → reclaim → expansion” pattern.
ORCL often trends in large waves due to its enterprise cloud cycles.
Key Levels:
Support: 188 / 205
Targets: 315 → 345 → 399
Invalidation: Strong daily close below trendline
Smart money always moves after the drain.
— WaverVanir International LLC
#ORCL #Stocks #VolanX #AI #Liquidity #WaverVanir
Gaps gaps gapsOrcl has filled the large gap at $245 but there still remains many gaps below. RSI is oversold so a bounce should be expected. Earnings may be a catalyst for that.

orcl breaking orcl has seen almost 200% gains and now has pulled back onto support. we have came down 45% and are simply resting support and from here we will need bullish conformation on the smaller times .i will expect a break out as long as we close green next week orcl will be looking ready to move
ORCL Swing Signal: Katy AI Predicts Short-Term UpsideORCL Swing Signal — (2025-11-28)
Instrument: ORCL
Direction: BUY CALLS 📈
Confidence: 58% (Medium)
Horizon / Expiry: 14 days → 2025-12-12
Strike Focus: $210.00
Entry Range: $8.50 – $9.00 (mid $8.75)
Target 1: $12.75 (+50%)
Target 2: $15.30 (+80%)
Stop Loss: $6.38 (-25%)
Position Size: 2% of portfolio
Risk Level: Moderate — recent volatility and low confidence
Katy AI Signal
Bullish bias, recovery potential after 7.96% drop
Predicted mean reversion toward $220–$230 range
40.2% swing range position favors upside
Technical Context
Current Price: $201.30 (< VWAP $206.97) → potential bounce
Key Resistance: $219.07
Support: $185.63
Trend Strength: Weak, but setup favors upside
Candlestick Patterns: None detected
Broader Market: STRONG_BULLISH; SPY & QQQ bullish
Options Flow
Neutral flow, low time decay risk
No unusual activity — potential for momentum shift
Trade Setup & Strategy
Why This Trade: Combines oversold bounce potential with broader market tailwinds
Timing Advantage: Enter after sharp single-day drop; favorable risk/reward
Risk Mitigation: Tight stop loss, small position size, scale in if needed
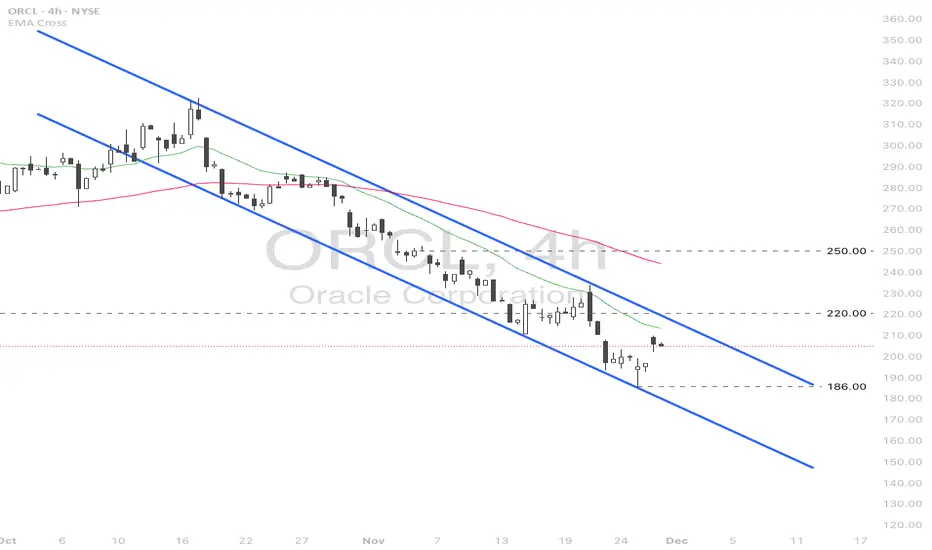
Oracle (ORCL) rebounded on renewed AI momentum.
Surging Alphabet (GOOGL) and revived Nvidia (NVDA) stock prices are leading the AI momentum. Oracle (ORCL), which fell over 40% from its high on amplified doubts over its 300 bln USD computing contract with OpenAI, saw a rebound.
Deutsche Bank assessed the drop in ORCL stock as providing an attractive entry point. They valued the current price as reflecting no positives, citing EPS (ex-OpenAI costs) at 17 USD and FCF at 31 bln USD, both below company guidance.
HSBC also issued a Buy rating on ORCL, expecting various financing strategies for data center costs to be announced, thereby mitigating balance sheet burden and diversifying risk.
ORCL briefly tested the 186.00 low before slightly rebounding. The price remains within the descending channel and below the bearish EMAs, indicating the potential downtrend extension. If ORCL breaches above EMA21 and 220.00, the price could advance toward the next resistance at 250.00.
Conversely, if ORCL fails to close above EMA21, the price may retreat toward the following support at 186.00.
ORCL QuantSignals V3: Market Watching – Awaiting Breakout!ORCL QuantSignals Katy 1M Prediction 2025-11-26
Direction: (Neutral)
Current Price: $205.07
Final Prediction: $205.38 (+0.15%)
30min Target: $205.76 (+0.34%)
Trend: Neutral
Confidence: 40.0%
Volatility: 48.9%
Trade Signal Generated: ❌ None (insufficient confidence/move size)
Summary:
Katy AI predicts a very small move, so no active call or put recommendation.
The stock is essentially in a neutral stance for the short term.
No entry, target, or stop-loss levels are suggested.

Oracle Corporation (ORCL) – Technical & Fundamental OutlookAfter a strong multi-month rally, Oracle (ORCL) recently broke below its short-term trendline, signaling a cool-off in momentum 📉 after months of steady gains.
Currently, price is holding around $275, with the next key weekly support near $249, which could offer a technical rebound opportunity if buyers step in.
The $181–$185 “greedier” support zone remains on the chart its a great swing position but high risk of not reaching it since reaching it requires a deeper tech correction.
📊 Technical Levels
Weekly Support: $249
Deeper Support (High-Risk Of not reaching it): $181–$185
🧠 Fundamental Insight
Oracle continues to strengthen its AI-driven and cloud-focused ecosystem ☁️, transitioning from traditional database services to high-growth enterprise cloud infrastructure.
Cloud services revenue continues to grow at double-digit rates, led by OCI.
Strong free cash flow supports steady dividends and ongoing share buybacks.
Expanding partnerships in AI, ERP, and autonomous data management place Oracle in a favorable position against major competitors like Microsoft and AWS.
These strong fundamentals maintain a long-term bullish bias, even amid short-term volatility.
✨ If you find this analysis useful, please don’t forget to like 👍 and follow for more technical & fundamental updates.
ORCL Neutral Forecast — Insufficient Move for Trade SetupORCL QuantSignals Katy 1M Prediction 2025-11-25
Ticker: ORCL
Current Price: $195.31
Katy AI Final Prediction: $196.01 (+0.36%)
30-Min Target: $195.94 (+0.33%)
Trend: NEUTRAL
Confidence: 55%
Volatility: 39.2%
🚫 Trade Signal
No trade generated — move size and confidence level too low.
📝 Summary
Katy AI forecasts only a mild +0.36% upside, with neutral trend and low conviction, resulting in no actionable setup for ORCL today.
0 trade signals generated from 1 completed analysis.
QS V3 ORCL Weekly Momentum Breakout AlertORCL (QS V3 Weekly | 2025-11-24)
Direction: BUY CALLS
Confidence: 60%
Expiry: 2025-11-28 (4 days)
Strike Focus: $192.50
Entry Range: $9.20 – $9.65 (mid: $9.43)
Target 1: $15.10
Stop Loss: $5.66
Weekly Momentum: Bullish (+1.82% 1W)
Flow Intel: Neutral
Risk Level: ⚠️ Moderate Risk
Katy AI Forecast: Predicts move toward $233.28 (+16.7%) by Nov 26–27, with peak near $247.
Support: $196.87
Resistance: $234.75
VWAP: $205.75
Volatility: VIX 23.43
Recommended Position Size: 3%
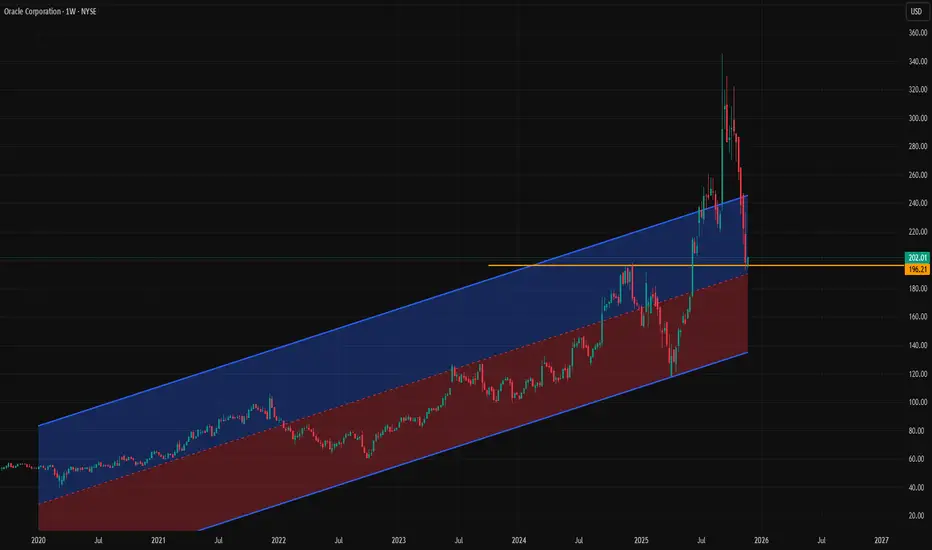
Oracle LongOracle is at the regression line from the start of 2020 (covid to date) and retesting the previous top as a support. If market won't go into full panic it might be a good place to enter.
ORCL Momentum Play: Go Long with QuantSignals V3!ORCL — QuantSignals Katy (1M Prediction | 2025-11-21)
Current Price: $198.11
Predicted Close: $200.82 (+1.37%)
30-min Target: $197.64 (-0.23%)
Trend: Bullish
Confidence: 69.1%
Volatility: 113.3%
Trade Signal
• Direction: Long
• Entry: $198.11
• Target: $200.28
• Stop Loss: $195.14
• Expected Move: +1.37%
ORCL and PLUGWill be beginning to load up clip 2 of orcl here
PLUG had a convertible notes offering hence the drop, this is unlucky but have bought some more due to this