PepsiCo (NASDAQ:$PEP) Reshuffles Leadership as Key Support HoldsPepsiCo (NASDAQ: PEP) is undergoing a significant leadership reshuffle as the consumer staples giant looks to reinvigorate growth and sharpen its global execution. The company announced a broad set of senior management changes aimed at strengthening commercial operations, improving regional performa
PepsiCo, Inc. Shs Cert Deposito Arg Repr 0.0555555 Sh
No trades
325 ARS
8.77 T ARS
84.11 T ARS
About PepsiCo, Inc.
Sector
Industry
CEO
Ramon Luis Laguarta
Website
Headquarters
Purchase
Founded
1965
Identifiers
2
ISINARDEUT111416
PepsiCo, Inc. is a global food and beverage company. The Company's portfolio of brands includes Frito-Lay, Gatorade, Pepsi-Cola, Quaker and Tropicana. The Company operates through six segments: Frito-Lay North America (FLNA), Quaker Foods North America (QFNA), North America Beverages (NAB), Latin America, Europe Sub-Saharan Africa (ESSA), and Asia, Middle East and North Africa (AMENA). The FLNA segment includes its branded food and snack businesses in the United States and Canada. The QFNA segment includes its cereal, rice, pasta and other branded food businesses in the United States and Canada. The NAB segment includes its beverage businesses in the United States and Canada. The Latin America segment includes its beverage, food and snack businesses in Latin America. The ESSA segment includes its beverage, food and snack businesses in Europe and Sub-Saharan Africa. The AMENA segment includes its beverage, food and snack businesses in Asia, Middle East and North Africa.
Related stocks

Can PepsiCo Extend Higher Following This Technical Breakout?📈 ASSET OVERVIEW
Asset: NASDAQ:PEP — PEPSICO, INC
Exchange: NASDAQ
Market Type: Stock
Trading Style: Swing Trade
🧠 TRADE THESIS (BULLISH BIAS)
NASDAQ:PEP has activated a bullish structure following a Triangular Moving Average (TMA) breakout, signaling a potential trend continuation phase.
Pric

PEP (PEPSI) Is ready to RISEThere is a bullish candle and the RSI has risen sharply forming a breakaway gap and the stock is ready to rise higher on increased momentum

PEP | Bullish Move Incoming for Pepsico| LONGPepsiCo, Inc. engages in the manufacture, marketing, distribution, and sale of beverages, food, and snacks. It operates through the following business segments: Frito-Lay North America (FLNA), Quaker Foods North America (QFNA), PepsiCo Beverages North America (PBNA), Latin America (LatAm), Europe, A

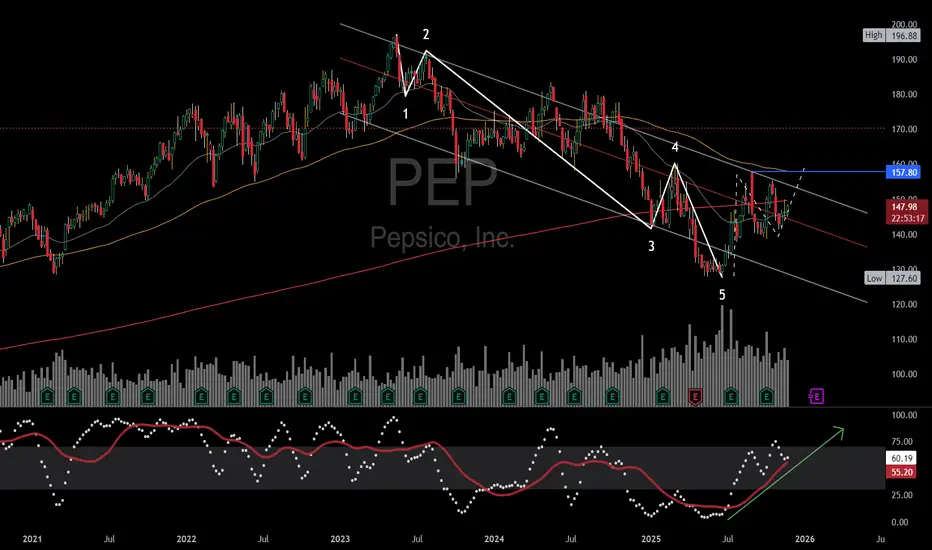
PEP Wave Analysis: The OverviewPepsiCo has been declining for the last 2 years. The impulse pattern down to a 5-year support level was influenced by higher interest rates; comparing PEP to the US10Y will show this relationship. I remember "Higher-for-longer" being the main idea behind the 3rd wave down, and we saw that pin, in th
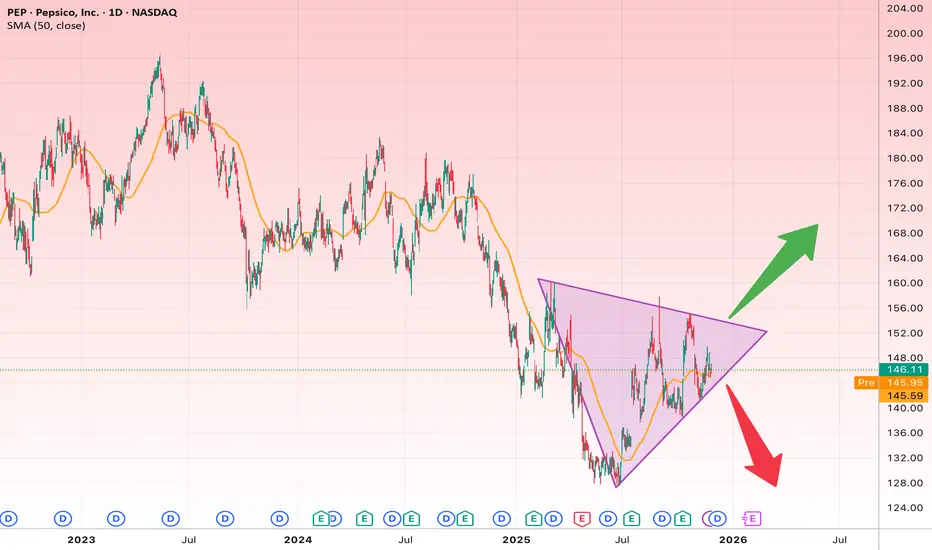
PEP Is Coiling for a Big Move: Breakout or Breakdown?The PEP daily chart is forming a symmetrical triangle, a classic consolidation pattern that often leads to a strong breakout. Price has been bouncing between the upper and lower trendlines and is now positioned around the middle of the structure.
Bullish Scenario
If the price breaks above the upp
Pepsi Bullish UpsideWhether its shares or options. Pepsi is very attractive at this level. For holders of the stock, Pepsi has raised its dividend for 50 straight years.
My levels for longs are this level with a tight stop below the daily higher low at 141.26 for options,
-conservative stop $138.57
-Risky stop $1

$PEPSICO (WEEKLY): inverse HEAD & SHOULDERS, my LONG set-upNo need to get depressed with shitcoins — there are always plenty of great setups and opportunities beyond crypto.
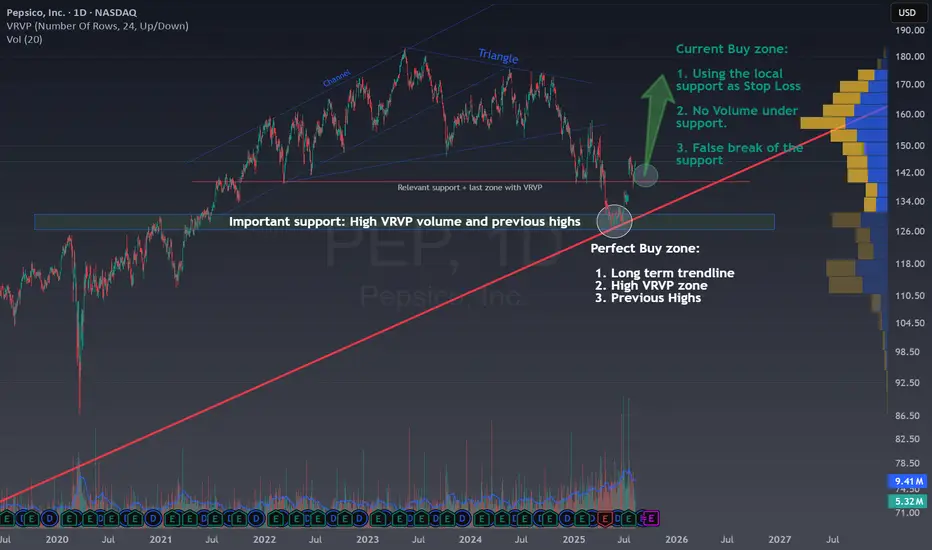
One of them is $PEPSICO (Nasdaq), which is shaping up for a powerful potential LONG setup. An INVERTED HEAD & SHOULDERS pattern has formed, with the head touching a long-term SUPPORT a

Buy Pepsi & thank me later. You all know what I do and seeExtensive long time frame analysis. Found this a few hrs ago! Need to drop a few grand on spot and a small position on Puts! Send it 🔥🔥🔥🚀

Pepsico Yielded 10,5% For 30 Years And Now Is A BargainPepsiCo Yielded 10.5% for 30 Years and Is Now a Bargain
This is an idea for short-term investors like me who are willing to make a 20% gain in the upcoming weeks , but it is also a long-term entry for those who want to include PepsiCo in their portfolio to enjoy a substantial dividend and the
See all ideas
Summarizing what the indicators are suggesting.
Oscillators
Neutral
SellBuy
Strong sellStrong buy
Strong sellSellNeutralBuyStrong buy
Oscillators
Neutral
SellBuy
Strong sellStrong buy
Strong sellSellNeutralBuyStrong buy
Summary
Neutral
SellBuy
Strong sellStrong buy
Strong sellSellNeutralBuyStrong buy
Summary
Neutral
SellBuy
Strong sellStrong buy
Strong sellSellNeutralBuyStrong buy
Summary
Neutral
SellBuy
Strong sellStrong buy
Strong sellSellNeutralBuyStrong buy
Moving Averages
Neutral
SellBuy
Strong sellStrong buy
Strong sellSellNeutralBuyStrong buy
Moving Averages
Neutral
SellBuy
Strong sellStrong buy
Strong sellSellNeutralBuyStrong buy
Displays a symbol's price movements over previous years to identify recurring trends.


