525 ARS
16.54 T ARS
87.27 T ARS
About Procter & Gamble Company (The)
Sector
Industry
CEO
Jon R. Moeller
Website
Headquarters
Cincinnati
Founded
1837
ISIN
ARDEUT110335
FIGI
BBG000FSCHC7
The Procter & Gamble Company is focused on providing branded consumer packaged goods to the consumers across the world. The Company operates through five segments: Beauty; Grooming; Health Care; Fabric & Home Care, and Baby, Feminine & Family Care. The Company sells its products in approximately 180 countries and territories primarily through mass merchandisers, grocery stores, membership club stores, drug stores, department stores, distributors, baby stores, specialty beauty stores, e-commerce, high-frequency stores and pharmacies. It offers products under the brands, such as Olay, Old Spice, Safeguard, Head & Shoulders, Pantene, Rejoice, Mach3, Prestobarba, Venus, Cascade, Dawn, Febreze, Mr. Clean, Bounty and Charmin.
Related stocks
PG The Procter & Gamble Company Options Ahead of EarningsIf you haven`t bought the dip on PG:
Now analyzing the options chain and the chart patterns of PG The Procter & Gamble Company prior to the earnings report this week,
I would consider purchasing the 152.50usd strike price Calls with
an expiration date of 2025-11-21,
for a premium of approximately

Procter & Gamble Is -10% YTD. Here's Its Chart Ahead of EarningsProcter & Gamble NYSE:PG will report earnings this week at a time when its stock has fallen some 10% year to date and the consumer-goods giant has badly trailed the S&P 500 for both the one- and five-year periods. What does technical and fundamental analysis show us?
Let's see:
Procter & Gamble

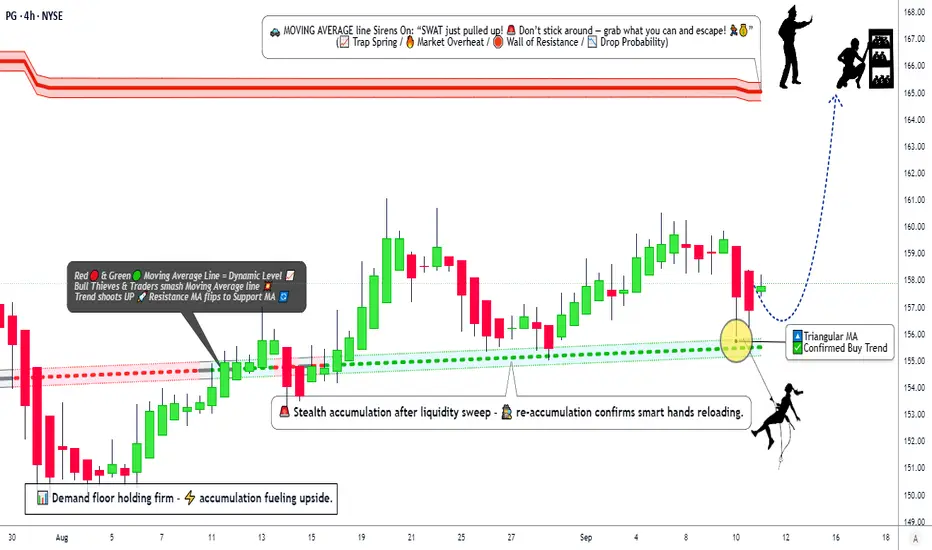
Is Procter & Gamble Setting Up for a Strong Bullish Reversal?🚨 P&G Bullish Master Plan: Steal Profits with the Thief Strategy! 🤑
📊 Asset: Procter & Gamble (PG) – Swing/Day Trade Setup📈 Date: September 11, 2025🎯 Plan: Bullish Triangular Moving Average Pullback – Confirm the Buy Trend!
🕵️♂️ Why the Thief Strategy for PG?
The Thief Strategy is a clever, lay
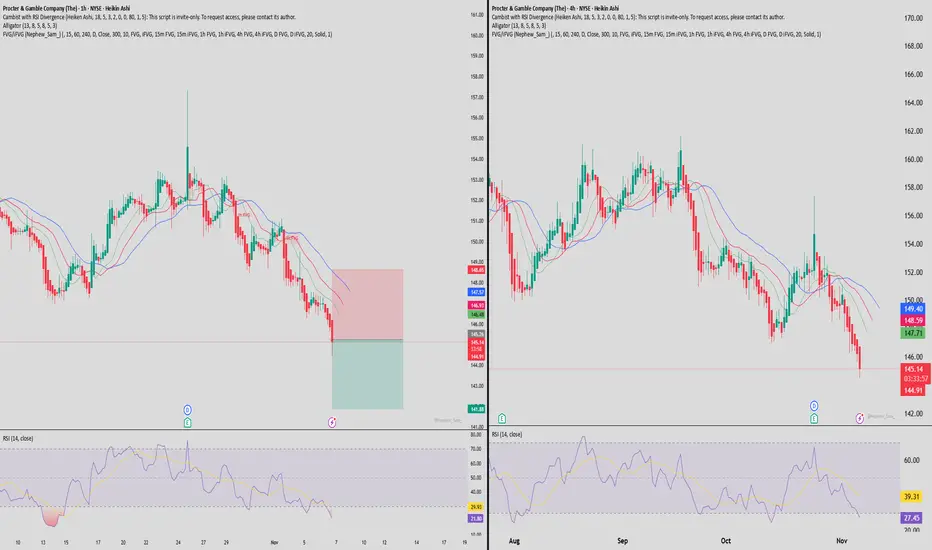
$PG sitting at demand — 149.98 is the line in the sand. Bounce 🧭 PG – Trade Idea (Daily Chart)
Bias:Bearish-to-neutral short-term | Potential swing buy near demand
🔹 Key Levels
Resistance Zones:
179.99 → Major structural high (long-term supply)
171.05 → Intermediate resistance (Fib 50% region)
165.53 → Previous breakdown retest
Support Zones:
156.59 → Cu

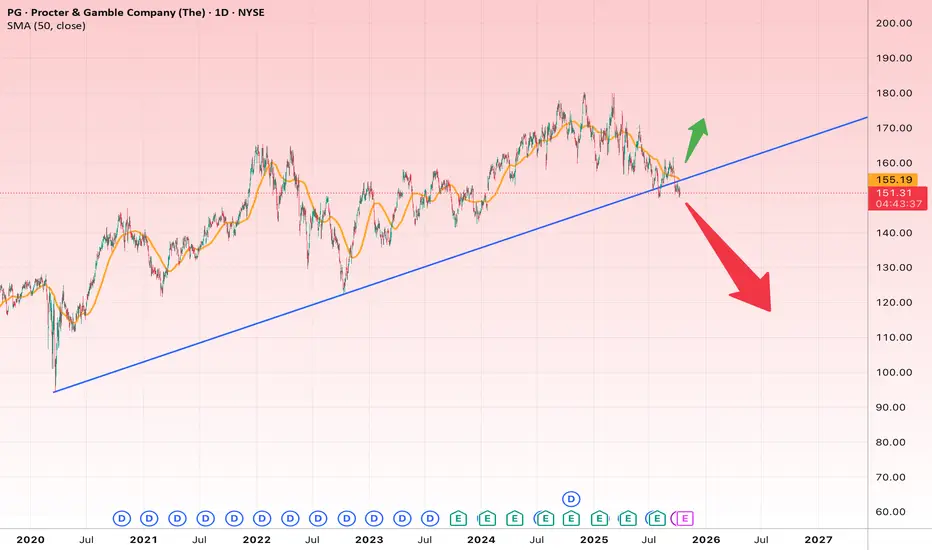
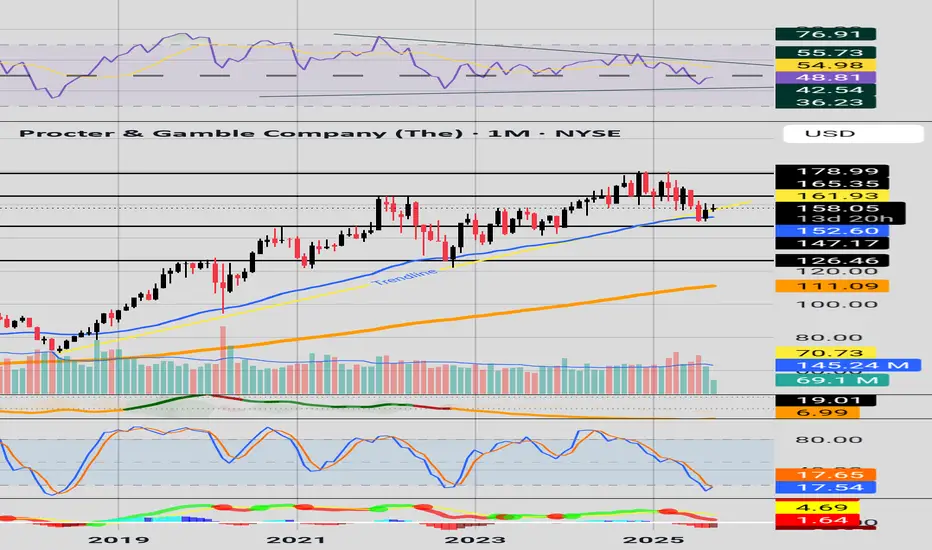
PG at the Edge: Break or Bounce?
🔹 Long-Term Overview
Since 2020, PG has been in a steady long-term uptrend, well supported by the rising blue trendline on the chart.
This trendline has acted as strong support multiple times in recent years — and once again, the price is testing it near the $150 zone.
This area is a make-or-br
PG LongLong entry 152
Stop 148 -- if buy stock directly
Target 160, 180
Risk management is much more important than a good entry point.
I am not a PRO trader.
In my trading plan, the Max Risk of each short term trade should be less than 1% of an account.

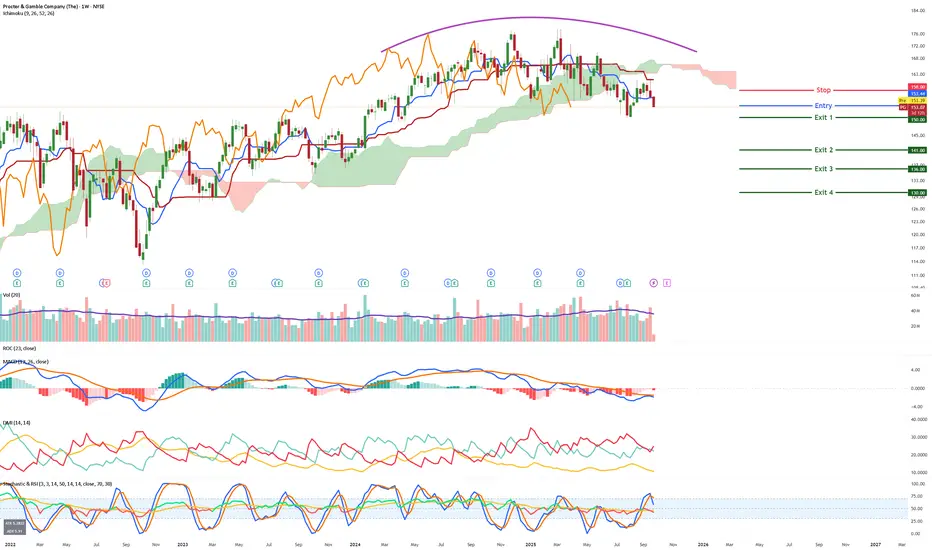
PG - Ride the bears======
Volume
======
- neutral, healthy
==========
Price Action
==========
- Price rejected 158
- Change of trend observed
=========
Oscillators
=========
- all lines below ichimoku cloud, kumo cloud turn bearish
- MACD turning down
- StochRSI, bearish cross and entering band
- DMI Neut
Moving Averages and StochasticOn the Monthly Chart here we see that PG has returned to the 50 EMA and the Stochastic is in the oversold region, hopefully we can get some mean reversion. There is also a pattern forming on the RSI, which breakout could cause some bullish or bearish activity.
Procter & Gamble (PG) | VolanX Risk-Off Outlook📉 Procter & Gamble (PG) | VolanX Risk-Off Outlook
The structure is breaking down. Price action continues to respect the descending trendline, with rejection near 160–161.
🔎 Key Levels:
Gap Fill Target: ~144.3
Secondary Extensions: 134 → 128 (if momentum accelerates)
Risk-off mode activated unti

See all ideas
Summarizing what the indicators are suggesting.
Oscillators
Neutral
SellBuy
Strong sellStrong buy
Strong sellSellNeutralBuyStrong buy
Oscillators
Neutral
SellBuy
Strong sellStrong buy
Strong sellSellNeutralBuyStrong buy
Summary
Neutral
SellBuy
Strong sellStrong buy
Strong sellSellNeutralBuyStrong buy
Summary
Neutral
SellBuy
Strong sellStrong buy
Strong sellSellNeutralBuyStrong buy
Summary
Neutral
SellBuy
Strong sellStrong buy
Strong sellSellNeutralBuyStrong buy
Moving Averages
Neutral
SellBuy
Strong sellStrong buy
Strong sellSellNeutralBuyStrong buy
Moving Averages
Neutral
SellBuy
Strong sellStrong buy
Strong sellSellNeutralBuyStrong buy
Displays a symbol's price movements over previous years to identify recurring trends.
PRGJ
Procter & Gamble Company 3.5% 25-OCT-2047Yield to maturity
5.27%
Maturity date
Oct 25, 2047
PG4969928
Procter & Gamble Company 3.6% 25-MAR-2050Yield to maturity
5.20%
Maturity date
Mar 25, 2050
PG4969927
Procter & Gamble Company 3.55% 25-MAR-2040Yield to maturity
4.86%
Maturity date
Mar 25, 2040
US742718DB2
Procter & Gamble Company 5.8% 15-AUG-2034Yield to maturity
4.78%
Maturity date
Aug 15, 2034
PG.HD
Procter & Gamble Company 5.55% 05-MAR-2037Yield to maturity
4.63%
Maturity date
Mar 5, 2037
PG6217393
Procter & Gamble Company 4.35% 03-NOV-2035Yield to maturity
4.58%
Maturity date
Nov 3, 2035
XS15860308
Procter & Gamble Company 5.25% 19-JAN-2033Yield to maturity
4.58%
Maturity date
Jan 19, 2033
US742718EP0
Procter & Gamble Company 2.7% 02-FEB-2026Yield to maturity
4.57%
Maturity date
Feb 2, 2026
PG6065521
Procter & Gamble Company 4.6% 01-MAY-2035Yield to maturity
4.42%
Maturity date
May 1, 2035
PG5740492
Procter & Gamble Company 4.55% 29-JAN-2034Yield to maturity
4.36%
Maturity date
Jan 29, 2034
PG6217392
Procter & Gamble Company 4.1% 03-NOV-2032Yield to maturity
4.31%
Maturity date
Nov 3, 2032
See all PG bonds


