PG The Procter & Gamble Company Options Ahead of EarningsIf you haven`t bought the dip on PG:
Now analyzing the options chain and the chart patterns of PG The Procter & Gamble Company prior to the earnings report this week,
I would consider purchasing the 152.50usd strike price Calls with
an expiration date of 2025-11-21,
for a premium of approximately $3.55.
If these options prove to be profitable prior to the earnings release, I would sell at least half of them.
Trade ideas

Procter & Gamble Is -10% YTD. Here's Its Chart Ahead of EarningsProcter & Gamble NYSE:PG will report earnings this week at a time when its stock has fallen some 10% year to date and the consumer-goods giant has badly trailed the S&P 500 for both the one- and five-year periods. What does technical and fundamental analysis show us?
Let's see:
Procter & Gamble's Fundamental Analysis
P&G -- which owns Pampers, Gillette, Tide and many other well-known consumer brands -- plans to report Q3 results on Thursday before the bell.
The numbers will come out when the stock has shed 9.6% so far in 2025 as of Wednesday's close, compared to a 14.5% gain for the S&P 500 SP:SPX . P&G has also trailed the key index over a longer period -- for instance, gaining just 5.8% over the past five years vs. a 95.9% increase for the SPX.
The Street is looking for P&G to report $1.90 in Q3 adjusted earning per share on $22.2 billion of revenue. That would represent roughly 2% in year-over-year sales growth, but a 1.6% y/y decline from P&G's $1.93 adjusted EPS from Q3 2024.
Meanwhile, 13 of the 17 sell-side analysts that I can find that cover P&G have lowered their estimates since the quarter began, while four have left their estimates unrevised.
However, not one analyst has revised his or her estimates higher since the period began.
In fact, two analysts highly rated by TipRanks have cut P&G's price target over the past two weeks. Kaumali Garawala of Jefferies (rated at four stars out of a possible five) and Andrea Faria Teixeira of J.P. Morgan (three stars out of five) both reduced the stock's target price while reiterating "Hold" ratings on it.
Procter & Gamble's Technical Analysis
Here's P&G's chart going back 18 months and running through Monday afternoon:
Readers will first notice a large double-top pattern of bearish reversal, marked with a jagged red line and two red boxes at the chart's center above and featuring a $157 pivot. That helped produce P&G's year-to-date sell-off.
This pattern also spawned a smaller double top with a $155 pivot over the summer, marked with jagged red lines and two red boxes at the chart's right.
But despite all of that negativity, P&G's entire sell-off now presents as a falling-wedge pattern of bullish reversal, denoted with two blue diagonal lines and a blue box at the chart's right.
It doesn't look like the falling wedge is nearing a close. But if it did, the pattern's upside pivots would be P&G's 50-day Simple Moving Average (or "SMA," marked with a single squiggly blue line above) and the stock's 20-day SMA (denoted with a red line).
Going forward, P&G's 21-day Exponential Moving Average (or "EMA," marked with a green line) can carry more sway with swing traders and could serve as the key to getting this stock moving towards those upside pivots.
Looking at P&G's secondary technical indicators, the stock's Relative Strength Index (the gray line at the chart's top) is reaching for neutrality after coming out of a nearly oversold condition.
Meanwhile, the stock's daily Moving Average Convergence Divergence indicator (or "MACD," marked with black and gold lines and blue bars at the chart's bottom) had been decisively bearish in posture, but suddenly looks a little bit more bullish.
The histogram of the stock's 9-day EMA has just moved into positive territory after more than a month below the zero-bound. That's typically a short-term bullish sign.
That said, both P&G's 12-day EMA (the black line) and 26-day EMA (the gold line) remain below zero, which is historically bearish. However, the 12-day line has just curled above the 26-day line -- a bullish sign.
All in, these are mixed signals for sure.
A Simple Bull-Call Spread
Options investors who think Intel will react well to this week's earnings might employ a simple bull-call spread.
This strategy consists of a long call and a short call with a higher strike price. Here's an example:
-- Buy one call with an Oct. 24 expiration (which will be after the earnings come out) and a strike price of $152.50 (the stock's 21-day EMA). This will cost about $1.95.
-- Sell one Oct 24 call with a $155 strike (Intel's 50-day SMA) call for about $1.05.
Net Debit: $0.90.
This trade would risk $0.90 to try to gain $1.60 (the difference in the two strike prices less the set-up's net cost). If it works and INTC trades above $155 at expiration, the trader will realize a 178% profit.
But should markets have a negative reaction to earnings and the stock closes below $152.50 this coming Friday, the trader will lose $0.90. That's the maximum theoretical loss on this set-up.
And should the stock look like it will close Friday between $152.50 and $155 and the trader doesn't wany to own Intel, the person could close these options positions before Friday's trading ends.
(Moomoo Technologies Inc. Markets Commentator Stephen "Sarge" Guilfoyle had no position in PG at the time of writing this column.)
This article discusses technical analysis, other approaches, including fundamental analysis, may offer very different views. The examples provided are for illustrative purposes only and are not intended to be reflective of the results you can expect to achieve. Specific security charts used are for illustrative purposes only and are not a recommendation, offer to sell, or a solicitation of an offer to buy any security. Past investment performance does not indicate or guarantee future success. Returns will vary, and all investments carry risks, including loss of principal. This content is also not a research report and is not intended to serve as the basis for any investment decision. The information contained in this article does not purport to be a complete description of the securities, markets, or developments referred to in this material. Moomoo and its affiliates make no representation or warranty as to the article's adequacy, completeness, accuracy or timeliness for any particular purpose of the above content. Furthermore, there is no guarantee that any statements, estimates, price targets, opinions or forecasts provided herein will prove to be correct.
Options trading is risky and not appropriate for everyone. Read the Options Disclosure Document ( j.moomoo.com ) before trading. Options are complex and you may quickly lose the entire investment. Supporting docs for any claims will be furnished upon request.
Options trading subject to eligibility requirements. Strategies available will depend on options level approved.
Maximum potential loss and profit for options are calculated based on the single leg or an entire multi-leg trade remaining intact until expiration with no option contracts being exercised or assigned. These figures do not account for a portion of a multi-leg strategy being changed or removed or the trader assuming a short or long position in the underlying stock at or before expiration. Therefore, it is possible to lose more than the theoretical max loss of a strategy.
The Analyst Ratings feature comes from TipRanks, an independent third party. The accuracy, completeness, or reliability cannot be guaranteed and should not be relied upon as a primary basis for any investment decision. The target prices are intended for informational purposes only, not recommendations, and are also not guarantees of future results.
Moomoo is a financial information and trading app offered by Moomoo Technologies Inc. In the U.S., investment products and services on Moomoo are offered by Moomoo Financial Inc., Member FINRA/SIPC.
TradingView is an independent third party not affiliated with Moomoo Financial Inc., Moomoo Technologies Inc., or its affiliates. Moomoo Financial Inc. and its affiliates do not endorse, represent or warrant the completeness and accuracy of the data and information available on the TradingView platform and are not responsible for any services provided by the third-party platform.

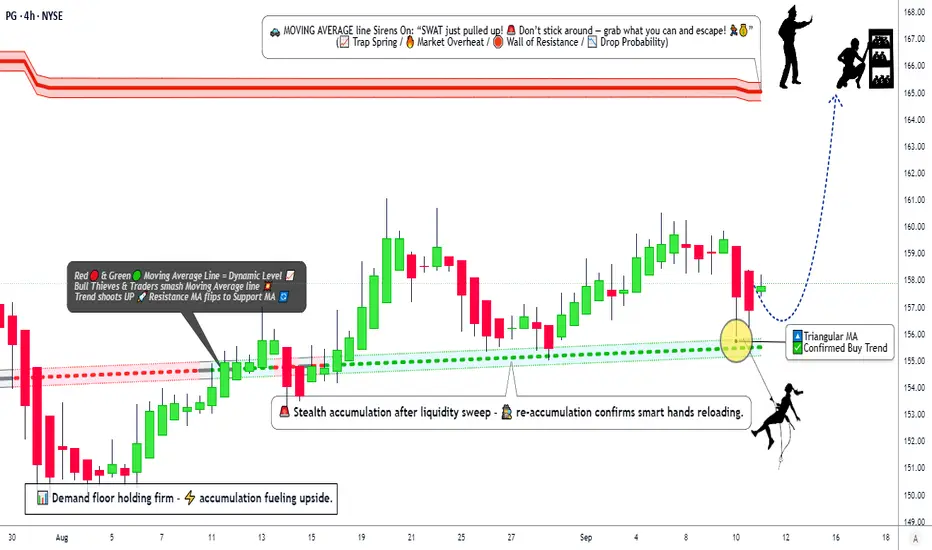
Is Procter & Gamble Setting Up for a Strong Bullish Reversal?🚨 P&G Bullish Master Plan: Steal Profits with the Thief Strategy! 🤑
📊 Asset: Procter & Gamble (PG) – Swing/Day Trade Setup📈 Date: September 11, 2025🎯 Plan: Bullish Triangular Moving Average Pullback – Confirm the Buy Trend!
🕵️♂️ Why the Thief Strategy for PG?
The Thief Strategy is a clever, layered limit-order approach designed to capitalize on PG’s bullish momentum while navigating market traps. Backed by technical signals, solid fundamentals, and a cautious market sentiment, this plan aims to sneak in profits before the “police barricade” (resistance) stops the rally.
Here’s why PG is ripe for a steal:
Technical Edge 🧠: PG’s price action shows a bullish pullback within a triangular moving average setup, signaling a continuation of the buy trend.
Fundamental Strength 💪: PG’s robust balance sheet and consistent dividends make it a defensive powerhouse, even in uncertain markets.
Market Sentiment 😊: Retail traders are bullish, while institutions remain cautious, creating a contrarian opportunity for savvy thieves.
Fear & Greed Index 😨: At 39 (Fear), the market’s caution suggests undervaluation, a prime setup for a bullish swing.
📈 PG Stock Snapshot – September 11, 2025
💰 Price Overview
Daily Range: $157.05 - $158.18
Previous Close: $157.35
Market Cap: $372.16B
Yearly Range: $149.91 - $180.43
😊 Investor Sentiment
Retail Traders: 51.6% Bullish 🟢 (Positive buying momentum)
Institutional Traders: 49.3% Bearish 🔴 (Cautious, mixed outflows)
Overall Mood: Neutral, leaning slightly bearish due to institutional caution
😨 Fear & Greed Index
Current Level: 39 (Fear) 😟
Insight: Indicates cautious market sentiment, with fear slightly dominating greed, suggesting potential undervaluation for contrarian traders.
📈 Fundamental Score: 7.6/10 ✅
Strengths: Strong liquidity, operational efficiency, and reliable dividends.
Concerns: Inventory turnover (60.62 days), negative cash flow growth (-8.77% YoY).
🌍 Macro Score: 6.8/10 ⚖️
Tailwinds: Stable consumer goods demand supports growth.
Headwinds: Tariff policies and geopolitical tensions may pressure global sales. Fed’s steady rates (4.25%-4.50%) could squeeze margins.
🐂🐻 Market Outlook: Neutral (Hold) ⚖️
Bull Case: Strong fundamentals, retail buying, and dividend reliability support long-term stability 🟢.
Bear Case: Institutional outflows and macro uncertainties suggest short-term caution 🔴.
🎯 Key Takeaway: PG is a solid long-term investment with strong fundamentals, but short-term caution is advised due to mixed sentiment and macro risks. Monitor upcoming earnings and tariff developments. 🚨
🕵️♂️ Thief Strategy: Bullish Plan for PG
Plan Overview: Use a layered limit-order strategy to “steal” profits on PG’s bullish pullback within a triangular moving average setup. This approach maximizes entries while managing risk in a volatile market.
📥 Entry:
Layered Limit Orders: Place multiple buy limit orders at $156.00, $157.00, $158.00, and $159.00 to capitalize on pullbacks.
Flexibility: Adjust layers based on your risk tolerance and market conditions. Choose any price level within the $156–$159 accumulation zone for entry.
Why? The triangular moving average pullback confirms bullish momentum, with support at $156–$159 aligning with Fibonacci clusters and institutional buying zones.
🛑 Stop Loss:
Thief SL: Set at $154.00 to protect against a breakdown below key support.
Note: Adjust your stop loss based on your risk tolerance and strategy. The $154 level is a suggestion, not a mandate—manage your risk wisely, Thief OGs!
🎯 Target:
Primary Target: $165.00 (strong resistance zone).
Why? $165 aligns with the first resistance level and overbought conditions, where a “trap police barricade” may halt the rally. Take profits early to escape with your stolen gains!
Note: Set your own take-profit levels based on your strategy. Don’t blindly follow the $165 target—secure profits at your discretion.
⚠️ Risk Management:
Use tight risk management with layered entries to average into positions.
Consider partial profit-taking at $160 and $165, holding runners for $172 if momentum sustains.
Monitor macro developments (e.g., tariffs, Fed policy) for potential volatility.
🔍 Technical Breakdown: Why Bullish?
Triangular Moving Average: PG’s price is respecting a bullish TMA structure, with a recent pullback confirming support at $156–$159.
Fibonacci Alignment: The $156–$159 zone aligns with a key Fibonacci cluster, reinforcing the buy zone.
Momentum Indicators: Stochastic RSI is in the bullish zone, and Rate of Change (ROC) shows increasing buying interest.
Institutional Confluence: Institutional models signal a buy with a $159.98 target, supported by technical exhaustion of the recent correction.
🧠 Why This Plan Works?
Technical Precision 🎯: The TMA pullback and Fibonacci confluence provide a high-probability setup for a bullish swing.
Sentiment Edge 😊: Retail bullishness (51.6%) contrasts with institutional caution (49.3% bearish), creating a contrarian opportunity for short-term gains.
Fundamental Backbone 💪: PG’s 7.6/10 fundamental score highlights its resilience as a consumer staple, ideal for defensive plays.
Macro Awareness 🌍: Despite tariff risks, stable consumer demand supports PG’s long-term stability, making it a safe bet for swing/day trades.
Fear & Greed Advantage 😨: A Fear reading of 39 suggests undervaluation, aligning with Warren Buffett’s “be greedy when others are fearful” philosophy.
💸 Related Pairs to Watch ( AMEX:USD )
Monitor these pairs for correlated market moves:
AMEX:XLP (Consumer Staples Select Sector SPDR Fund): Tracks consumer staples like PG. Bullish XLP supports PG’s upside.
NYSE:KO (Coca-Cola): Another defensive staple with similar market dynamics.
NYSE:WMT (Walmart): Retail giant tied to consumer goods demand.
AMEX:GLD (Gold): Safe-haven asset for macro risk hedging.
✨ “If you find value in my analysis, a 👍 and 🚀 boost is much appreciated — it helps me share more setups with the community!”
#TradingView #PG #Bullish #ThiefStrategy #SwingTrading #DayTrading #TechnicalAnalysis #FearAndGreed #ConsumerStaples #StockMarket
⚠️ Disclaimer
This analysis is for educational purposes only and does not constitute financial advice. Trading involves risk, and past performance does not guarantee future results. Always conduct your own research and manage risk according to your financial circumstances.
$PG sitting at demand — 149.98 is the line in the sand. Bounce 🧭 PG – Trade Idea (Daily Chart)
Bias:Bearish-to-neutral short-term | Potential swing buy near demand
🔹 Key Levels
Resistance Zones:
179.99 → Major structural high (long-term supply)
171.05 → Intermediate resistance (Fib 50% region)
165.53 → Previous breakdown retest
Support Zones:
156.59 → Current structure retest zone (prior support-turned-resistance)
149.98 → Key demand zone / possible bullish response area
145.00 → Lower demand extension
---
🔹 Trade Setup
Scenario 1 – Long from Demand (Countertrend Bounce)
Entry: 149.98 – 150.50 (demand zone)
Stop: Below 147.50
Targets:
TP1: 156.50 (prior support retest)
TP2: 165.50 (Fib retracement + supply confluence)
R:R: ≈ 1:3
🔹 Momentum Check
Stochastics: Oversold → potential short-term bounce, but trend remains weak.
Structure: Price failed to hold above 156.59; repeated lower highs confirm distribution phase.
🔹 Holistic Note
> “The market pays those who wait. Let price come to you buy wholesale near demand, sell retail into supply.”

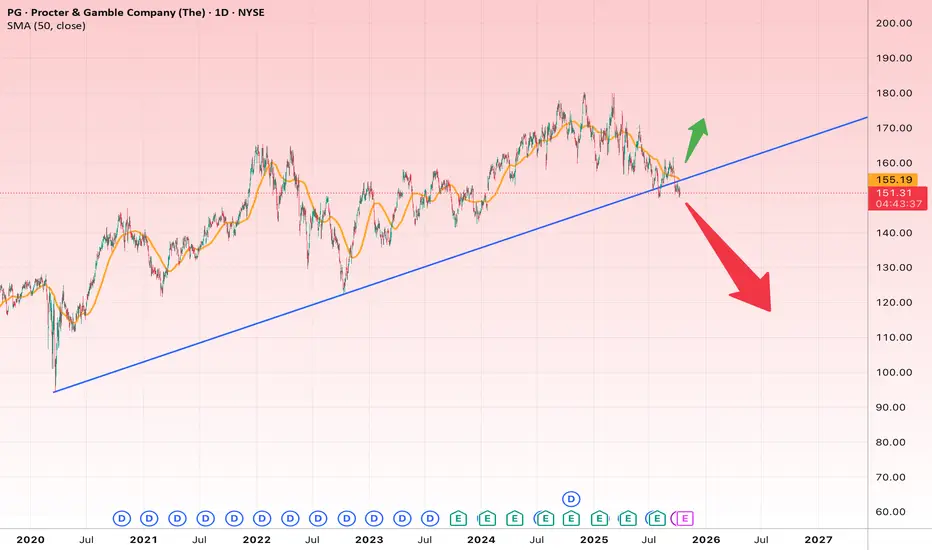
PG at the Edge: Break or Bounce?
🔹 Long-Term Overview
Since 2020, PG has been in a steady long-term uptrend, well supported by the rising blue trendline on the chart.
This trendline has acted as strong support multiple times in recent years — and once again, the price is testing it near the $150 zone.
This area is a make-or-break level for PG. Holding above it could trigger a new rally; breaking below could lead to a deeper correction.
⏳ Short-Term Outlook (1–3 months)
PG is currently trading below its 50-day moving average, showing short-term weakness.
However, it’s sitting right on the major trendline — meaning buyers may step in if this support holds.
Watch for a daily close to confirm direction:
A close above $155 would confirm a rebound toward $165–$170.
A close below $148 would signal a confirmed breakdown.
🎯 Short-Term Targets:
Bullish: $165 → $170
Bearish: $140 → $132
🛑 Stop-Loss:
For longs: below $148
For shorts: above $156
📈 Long-Term Outlook (6–12 months)
Two major scenarios are forming:
Scenario 1 – Trend Holds (Bullish)
If PG defends its long-term trendline, the broader uptrend remains intact.
This setup may evolve into a double-bottom formation, targeting new highs.
🎯 Long-Term Upside Targets:
First: $175
Second: $190
🛑 Stop-Loss: below $145
Scenario 2 – Trendline Break (Bearish)
If the weekly candle closes below $145, the four-year uptrend will be broken.
In that case, PG could retrace toward $130 or even $115–$110 in an extended correction.
🎯 Long-Term Downside Targets:
First: $130
Second: $115
🛑 Stop-Loss: above $155
PG LongLong entry 152
Stop 148 -- if buy stock directly
Target 160, 180
Risk management is much more important than a good entry point.
I am not a PRO trader.
In my trading plan, the Max Risk of each short term trade should be less than 1% of an account.

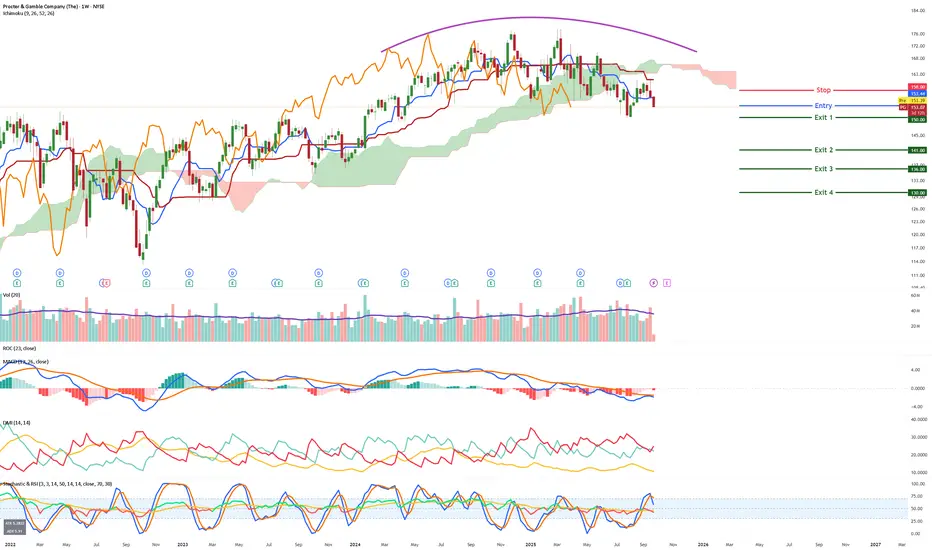
PG - Ride the bears======
Volume
======
- neutral, healthy
==========
Price Action
==========
- Price rejected 158
- Change of trend observed
=========
Oscillators
=========
- all lines below ichimoku cloud, kumo cloud turn bearish
- MACD turning down
- StochRSI, bearish cross and entering band
- DMI Neutral
=========
Conclusion
=========
- Short to mid term setup
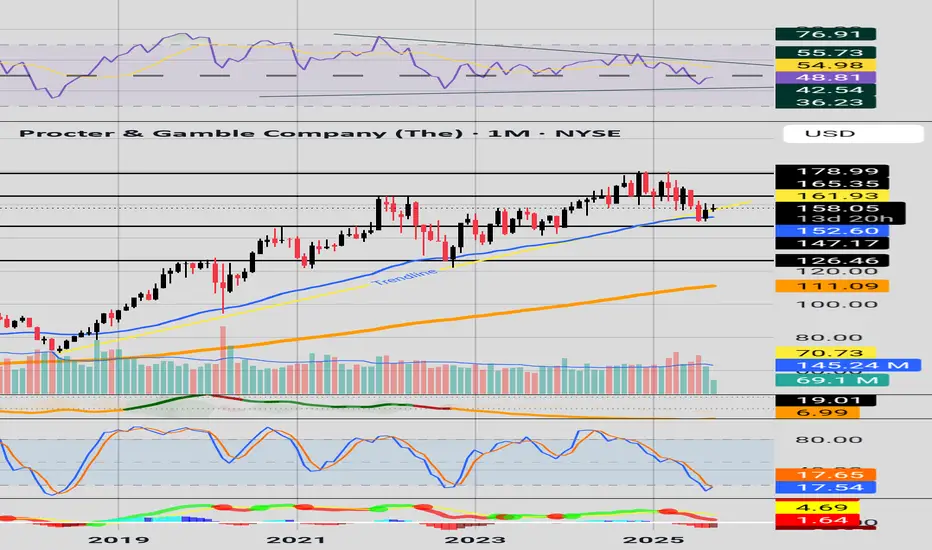
Moving Averages and StochasticOn the Monthly Chart here we see that PG has returned to the 50 EMA and the Stochastic is in the oversold region, hopefully we can get some mean reversion. There is also a pattern forming on the RSI, which breakout could cause some bullish or bearish activity.
Procter & Gamble (PG) | VolanX Risk-Off Outlook📉 Procter & Gamble (PG) | VolanX Risk-Off Outlook
The structure is breaking down. Price action continues to respect the descending trendline, with rejection near 160–161.
🔎 Key Levels:
Gap Fill Target: ~144.3
Secondary Extensions: 134 → 128 (if momentum accelerates)
Risk-off mode activated until we see stabilization.
⚠️ Bias: Downside pressure dominates — if sellers stay in control, this train heads south into the gap zone.
🧠 At WaverVanir, VolanX Protocol highlights how structural breaks, liquidity gaps, and momentum alignment guide our institutional-grade positioning.
#WaverVanir #VolanXProtocol #MarketIntelligence #PG #RiskManagement

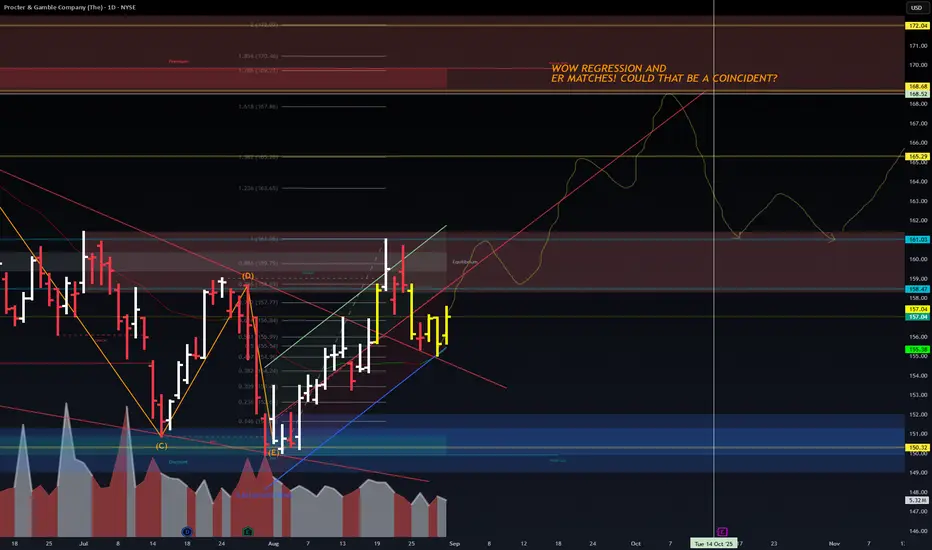
PG: Final Strategy, Bought CALLS!🔎 Chart Observations
Price: $157.04 (-1.19% on the day).
Fib Levels:
Key resistance zones at 159.77 (Fib 0.886) and 163.65–167.86 (Fib extensions).
Strong support zones at 155.35 (local low) and 150.20 (weekly low).
Trend: Consolidating after a sharp rebound (yellow candles indicate indecision/possible continuation setup).
Volume: Elevated compared to July, suggesting institutional positioning.
Regression Channel + Earnings (ER): Your annotation points out alignment around $165–168 into earnings, suggesting bullish bias.
📈 Options Play Idea (Bullish Tilt)
Primary Play: Bull Call Spread (moderate bullish)
Buy: $160 Oct 18 Call
Sell: $165 Oct 18 Call
Rationale: Cheapens cost, targets regression + ER move, defined risk.
Max Profit: Captured if PG closes ≥ $165 at expiration.
Alternative Play: Call Debit Spread + Earnings Lottery
Buy: $160 Call (Oct 18 or Nov 15 expiry)
Sell: $170 Call (same expiry)
Thesis: Stock pushes into $165–$170 zone on ER momentum.
Hedge / Neutral Play: Iron Condor (if expecting chop until ER)
Sell: $165 Call + Buy $170 Call
Sell: $150 Put + Buy $145 Put
Rationale: Play the range if PG stalls under $165 but holds above $150.
🧮 Probabilistic Outlook (next 6–8 weeks)
Bullish Continuation (55%): Grind higher into $165–168.
Range-bound (30%): Bounce between $155–161 until earnings clarity.
Bearish Pullback (15%): Drop to retest $150 demand zone.
👉 Best risk/reward: The $160/$165 Bull Call Spread (Oct 18) — aligned with your regression + ER zone.
Procter & Gamble (PG) – Technical Roadmap🚀 Procter & Gamble (PG) – Technical Roadmap
PG has completed a corrective wedge (ABCDE) on the daily chart and is now setting up for a strong breakout.
🔎 Key Technicals
Pattern: Falling wedge breakout + Elliott corrective wave completion
Supports: $156–159 (accumulation zone) | $150.32 (macro invalidation)
Immediate Levels:
$161.03 → short-term pivot
$165.29 → first resistance
$168.68 → breakout confirmation
$172.04 → critical Fibonacci extension
📊 Macro Roadmap
Near-term rally toward $165 → $172
If $172 breaks, upside expands into $190–192 zone
Long-term ceiling sits at $200–202 aligned with Fib 4.618 and trendline resistance
🎯 Trade Plan
Bullish bias while above $156
Targets: $165 → $172 → $190 → $200
Stop-Loss: below $150.32
📈 Probabilistic View
Bullish continuation: ~70%
Bearish retest of $150: ~30%
💡 Consumer staples resilience + technical exhaustion of correction points toward higher highs. Watching for confirmation at $165–172 before scaling in for the macro move.

Technical Analysis: $PG 🔎 Technical Analysis
Falling Wedge Breakout:
The chart shows a descending wedge (red lines), recently broken to the upside — a bullish reversal pattern.
Key Fibonacci Levels:
Support zone: 159.87 – 161.03 (blue lines).
Next resistance targets:
165.29 (Fib 1.0 extension)
168.68 (Fib 1.618 extension)
172.04 (Fib 2.0 extension)
Bullish Wave Projection (yellow path):
Suggests short-term consolidation near 161 → breakout attempts toward 165 → retrace → continuation to 172.
🎯 Trade Levels
Entry Zone (long bias): Around 159–161 (confirmation bounce).
Upside Targets:
TP1 = 165.29
TP2 = 168.68
TP3 = 172.04
Stop-Loss (risk management): Below 157.00 (invalidates wedge breakout).
📈 Probabilistic View
Bullish probability: ~65% (pattern breakout + Fibonacci confluence).
Bearish probability: ~35% (failure to hold above 159 support could retest wedge lows near 152).

PG (Procter & Gamble) – Technical & Institutional Confluence📊 PG (Procter & Gamble) – Technical & Institutional Confluence
PG is showing strong confluence between Smart Money Concepts and institutional forecasts:
🔹 Entry Zone: $154–$156 (MA bounce + Fib cluster)
🔹 Stop Loss: $151 (2.8% risk)
🔹 Targets:
$160 → First profit zone (institutional model target + equilibrium supply)
$165 → Extended technical target
$172+ → Premium liquidity sweep if momentum sustains
📈 Institutional Forecast Model
Signal: BUY
Target: $159.98 (+2.8%)
Confidence Interval: $161–163
Agreement: 9 of 9 bullish
🔑 Key Confluence:
Technicals show FVG recovery & Fib alignment
Institutional model confirms upside bias
Risk/reward balanced near 1:1 with tight stop
⚠️ Risk Management:
Partial profit at $160, scale out near $165, hold runners for $172 if macro momentum aligns.

PG Bullish Swing Setup | Breakout Brewing Above $161!🚀 PG Swing Setup: Bullish Breakout Loading? 🔥 (2025-08-21)
📊 Multi-Model Consensus Summary
📈 Momentum: Mixed — RSI fading, but 5-day & 10-day trends show bullish push
💵 Volume: Weak (1.0x avg) → no strong institutional conviction yet
⚖️ Options Flow: Neutral (C/P = 1.0)
🌪 Volatility: VIX 16.60 (favorable low-volatility regime)
📉 Risk: Insider selling + momentum exhaustion risk
✅ Overall Market Bias: Moderate Bullish, but needs volume confirmation for breakout.
🎯 TRADE PLAN
🏦 Instrument: NYSE:PG
📈 Direction: CALL (LONG)
🎯 Strike: 162.50
💵 Entry Price: 0.81
🛑 Stop Loss: 0.57 (-30%)
🎯 Profit Target: 1.20
📅 Expiry: 2025-09-05
⏰ Entry Timing: Market open above $161.03 resistance
📏 Size: 1 contract
🔒 Confidence: 65%
⚠️ Key Risks
🚨 Weak volume could kill breakout momentum
📉 Insider selling pressure
📰 Macro/news shocks

PG (Procter & Gamble): A Textbook Rebound Setup📈 PG (Procter & Gamble): A Textbook Rebound Setup
Summary :
Procter & Gamble just bounced right at a key support zone. The setup offers a low-risk entry with a tight stop and solid upside potential.
Idea :
This is one of those charts that look like they came straight out of a technical analysis textbook. After months of sideways consolidation, PG tested a major support zone around $150–155 and bounced strongly.
Why does it matter? Because this level has acted as a floor multiple times, and now we see confirmation with price respecting it again. That makes it a great buy zone.
📌 Technical view:
• Entry zone: $155–160 (current levels)
• Stop loss: below $150 (tight risk)
• First target: $180 (previous highs, realistic)
• Extended target: $190 (resistance above, long-term breakout potential)
👉 That means we’re looking at roughly:
• Risk: ~$8 per share (from $158 to $150)
• Reward (target 1): ~$22 (from $158 to $180)
• Reward (target 2): ~$32 (from $158 to $190)
✅ Risk/Reward ratio:
• Target 1 → ~1:2.7
• Target 2 → ~1:4
That’s exactly the kind of asymmetry we want in trading: small controlled downside, with a much larger upside if the breakout comes.
Why PG?
Beyond the chart, PG is one of the most defensive consumer staples out there. In times of uncertainty, investors tend to flock to companies with strong cash flows, dividends, and stable demand. That defensive nature supports the technical rebound we’re seeing, buyers are stepping in where it makes sense.
Conclusion :
PG is giving us a clean technical setup: support rebound, tight stop, and clear upside targets. For swing traders, this is the type of chart where you risk little but potentially gain a lot.

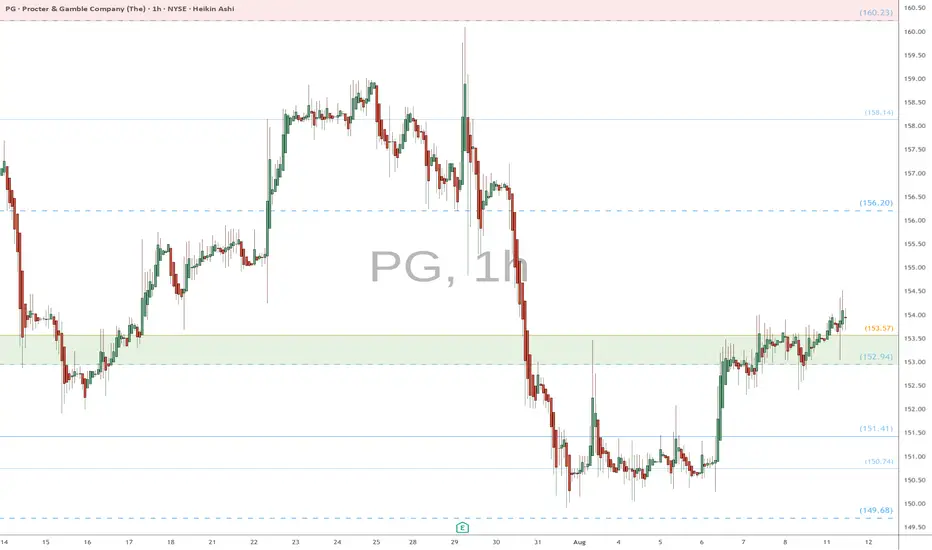
PG watch $152.94-153.57: well proven support Zone needs to hold PG trying to paint a local bottom after earnings dump.
Seems ready to break out of a fib zone at $152.94-153.57
Entering small long now, will add upon retest break higher.
PG Approaching Oversold Discount Zone Ahead of Q4 Earnings BTFD?📝 Procter & Gamble (NYSE: PG) is trading at $153.73 (-10.8% YTD), lagging the S&P 500’s +6.5% YTD gain. Despite recent weakness, a confluence of technical support, dividend resilience, and a looming catalyst could signal a tactical entry. Let’s break it down:
🔍 Fundamentals & Catalysts
Q4 Earnings Webcast (July 29):
P&G will webcast Q4 results at 8:30 AM ET, with focus on organic sales growth (guided at +2% FY25) and margin trajectory 14.
EPS Expectations: Q4 consensus at $1.43 (+2.1% YoY); FY25 core EPS guided at $6.72–6.82 (2–4% growth) 410.
Dividend Fortress:
Quarterly payout raised to $1.0568/share (ex-div: July 18), marking 69 consecutive years of increases and a 2.75% yield 612.
Payout ratio at 67% of earnings – sustainable for a consumer staple 6.
Cost Pressures & Mitigation:
Tariff Headwinds: $1B–$1.5B annual cost hit from U.S.-China tariffs 410.
Offsets: $2.4B dividend payouts + $1.4B buybacks in Q3; 280bps gross productivity savings 10.
🌍 Macro & Risk Factors
Consumer Softness: Q3 net sales fell -2% YoY; volume declines in Baby Care (-2%) and Fabric & Home Care (-1%) segments 10.
Pricing Power: Average +1% pricing in Q3 (led by Grooming/Health Care), though mix/elasticity risks persist 104.
Structural Shifts: Portfolio pruning (minor brand exits) and job cuts to offset tariff impacts 4.
📉 Technical Setup: Oversold with Base-Building Potential
RSI 31.5 (Neutral but nearing oversold) 511.
Price vs. MAs: Below all key MAs (20-day: $159.17, 50-day: $161.59, 200-day: $165.56) – signaling bearish momentum but extreme discounts 5811.
Support Zone: $152–153 aligns with 52-week lows ($151.90) and the 2025 dividend-capture floor 212.
MACD -1.57: Suggests potential reversal if momentum shifts 5.
Technical Indicators Summary:
Indicator Value Signal
RSI (14) 31.45 Neutral
MACD (12,26) -1.57 Buy
Price vs. 200D SMA -7.1% Sell
Bollinger Bands (25) $157–161.94 Sell
🎯 Probabilistic Price Targets
Scenario Target Probability Rationale
Bounce to 20D MA $158–160 60% Mean reversion + dividend ex-date support
Reversion to 50D MA $162–164 45% Technical confluence + tariff resolution hopes
Rally to 200D MA + ATH $174 25% Bull case: Macro stabilization + guidance upgrade
📌 Trade Strategy
Entry: $152–154 (aligns with structural support) 28.
Stop Loss: $149.50 (1–2% below July 16 low of $152.27) 2.
Targets: Scale out at $160 → $164 → $174.
Catalysts: Q4 earnings (July 29) + clarity on tariff mitigation 14.
Position Size: Allocate 3–5% of portfolio; pair with long-volatility hedge.
⚠️ Key Risks
Guidance Miss: Sluggish volumes or tariff escalation could pressure FY26 EPS projections.
Technical Breakdown: Close below $151.90 invalidates support, inviting a slide to $145.
Macro Sensitivity: Consumer staples underperformance if inflation rebounds.
💎 Final Take
PG offers a rare combo: defensive yield (2.75%) + oversold technicals + imminent catalyst. While tariffs and consumer weakness justify caution, the $152–154 zone is a high-probability dip-buying opportunity. Earnings day vol could amplify moves – enter pre-event with tight stops.
#PG #ConsumerStaples #DividendKing #EarningsPlay #Tariffs
Disclaimer: This is not financial advice. Conduct your own due diligence.

$PG - Charting is Therapeutic NYSE:PG forming solid base at $159 support after 15% pullback from Feb highs.
Strong fundamentals intact with 19% profit margins in Q3. Recent analyst actions positive RBC upgraded to BUY in April, Evercore just raised PT to $190 (19% upside).
Defensive consumer staple with reliable dividend (65% payout ratio). Patient investors rewarded here. #ValueInvestment #Dividends

Bullish $PGNYSE:PG forming solid base at $159 support after 15% pullback from Feb highs. Strong fundamentals intact with 19% profit margins in Q3. Recent analyst actions positive - RBC upgraded to BUY in April, Evercore just raised PT to $190 (19% upside). Defensive consumer staple with reliable dividend (65% payout ratio). Patient investors rewarded here. #ValueInvestment #Dividends

Can P&G Weather the Economic Storm?Procter & Gamble, a global leader in consumer goods, currently faces significant economic turbulence, exemplified by recent job cuts and a decline in its stock value. The primary catalyst for these challenges stems from the Trump administration's tariff policies, which have directly impacted P&G's supply chain by increasing costs for raw materials and finished goods imported from China. This financial burden, estimated to be hundreds of millions of dollars, compels P&G to reassess sourcing strategies, enhance productivity, and potentially raise product prices, risking a reduction in consumer demand.
In response to these escalating pressures and a noticeable slowdown in category growth rates within the U.S., P&G has initiated a substantial restructuring program. This includes the elimination of up to 7,000 jobs, representing approximately 15% of its non-manufacturing workforce, over the next two years. The company also plans to discontinue sales of certain products in specific markets as part of its broader strategic adjustments. These decisive measures aim to safeguard P&G's long-term financial algorithm, although executives acknowledge they do not alleviate immediate operational hurdles.
Beyond the direct impact of tariffs, a pervasive sense of economic uncertainty and declining consumer confidence in the U.S. further complicates P&G's operating environment. Recent data indicates a sustained drop in consumer sentiment, directly influencing discretionary spending and prompting households to become more cautious with their purchases. This shift, combined with broader negative economic indicators such as rising jobless claims and increased layoffs across various sectors, creates a challenging landscape for companies reliant on robust consumer spending. P&G's immediate future hinges on its strategic agility in mitigating tariff impacts, managing pricing, and adapting to a volatile economic climate.

Procter&Gamble: Short-Term Strength Still Fits the PlanPG has extended its rally, pushing turquoise wave C higher. While some selling pressure is starting to show, we’re sticking with our primary view: the stock should still break above $180.43 to complete beige wave b before turning lower. However, in our 37% likely alternative scenario, beige wave alt.b would have already topped, and the stock would next drop below $148.87.
📈 Over 190 precise analyses, clear entry points, and defined Target Zones - that's what we do.

PG eyes on $165-166: proven Major Resistance to Pump or DumpPG trying to recover from the tariff bottom.
Currently testing a major Resistance zone.
Look for Dip to Green zone or Break-n-Retest.

Go DefensiveUncertain and relatively bearish market at the moment, I expect "boring" defensive stocks such as PG to be the safety play for most investors.
I think this will bounce to $180.
Not financial advice, good luck to all :)
