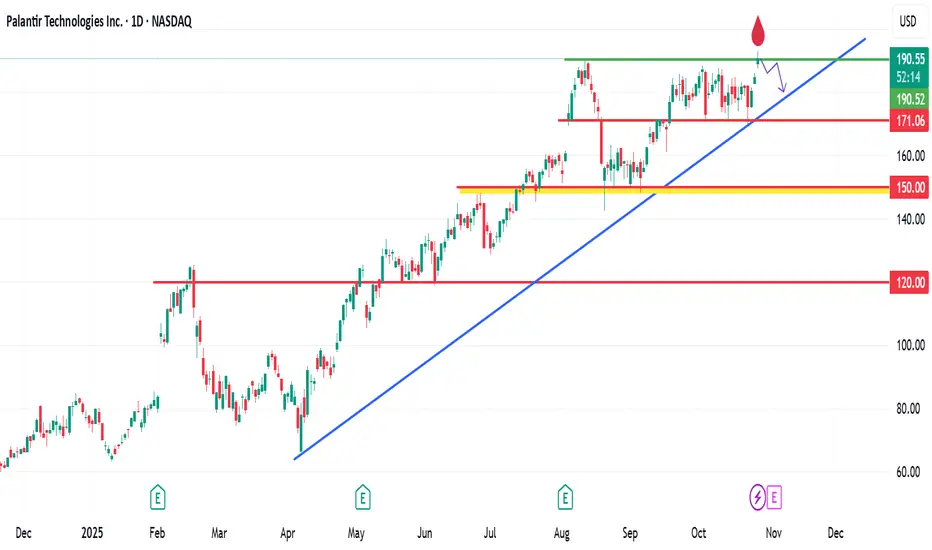
Palantir (PLTR) hit a new All Time HighPalantir (PLTR) ht a new All-Time-High (ATH) at $192.83 today.
Many of my friends said, ''Rawlings, why did you sell off at ATH?''
As an investor who knows how to be content, I learned my lessons along the way.
I bought my last PLTR holdings at the rate of $158.98 and sold at $191.89.
I made $32.91 for every $158.98 that I invested = over 20% ROI.
As a technical Analyst, I see a possibility of this stock pulling back a bit if the rally continues.
My target re-entry will be $180 zone and a retest of the ascending trendline on my chart.
Trade with care.
Also remember that knowing how to TP is a skill
Trade ideas
$PLTR New ATH coming in After building support for a couple months. PLTR builds a triangle and pops out on Friday. Weekly tail candle shows confidence for a continuation upward.

Palantir - Knocking on heavens doorMultiple touches to the upside in the 185 - 190 USD range while ranging in an overall aggressive uptrend, paired with super-tight Bollinger bands on the daily are a telltale sign for me, that a breakout to the upside is coming.

$PLTR Basing Analysis: 3-Month Technical OutlookFor the past twelve weeks, NASDAQ:PLTR has been consolidating near its all-time high (ATH). This prolonged basing period has resulted in the formation of a distinctive wedging pattern, commonly known as a Volatility Contraction Pattern (VCP). This pattern, popularized by Mark Minervini, is characterized by decreasing price swings and tightening ranges.
Technical Pattern and Implications
The VCP that has emerged on NASDAQ:PLTR 's chart typically signals a potential continuation in the direction of the prevailing trend. In this instance, the trend leading into the pattern has been upward, suggesting that a breakout to the upside could be the most likely scenario.
Trading Plan
To prepare for a possible breakout, an alert has been set just below the horizontal resistance area. If this alert is triggered, the plan is to initiate a new position in anticipation of further upward movement. While price targets are not usually set, in this case, an estimated gain of approximately 18% is anticipated following a breakout. This projection is based on the depth of the pullback from the ATH.
Risk Management and Disclaimer
Readers are strongly encouraged to conduct their own analysis and to adhere to their personal trading rules. Investing in the stock market always carries risk, and it is essential to make informed decisions with your own capital.

PALANTIR sitting on a Buy Zone. Target $220.Palantir (PLTR) has been trading within a Channel Up since early May and is currently consolidating on its bottom (Higher Lows trend-line). while holding he 1D MA50 (red trend-line). The 4H MA50 (blue trend-line) - 1D MA50 range has been technically the most optimal buy zone of this pattern.
With the 4H RSI exhibiting a Bull Flag similar to May - June, we expect the stock to aim for at least its 2.618 Fibonacci extension at $220.00. If broken, it may extend for an end-of-year rally to $255.00 completing a +80% Bullish Leg similar to the Channel's first.
-------------------------------------------------------------------------------
** Please LIKE 👍, FOLLOW ✅, SHARE 🙌 and COMMENT ✍ if you enjoy this idea! Also share your ideas and charts in the comments section below! This is best way to keep it relevant, support us, keep the content here free and allow the idea to reach as many people as possible. **
-------------------------------------------------------------------------------
💸💸💸💸💸💸
👇 👇 👇 👇 👇 👇

PLTR Gearing Up for a Friday Move: (Oct. 24 Outlook)Will $182 Trigger a Breakout or a Trap? 🚀
1. Market Structure (1H & 15M)
Palantir (PLTR) is showing a bullish short-term recovery after reclaiming structure from the $169 demand zone, where a strong CHoCH (Change of Character) flipped the prior bearish momentum. The Break of Structure (BOS) around $175 confirmed buyer aggression, and price has since climbed toward the key $180–$182 resistance range.
On the 1-hour chart, PLTR is now testing that upper liquidity pocket — precisely where a previous CHoCH reversal began last week. Smart money likely used the drop under $170 to accumulate positions, and now we’re seeing that energy unwind into overhead liquidity between $180–$183.
On the 15-minute timeframe,
a short-term rising wedge pattern has formed. The intraday CHoCH near $180.3 shows early signs of possible exhaustion, but until structure breaks below $178, the short-term bias remains bullish.
2. Supply and Demand / Order Blocks
* Demand Zone: $175–$177 (former resistance turned support; confirmed with high-volume absorption)
* Immediate Support (FVG Zone): $178–$179 — this area aligns with the 15-min fair value gap and could act as an intraday springboard for continuation.
* Supply Zone: $182–$184 — heavy liquidity cluster visible from prior distribution phase, aligning with multiple order blocks and GEX resistance.
If PLTR breaks and closes above $182.5 with strength, it could trigger a short-covering rally toward $185+. But a failed breakout could produce a sharp retrace back to $176 as trapped longs exit.
3. Indicator Confluence
* 9 EMA / 21 EMA: The 9EMA has crossed above the 21EMA on both 15M and 1H — a solid confirmation of bullish control as long as price stays above $179. The slope is positive, suggesting trend continuation.
* MACD: On the 1-hour, the histogram is strongly green with widening bars — showing bullish momentum regaining steam. On the 15-minute, momentum cooled slightly in the late session, suggesting consolidation before the next leg.
* RSI: The hourly RSI sits around 70, indicating strong but not extreme momentum. On the 15M, RSI cooled back toward 60 after a near-overbought condition, giving bulls room to push again if demand returns.
* Volume: Noticeable pickup on the breakout from $175, confirming participation and likely short covering.
4. GEX (Gamma Exposure) & Options Sentiment
Friday’s GEX map shows $185 as the highest positive gamma and call wall, creating a natural magnet if momentum continues. The HVL (High Volume Level) at $175 coincides with the main structural support and previous BOS zone — an important line for bulls to defend.
Below $175, the PUT wall at $170 marks a critical downside risk zone where dealers may need to sell into weakness. Above, the $180–$182 region carries stacked call walls — the zone where gamma flips could fuel acceleration or rejection.
IVR sits at 30.9, with moderate call bias (36.6%) and a GEX-positive environment, meaning the market is likely to lean toward volatility suppression until a breakout occurs. If PLTR clears $182 with volume, expect a gamma squeeze into $185–$187, while failure there could trap momentum longs and send price right back to $175.
5. Trade Scenarios for Friday, Oct. 24
Bullish Setup 🟩
* Entry Zone: $178–$179 retest or confirmed breakout above $182.3
* Targets: $183.5 → $185 → $187
* Stop-Loss: Below $177
* Confirmation: Price holds above 9EMA on 15M, MACD histogram stays positive, RSI > 55
Bearish Setup 🟥
* Entry Zone: $182–$183 rejection zone
* Targets: $179 → $176 → $172
* Stop-Loss: Above $184.5
* Confirmation: 15M CHoCH + MACD histogram flips red with RSI divergence
6. Closing Outlook for Oct. 24 (Friday)
Friday’s setup looks balanced but leaning bullish as long as $179–$180 holds intraday. A quick liquidity grab under that level early morning could give bulls a clean launch toward $185+. Conversely, if $182 rejects again with heavy volume, expect a pullback toward $175 — where both structure and gamma support align.
My personal take: PLTR looks coiled for a breakout, but the move needs confirmation above $182. A low-volume fakeout would likely fade, while a strong breakout could trigger dealer hedging and send this name flying into the upper $180s.
🔥 Final Thought:
“PLTR is sitting right under the ceiling — $182 is the key. If bulls break through, $185–$187 comes fast. But if it fails again, $175 will be back on the radar.”
This analysis is for educational purposes only and not financial advice. Always do your own research and manage your risk before trading.
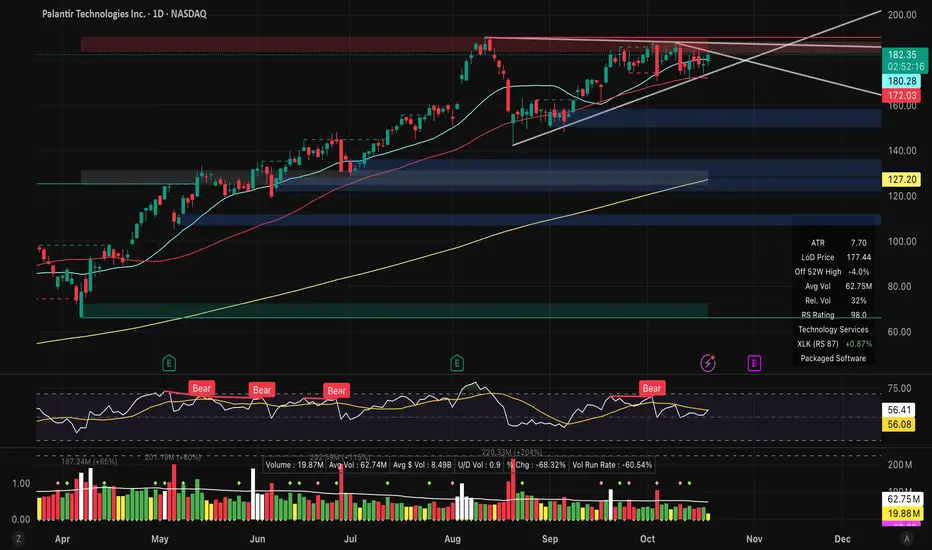
Tight VCP setup forming just under resistance $PLTR 🚀 Stock on My Radar: NASDAQ:PLTR
NASDAQ:PLTR Tight VCP setup forming just under resistance around $189–$190.
✅ 3 clean contractions
✅ Volume dry-up
✅ RS Rating 98
✅ All key MAs aligned (10/21/50/200 uptrending)
Coiling under pivot — looks ready for a potential breakout.
📈 Watching for decisive move > $190 w/ power volume.
Risk stays tight below $178.
#VCP #SEPA #PLTR #MinerviniMethod #Trading
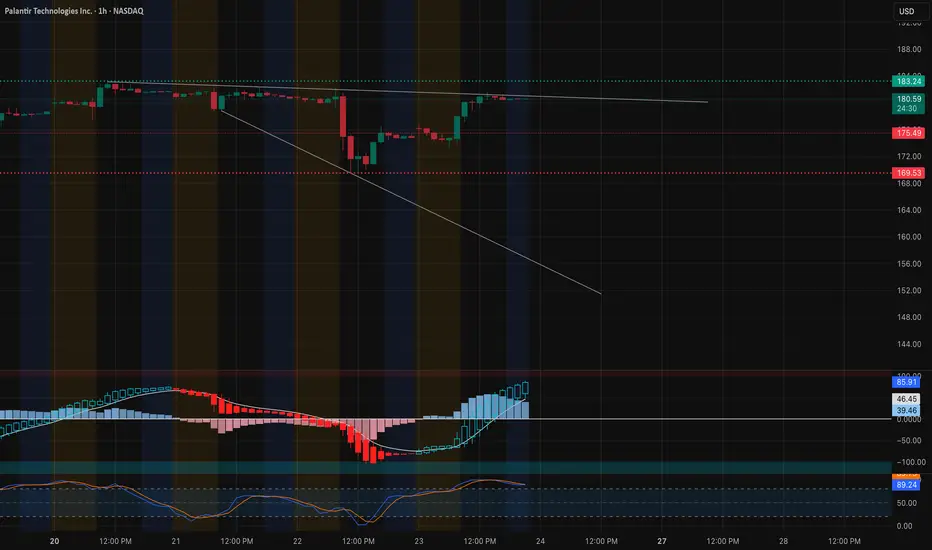
Palantir Technologies (PLTR) — Intraday TA (15-mins) Oct. 20
PLTR is showing a strong intraday recovery structure following an early liquidity sweep and CHoCH near $178.15, confirming buyers stepping in from that demand zone.
Market Structure
* The chart confirms a Break of Structure (BOS) to the upside after defending the morning low, indicating a short-term bullish shift.
* Price is now following an ascending trendline channel, with current resistance near $183.00–$184.00, aligning with the upper intraday trendline.
* As long as PLTR holds above $180.75–$181.50, bulls maintain short-term control.
Supply & Demand Zones
* Demand Zone (Support): $178.15 → $177.45 (where CHoCH occurred).
* Immediate Supply: $183.00 → $184.50 (potential short-term rejection zone).
* Clean break above $184.50 opens room for a move toward $186+.
Indicators
* MACD: Turning positive with a fresh bullish crossover. Histogram momentum is expanding — confirmation of intraday strength.
* Stoch RSI: Rising sharply from oversold, currently near the mid to upper range — expect possible short-term consolidation before continuation.
Scalping Outlook
* Bullish Setup: Watch for continuation above $183.00 with potential to retest $184.50–$186.00.
* Entry: Above $183.20
* Target: $185.50 → $186.00
* Stop: Below $181.50
* Bearish Scenario: Failure to hold above $181.50 could invite a pullback to the $179–$178 zone.
* Entry: Below $181.20
* Target: $179.50 → $178.20
* Stop: Above $182.80
Summary
PLTR is showing a reversal-to-continuation pattern, reclaiming structure after a strong morning flush. Momentum and structure both lean bullish, but it’s approaching a trendline resistance — watch for a breakout retest above $183 for confirmation.
Disclaimer: This analysis is for educational purposes only and not financial advice. Always do your own research and manage risk before trading.

PLTR Retracement x Gaza Reconciliation - Oct 20, 2025 Idea - CY PLTR Retracement x Gaza Reconciliation - Oct 20, 2025 Idea - CY

We could soon be talking again about Palantir...Ten weeks of consolidation could end by a Cup with Handle breakout... or not.
Key points at the time of writing.
✣ New bull market cycle running since June 2025
✣ Market Direction is Up 90%
✣ Stock Fundamentals are good with multi-year growth except in December 2024
✣ Earnings acceleration in last 2 quarters.
✣ Strong Institutional Interest with 2200 Buyers vs 1120 sellers TTM and a ownership of 45%
✣ Stock at base 5 is a red flag !
✣ TTM Performance is 310%
✣ Earnings due in 2 weeks !
If the pattern is broken to the upside, we could see a nice rise in the stock price...

PLTR Friday Crossroads – OCT. 17Bulls Defend $177 Zone as Gamma Pressure Builds Into the Close ⚔️
📊 Multi-Timeframe Breakdown
🕒 1. Daily Chart – Macro Structure (“The Why”)
PLTR has been in a strong uptrend since May, but this week’s CHoCH near $180 signals a short-term shift in character. The daily trendline from the summer lows remains intact, yet momentum has clearly slowed.
The broader structure shows consolidation under $190 supply and above $176 demand, forming a compression range where smart money appears to be rotating positions rather than trending.
Bias: Still bullish in the macro view, but with near-term weakness while price bases above $177–$178.
⏰ 2. 1-Hour Chart – Active Market Structure (“The Setup”)
Zooming in, the 1-hour chart highlights a descending channel with repeated CHoCH and BOS reactions — classic signs of accumulation under pressure. Buyers stepped in near $177.9, creating a reactive low, but sellers continue defending the $183–$185 supply band.
Both 9 EMA and 21 EMA are sloping down, showing short-term bearish bias, but the structure remains intact unless $176 breaks.
Key Levels:
* Support: $177.9 → $176.5
* Resistance: $183.5 → $185.0
* Trendline: Holding higher lows on the intraday uptrend.
Observation: Momentum is compressing, and volume is declining — often a sign of an upcoming volatility expansion.
💹 3. 15-Min Chart – Intraday Execution (“The How”)
On the 15-minute timeframe, PLTR is trading within a tight wedge beneath the intraday trendline.
A short-term BOS confirms bears still have control below $180.7, but the MACD histogram is flattening and Stoch RSI is curling from oversold — a potential early reversal signal.
If price reclaims $180.7 with momentum, we could see a fast push into $183+ as short-term shorts unwind.
Scalp Play Idea:
* Bullish: Enter on breakout above $180.7, target $183.3 → $185, stop below $178.
* Bearish: Enter on rejection below $179, target $176 → $172.5, stop above $181.2.
📈 4. GEX (Gamma Exposure) Chart – Dealer Positioning (“The Fuel”)
Options sentiment is pivotal going into Friday:
* Highest Positive GEX / Call Resistance: $187.5–$190
* Neutral-to-bullish pivot: $182 (Gamma flip)
* Major Put Walls: $175–$172
* Max Put Support: $170 (negative gamma pocket)
With IVR 48.3 and IVx avg 76.2, volatility remains elevated — expect fast moves once price breaks out of this compression zone.
A reclaim above $182 could ignite a dealer hedging squeeze toward $185+, while failure to defend $177 may trigger gamma-driven downside to $172.
🎯 Final Outlook
Friday is a battleground between $177 and $180. Bulls must defend this zone or risk triggering a deeper correction into next week.
If we see a liquidity sweep under $176.5 followed by a reclaim, that’s the setup I’ll be watching for a quick long back into $183+.
But if volume builds on a break below $176, the market could slide fast — fueled by negative gamma flow.
Either way, expect volatility and traps early before trend clarity in the second half of the session.
Disclaimer:
This analysis is for educational purposes only and not financial advice. Always manage your risk and trade your plan.

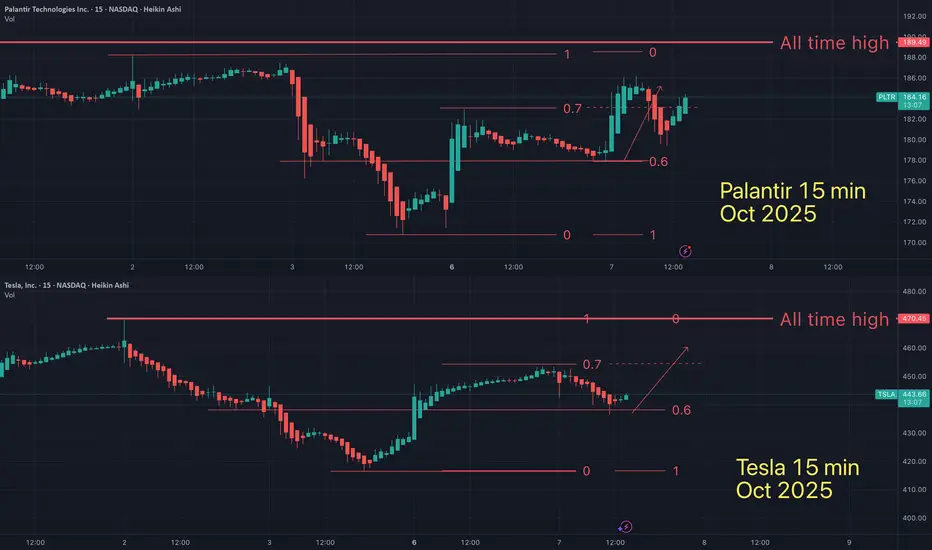
Tesla & Palantir STILL following this fractal.On oct 7th I suggested that Tesla and Palantir were following the same fractal (on the daily & 15 min time frames). They are both still following the fractal, over a week later.
Repeating patterns are everywhere, once we know how tho spot them.
May the trends be with you.

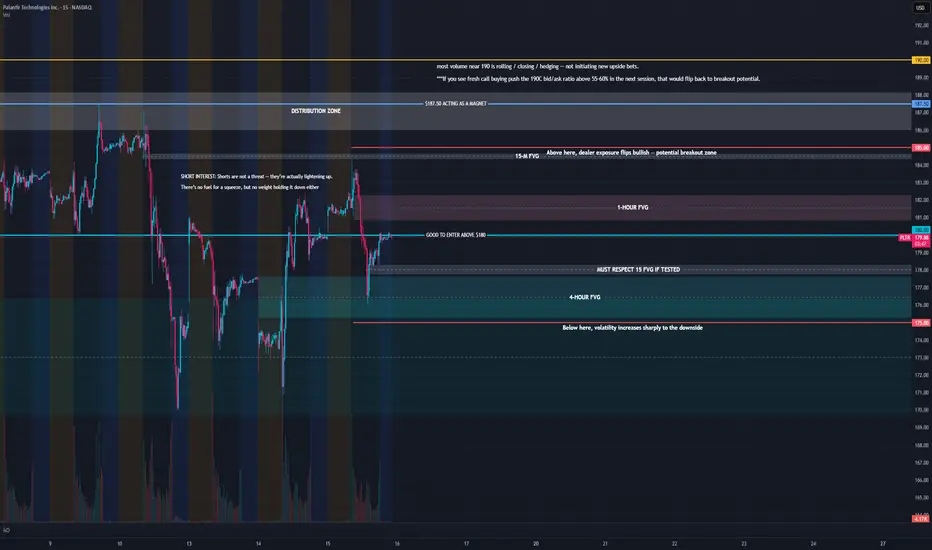
PLTR – Eyeing a Short-Term Push Into the 185–190 ZoneDescription
Been tracking PLTR’s short-term setup and the options flow is starting to paint a pretty clean picture.
Most of the call interest for this week is stacked between $185–$195, with the heaviest concentration around $185–$190 — basically forming a near-term “gamma magnet.” Dealers tend to hedge long when price trades into that zone, which usually supports upside momentum rather than capping it.
Short interest sits around 2.3% of float, and the cost to borrow has stayed soft. That’s not a squeeze setup, but it’s enough to say there isn’t a heavy wall of short pressure right now. Meanwhile, the bid/ask ratios on the 195–200 calls are rising above 55–60%, showing traders are rolling exposure higher rather than closing out.
In short — we’re seeing a healthy rotation of call volume upward while the lower strikes (180–182.5) stay firm. That’s constructive for a potential 3–5 day continuation move.
My Plan:
Watching for a hold above $181–182 to stay in the bullish zone
If PLTR clears $185 with volume, expecting momentum to build toward $188–$190
Planning to take partials there — could stretch to $192 if the OI at 195–200 keeps growing
Cut below $179.50 if it loses call wall support
This isn’t a “rip your face off” squeeze setup — it’s more of a steady gamma-fueled drift higher while dealers stay long hedged.
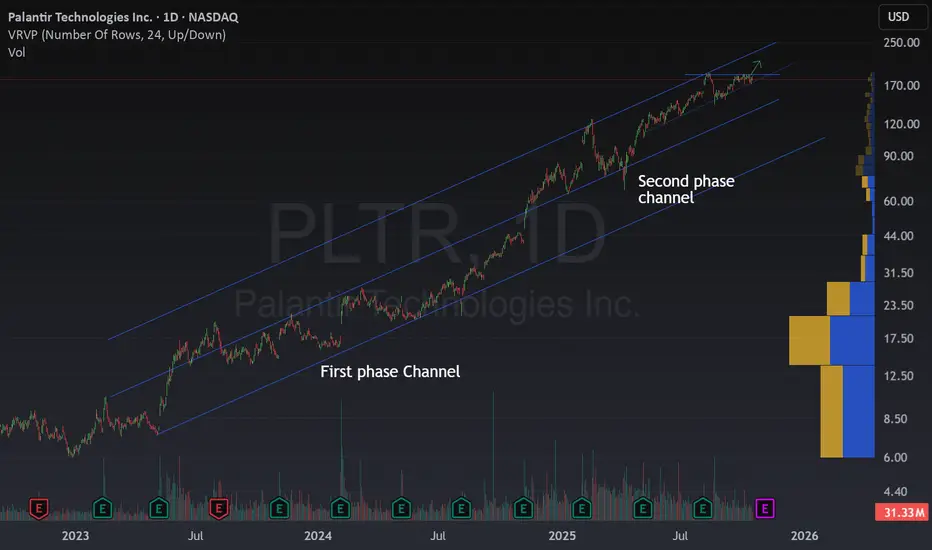
Palantir is Riding a Perfect Uptrend ChannelPalantir has been showing an impressive bullish trend lately.
What’s fascinating is how, from 2023 to 2024, it built a price channel, and after a strong rally, it continued respecting that same channel structure, with the same slope and rhythm, just at a higher price level.
As long as price remains inside this channel, I think the best move is to hold.
Right now, as Palantir approaches the mid-channel zone (blue dashed line) and faces a key resistance that could break soon, it looks like an interesting buy opportunity, if it confirms the breakout.
Several analysts, including Piper Sandler and BofA, have recently set price targets around $200, which aligns with the ongoing bullish momentum.
It’s a great way to join the Palantir rally, but with some caution if you’re holding long-term, it’s definitely running hot!
But… what isn’t these days? 😄
cup and handle. volume reducing adds to the cup and handle. this can go either way. catalyst needed. breakout needed

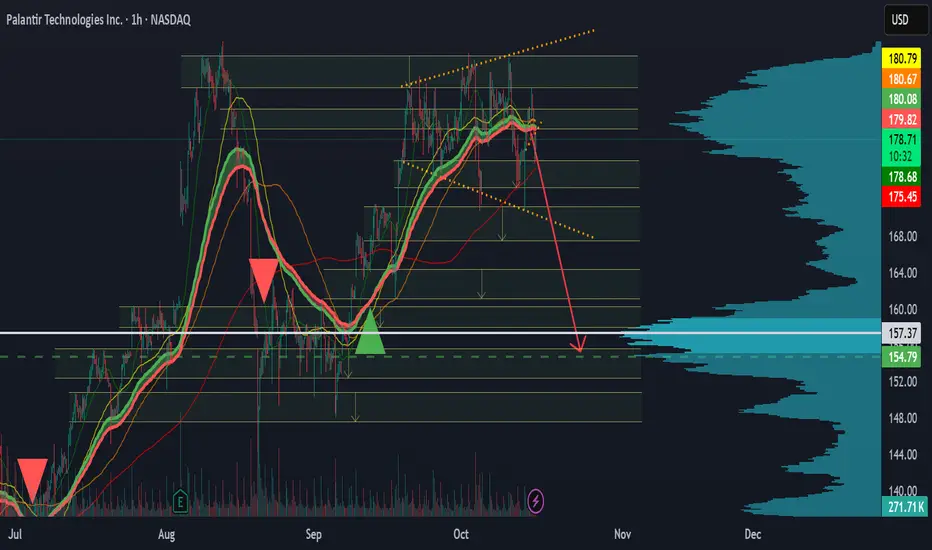
Palantir short ideaPalantir is showing weakness in its recent price action. The latest upward moves lack volume confirmation, suggesting reduced buying pressure. Price is consolidating below a key resistance level and the balance of demand and supply favors sellers. As long as price remains below this zone, a continuation lower toward 156 appears likely. Short position maintained with tight risk management.
⚠️ Not financial advice.
PLTR at a Critical Pivot. Oct. 13PLTR at a Critical Pivot: Will Smart Money Step In or Let It Slide?
Palantir got hit hard on Friday — down over 5%, closing near $175, as fear washed through the entire market. The stock followed the same downward rhythm as NVDA and TSLA, breaking below key trend levels before catching a late-session bounce. But the question now is: is this just a dead-cat move or a sign of smart money starting to accumulate?
Let’s break it down from both the 15-minute intraday structure and the 1-hour GEX setup, which gives us a real sense of how volatility and positioning could drive Monday’s move.
15-Minute Intraday Technical View
Friday’s chart shows a clean descending trendline, and PLTR is still trading beneath it. Each rally attempt last week was met with sharp rejection near the 179–180 zone, which now acts as the first ceiling to watch at the open.
That said, we’re seeing subtle but important signs of exhaustion in the selloff:
* MACD is flipping from deep red toward light blue bars — momentum is slowing.
* Stoch RSI has turned up from oversold territory, hovering around 30–40, suggesting short-term bullish potential.
The immediate support zone sits between 172 and 169. Buyers defended that range late Friday, forming a small higher low structure on the lower timeframe.
If PLTR holds this area and breaks above 177–179, it could trigger a quick relief run back toward 184–186, where heavy resistance sits along the upper channel.
But if PLTR fails to stay above 172, we could see another leg down toward 165, where the next support cluster lies — and possibly deeper toward 150 if the broader market remains under pressure.
Intraday traders should keep it simple:
* Above 179 → look for scalp longs toward 184–186.
* Below 172 → shorts open up back to 165–167.
This is a reactive, not predictive, setup day — let the price show strength before trusting a bounce.
1-Hour GEX Analysis — Options Sentiment
The options market is lining up tightly with the chart levels. The HVL (Highest Volatility Line) sits right around 177.5, which is almost exactly where PLTR stalled at the close. That level acts as a near-term pivot — reclaim it, and the pressure starts to ease; lose it, and volatility spikes again.
Above current price, there’s a clear cluster of Call Walls around 185, 190, and 195, meaning that’s where dealer resistance will kick in. These levels act as “gravity caps” for the stock unless implied volatility drops.
Below, we’ve got Put Walls stacked around 165 and 150, showing heavy downside hedging. The options flow still leans defensive with CALLS at 23.9%, confirming that traders remain cautious going into Monday.
IVR sits around 46.8, while IVX sits at 72.4 — both high but cooling slightly. This suggests volatility expansion may have peaked, leaving room for short-term relief moves if the market finds its footing.
From a GEX standpoint, PLTR is in negative gamma territory below 177, meaning dealers are selling into weakness. If the stock reclaims 180 and holds, gamma turns neutral, which could spark a quick momentum squeeze.
My Thoughts and Trade Ideas
PLTR is sitting right at the intersection of fear and opportunity. The downside momentum looks tired, and both MACD and Stoch RSI are hinting that sellers may be running out of fuel.
Still, this is a name that moves fast both ways — and Monday’s VIX behavior will decide the direction.
If volatility cools off early, PLTR could be one of the first tech names to bounce.
* For day traders, long above 178–180 with targets at 184–186, stops below 172.
* For option traders, consider 180C or 185C for a short-dated pop if SPY holds up.
* If the market opens weak and PLTR breaks 172, switch to 170P or 165P and let it ride — momentum will accelerate quickly in that scenario.
My bias: cautious bullish as long as PLTR stays above 172, bearish only if that floor breaks cleanly.
Final Take
PLTR is at a crossroads. The technicals suggest a possible intraday bounce, but the 1-hour GEX map shows strong overhead resistance.
It’s all about control — if buyers can reclaim 180, we could see a short-covering push into the 185–186 zone.
If not, it’s another trip down the ladder toward 165.
This week will separate patience from panic.
Disclaimer: This analysis is for educational purposes only and not financial advice. Always trade responsibly and follow your own plan.

Has PLTR formed the TOP?PLTR is struggling to breach the $190 levels since August 2025. With the current uncertainty and global tensions along with the stiff resistance of 190 levels, one may look for shorting opportunities in PLTR with targets of 170, 160 and 150. (For educational purposes only)

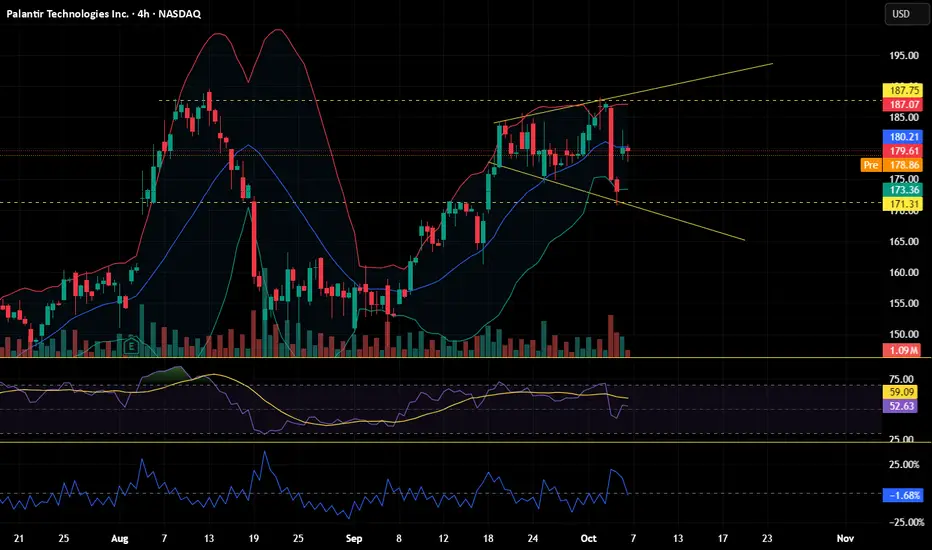
PLTR OCT 2025PLTR (4H) — Pullback into the rising trendline. First demand at 165–170 where ~$1.95B traded (potential absorption). Major distribution at 190, with ~$44B sold (weekly), capping rallies until reclaimed.
Upside targets
182–185
190 (then 195)
Downside targets
170
155–150
140–135
#PLTR #globaltrade #investment #investing #stockmarket #wealth #realestate #markets #economy #finance #money #forex #trading #price #business #currency #blockchain #crypto #cryptocurrency #airdrop #btc #ethereum #ico #altcoin #cryptonews #Bitcoin #ipo

How PLTR used to break double topsHave you noticed that when NASDAQ:PLTR makes double tops, it usually stays close to the breakout line without pulling back too far away?

Here is the Palantir / Telsa Fractal on current 15 min timeframeFractals are a mathmatical anomaly, if you understand linear equations (and believe the market is "random"). All assets are doing the same patterns over and over, on all time frames. You just need to see it for what it is.
May the trends be with you.
expanding triangleas you see on the chart palantir is ranging in a expanding triangle pattern wich is not bearish or bullish.
but an expanding triangle stands for uncertainty in the markets, wich mostly turns bearish.
for palantir now its a bad time to step in, it would be to much of a gamble.
waiting for a breakout above to go long or a breakout down to go short would be the smartest move to make here
ANDREW «LEFT» GOES ANDREW «UP» AS PALANTIR CELEBRATES 5YRS ANNIVAndrew Left from "Citron Research" made his name writing shrewd short-seller reports on companies he deemed troublesome. In mid-August, Left called high-flying Palantir "overvalued".
Since that the stock turned down nearly 17% but resistently printed "Double Top" technical figure after. Now Left is excited about the bullish perspectives.
Palantir shares have jumped more than 1,700% since the data analytics company opened on the New York Stock Exchange 5 (five) years ago on Spetember 30, 2020.
During that time, revenue has roughly quadrupled as the company inked more deals with the U.S. government and benefitted from advancements in artificial intelligence.
Palantir’s steep valuation and reliance on government contracts have raised concerns.
The stock price has surged more than 1,700%, closing on Monday nearly at $180 for a market cap of over $430 billion. That puts it among the 20 most-valuable U.S. companies, and above tech stalwarts like Cisco and IBM.
Last year, Palantir joined the S&P 500, replacing American Airlines NASDAQ:AAL .
Quarterly revenue surpassed $1 billion for the first time last quarter, and is expected to reach $4.2 billion this year, according to analysts surveyed by LSEG, up almost sixfold from 2019. The company’s roster of customers grew from 125 in the first half of 2020 to 849 at the end of June. During that time, Palantir has added 1,500 full-time employees.
CEO Alex Karp, who founded the company in 2003 alongside notable investors like Peter Thiel and Joe Lonsdale, was exerting optimism on day one of Palantir’s life on the public market.
“We’ve reached a base where our company is very significant,” Karp, who holds a law degree from Stanford and PhD in neoclassical social theory from Goethe University in Frankfurt, Germany, told in an interview on listing day.
“Being in the public space will help us with our clients and help us grow.”
In a report in August 2025, Citron Research’s Andrew Left, a noted above ex-short-seller, called Palantir “detached from fundamentals and analysis.” When compared to OpenAI’s recent $500 billion valuation, he said Palantir should be priced at $40, or less than one-quarter of its current price, if it was assessed the same revenue multiple as the artificial intelligence startup.
“Karp and his team should be proud. But for investors, that’s where discipline kicks in,” Left wrote. “Comparison is the enemy of happiness, and when measured against true AI leaders, Palantir’s price already reflects success beyond its fundamentals.”
Karp, who doesn’t shy away from a dispute, recently told detractors to “exit” if they “don’t like the price.”
“We are going to be the most important software company in the world, and people will figure out what that’s valued over a long period of time,” Karp said on the day of the company’s NYSE debut.
For now, i.e. over the past 5 years since IPO debut, Palantir is among Top 3 S&P500 index performers, alltogether with Supermicro NASDAQ:SMCI (#1 rank) and Nvidia shares NVDA (#3 rank).
Over the past twelve months, Palantir stock has added nearly +350 %, and this is the 2nd return over all components, just after new kid on the block, Robinhood Markets NASDAQ:HOOD stock that entered S&P500 index earlier this year.
--
Best wishes,
@PandorraResearch Team
