Update.155 target from prior post achieved. Price accelerated through the red bullish divergence lines. Got worried with NVDA pump but luckily now that created a very clean price target now. Looking to hit 142 next. White solid lines are showing a negative divergence in RSI vs price.
Trade ideas

QuantSignals V3: PLTR Bearish Divergence PUT SetupPLTR QuantSignals V3 – Weekly PUT Trade (2025-11-19)
Trade Signal:
Direction: BUY PUTS (Short)
Strike Price: $165.00
Entry Price: $4.60–$4.65 (mid $4.62)
Target 1: $6.90 (50% gain)
Target 2: $8.32 (80% gain)
Stop Loss: $3.23 (30% risk)
Expiry: 2025-11-21 (2 days)
Position Size: 3% of portfolio
Confidence: 65% (Medium)
Market Analysis:
Trend: NEUTRAL with strong bearish bias on short-term expiry day
Price Action: Current $164.25, down 10.06% intraday
Technicals: EMA BEARISH, RSI 25.6 (oversold), VWAP resistance $172.45, support $161.79
Options Flow: Put/Call Ratio 1.44, institutional put-heavy positioning
Momentum: Weekly -2.52%, 2-week -3.56%, confirming bearish trend
News Sentiment: Positive news failing to lift price; bearish divergence present
Competitive Edge:
Time series shows near-term weakness despite Katy AI neutral summary
High PCR indicates smart money positioning for downside
Mid-week entry maximizes theta decay for short-term puts
Tight stop loss limits downside risk
Risk Notes:
Medium-high risk due to oversold RSI and only 2 days to expiry
High gamma risk – monitor closely, consider exiting early if price holds above support
Low conviction trade; smaller position size recommended
Strategy Rationale:
Combines strong bearish technical momentum, bearish options flow, and price-news divergence for a high-probability put setup
Pre-expiry positioning captures rapid time decay potential while mitigating risk with tight stop

155 targetIf price breaks the prior low (solid yellow line) target of 155.00 in play. Expect price to accelerate downward when RSI passes the bullish divergence line.

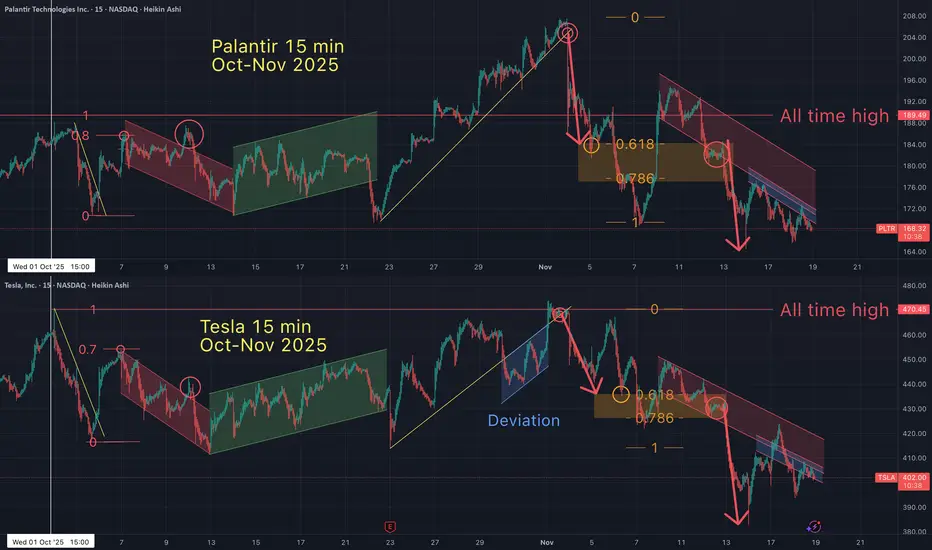
Tesla / Palantir FRACTAL - STILL following for weeks now.So why focus on fractals? I'm driving a point home and I hope you get it. These Tesla/ Palantir "fractal" charts should trigger questions like, "how is it possible for these 2 random assets to basically have the same price action (at the same time) over a 5 week period (on a 15 minute time frame & the 1 day"?
Or better yet, you may ask yourself, "how was I able to spot this fractal, weeks ago AND anticipate they would track so closely"?
"How can this be used in trading"?
Yet the most important question one can ask is, "what else have I not been seeing"?
So many of you have been reaching out to me, asking me how am I so accurate? Yet they don't schedule the 30 min FREE consult I offer in my description. They claim they don't want to learn TA (or pay for education), they just want me to briefly summarize my life's work for them so they don't have to do ANY of the work (or pay for it). That's Intellectual Property Theft and I can't give that magic shortcut cheat code, that so many desperately seek. What I can offer is an answer to "how am I so Accurate".
I studied my ass off, as if I had just discovered gold. In the process, I developed an eye for broad based "pattern recognition" & a mind for "tracking historical data/statistical analysis". I put in the work. MOST importantly, I also had/have a willingness to study, which sadly most of you will not. There is no short cut for learning TA! No magic indicator, no "free lunch" for the impatient. Learn. Grow. Learn more.
"Achieving mastery in a skill requires about 10,000 hours of deliberate practice"
-Malcolm Gladwell
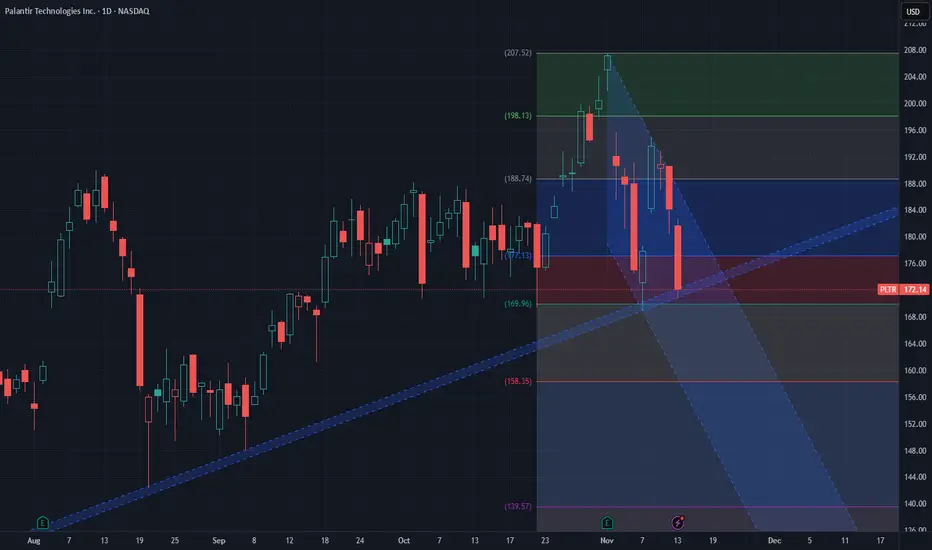
PLTR Technical Analysis (Daily Chart)In your chart, PLTR is trading inside a well-defined ascending channel.
Right now, the price is sitting exactly on the lower boundary of the channel, close to the 50-day moving average (SMA50) — a major decision zone.
This area typically determines whether the market will:
Bounce toward the top of the channel,
or
Break down into a deeper correction.
Bullish Scenario (Bounce from channel support)
If PLTR holds support around $165–170 and prints a bullish reversal candle:
Upside Targets
1. $185 – first resistance / SMA50
2. $205 – mid-channel resistance
3. $225–230 – top of the ascending channel
Bullish Stop-Loss
Below $158
(A confirmed breakdown of the channel support)
Bearish Scenario (Breakdown below channel)
If the price closes below $158, the ascending channel breaks and a broader correction begins.
Downside Targets
1. $145 – first major support
2. $125 – next historical support
3. $105–110 – deeper correction / long-term support
Bearish Stop-Loss
Above $172
(In case of a failed breakdown and retest)
Quick Summary
• PLTR is at a major inflection point.
• As long as the channel bottom holds, the trend remains bullish.
• A confirmed breakdown = start of a larger correction.

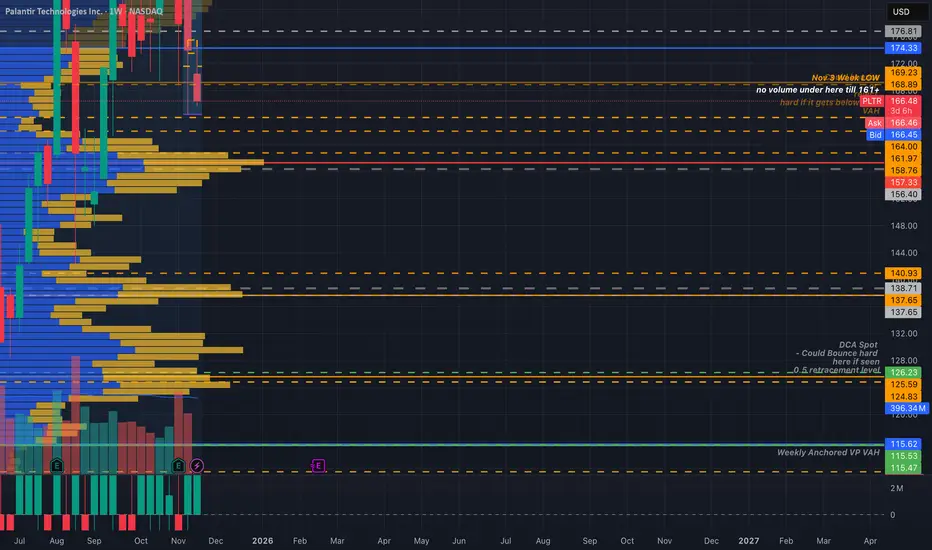
Huntin Wabbits 2.0 - The Doc Sees What's UpPalantir is coming into that death zone if the market doesn't see a recovery soon. If seen, the PA at 161-157(VPOC) will let us know if we dip to $126-$124 again.
Taking a look at this weekly volume profile, the most value for buyers would be at the $115 area.
I'd sell my wife and kids to buy that dip. Jk, I'm single ladies ;).
If price falls and is maintained below the VPOC this simply means that sellers have taken control. Continuation below there and the stock gets Burry'd.
PLTR USPalantir: Rocket Growth vs. Sky-High Valuation. Which Will Outweigh the Other?
The quarterly results are very strong, but investors face significant risks. Let's break it down.
🚀 Strengths:
Explosive revenue: $1.18 billion (+63% YoY), EPS: $0.21. Both metrics beat expectations.
Brighter-than-expected future: Q4 guidance ($1.33 billion) and 2025 guidance (~$4.4 billion) are significantly higher than consensus.
Commercial: 121% YoY growth in the US. This is the company's main driver.
Sales are strong: Closed contracts worth $2.8 billion. The client base grew to 911 companies (+45%).
Super-efficient: Revenue +63%, while headcount is only up 10%. An operating margin of 51% is fantastic.
AI is the fuel: Products like AIP are accelerating adoption, and customers are switching en masse to the Palantir platform.
⚠️ What's scary: Risks and "buts"
The price is sky-high: A P/S ratio of over 110 is nonsense, even for a growing company. Market cap is growing faster than revenue.
The model predicts a collapse: Under optimistic scenarios (40% annual growth), the fair price could be tens of percent lower than the current one.
Share dilution: Share-based compensation (SBC) eats up 24% of revenue—a huge amount. Insiders are actively selling.
Shorted a billion: The legendary Michael Burry bought put options on 5 million shares, betting against PLTR. He believes the AI sector is inflating.
Vulnerability: Business is concentrated in the US, creating regulatory and macro risks. Europe is experiencing stagnation.

Palantir reversal underway.Here is the #PLTR chart compared to Silver.
We can observe a softness in this ratio.
This has formed a minor head and shoulders pattern, initiating a downward trend.
In the end, I truly believe that the significant inverse head and shoulders breakout is probably going to be tested.
Michael Burry's puts might very well yield substantial returns as a lot of the AI trade experiences a retracement or backing and filling following some massive upward movements.

PLTR Weekly Bounce Alert — Don’t Miss This AI SignalPLTR QuantSignals V3 Weekly 2025-11-14
Ticker: PLTR
Current Price: $165.24
Trend: Mixed / Oversold
Confidence: 60%
Expiry: 2025-11-21 (7D)
Strike: $165.00
📈 AI & Technical Forecast
Katy AI Target: $187.16 (+13.3% upside)
Detailed Time-Series: Uptrend toward $190+ by mid-week
RSI: 9.9 → deeply oversold, strong mean-reversion potential
Weekly Range Position: 2.8% → near capitulation
EMA / MACD: Bearish alignment → but sets up rebound opportunity
Insights:
Contrarian setup: heavy institutional put accumulation (PCR 3.12) signals potential upside squeeze
Mixed news: CEO bullish commentary vs. defensive sentiment from hedge fund activity
Low volume (0.1× average) → price may move sharply on small flows
🎯 Trade Setup
Parameter Value
Direction CALL
Strike $165.00
Entry $10.96
Target 1 $16.40 (+49.6%)
Stop Loss $7.65 (–30.3%)
Expiry 2025-11-21
Position Size Moderate (consider 2–3% portfolio)
⚡ Key Advantages
Oversold RSI + AI bullish trajectory → potential rebound squeeze
Contrarian against institutional put-heavy positioning
Deep ITM strike limits extrinsic decay and provides high delta exposure
Timing Edge:
Friday expiration allows discount on premium ahead of expected mid-week momentum
Potential upside acceleration if put-heavy positions unwind
🚨 Risk Notes
Expiration week → elevated gamma and theta risk
Low liquidity and volume → choppy price action possible
Stop loss should be strictly followed due to high-risk setup
Conflicting market signals → manage position size carefully
Summary
PLTR weekly call offers medium-conviction, contrarian upside potential, combining AI bullish trajectory, oversold RSI, and institutional positioning for a 7-day horizon.

PLTR long daily gap playI already entered too early.
Maybe new entry at the daily gap. would cut the trade when we close below the gap.

$PLTR The short of the year?Update NASDAQ:PLTR
I am still heavily short.
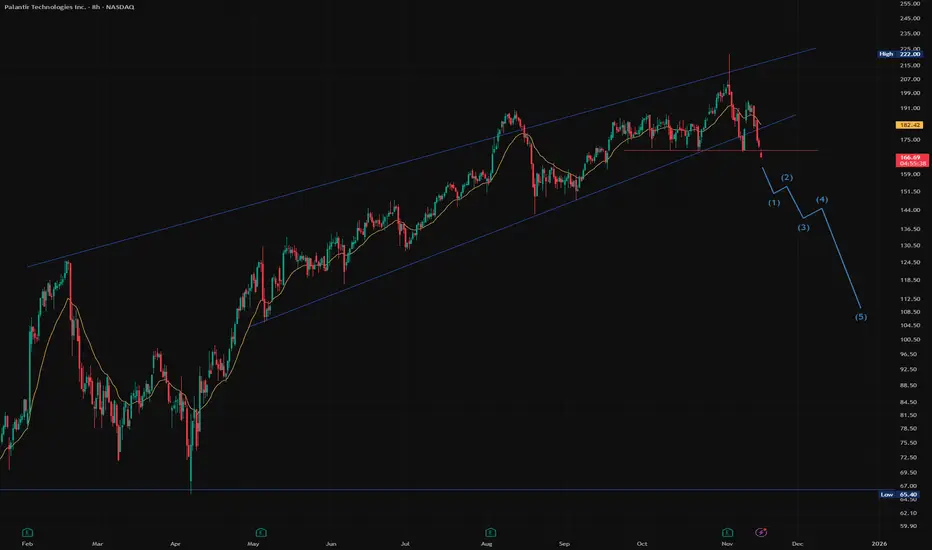
Palantir has spent all of 2025 inside a bull channel. I see bull channels as bear flags because they behave exactly the same.
Now we’ve broken the channel in the pre market and taken out a 5-touch support level. That’s a major structural failure.
Nothing is guaranteed in trading, but it’s hard to find a cleaner setup than this. Risk/reward is exceptional.
A Risk of Deeper Pullback in PLTRThe trend on daily/time-short frames is weak, momentum is bearish, the chart shows a likely distribution phase entering mark-down.
Its Longer term trend is still positive but fading.
I’d lean bearish to neutral in the near‐term with a risk of deeper pullback .
PLTR - wave [4]PLTR completed the wave at $207.52.
The current decline is probably a wave .
In terms of duration, this wave may be proportional to wave , that is ~ 2 years.
So I expect the end of the wave in October 2027.

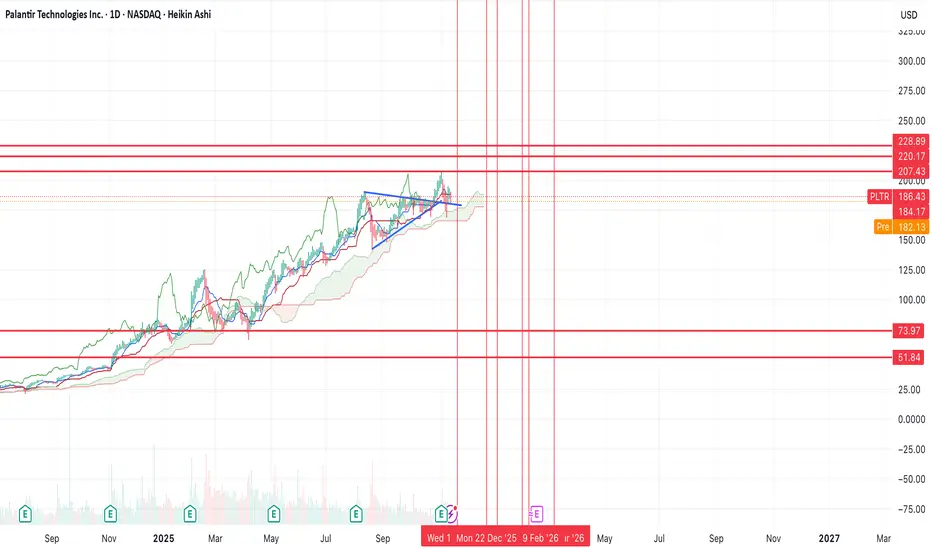
PLTR one more push up before a 70% correction?NASDAQ:PLTR looks like it's on it's last legs here.
If it can push off of this trend line here, then I think we can see one last move higher either into prior resistance, or there's a chance we can break it and form brief new highs. However, after that, I think we'll see a 70% correction back to the lower supports.
We'll either bottom at $74 or $52.
My best guess as to timing is that we bottom before March 2026.
Act Fast: PLTR Weekly Puts Signal Rapid Profit Potential!PLTR Weekly Options Signal 2025-11-12
Current Price: $183.04
Trend: Neutral (slight bearish bias)
Weekly Momentum: Bearish (-4.76% 1W)
Confidence: 65% | Conviction: Balanced
Expiry: 2025-11-14 (2 days)
Recommended Strike: $177.50
Trade Signal:
Direction: Buy Puts
Entry Range: $1.48–$1.53
Target 1: $3.00 (+100%)
Target 2: $4.50 (+200%)
Stop Loss: $0.75 (-50%)
Position Size: 2.5% of portfolio
Options Flow:
Bearish, PCR 1.33 → heavy put buying
Unusual activity at $250 put suggests institutional hedging
High gamma risk favors short-term directional trades
Insight:
Katy AI predicts a modest downward trajectory (-3.01% over 3 days)
Strong bearish momentum and bearish options flow suggest potential downside
Moderate risk → precise timing and small position size recommended
⚠️ Risk Warning:
Short timeframe with high gamma risk → trade carefully
Educational commentary for QS Premium members only; not financial advice
PLTR at Decision Point: Price, Liquidity and Powerful GEX ShiftPLTR has been trading like a stock waiting for permission to move. Every time it dips, the structure holds. Every time it pushes, momentum fades. It’s the classic pre-breakout compression you see when GEX pressure is reshaping the entire chart behind the scenes.
If you look closely, PLTR isn’t reacting to random levels — it’s reacting to gamma shelves, neutral pockets, and hedging clusters.
And price is sitting right inside a pocket where the next move tends to be sharp, not slow.
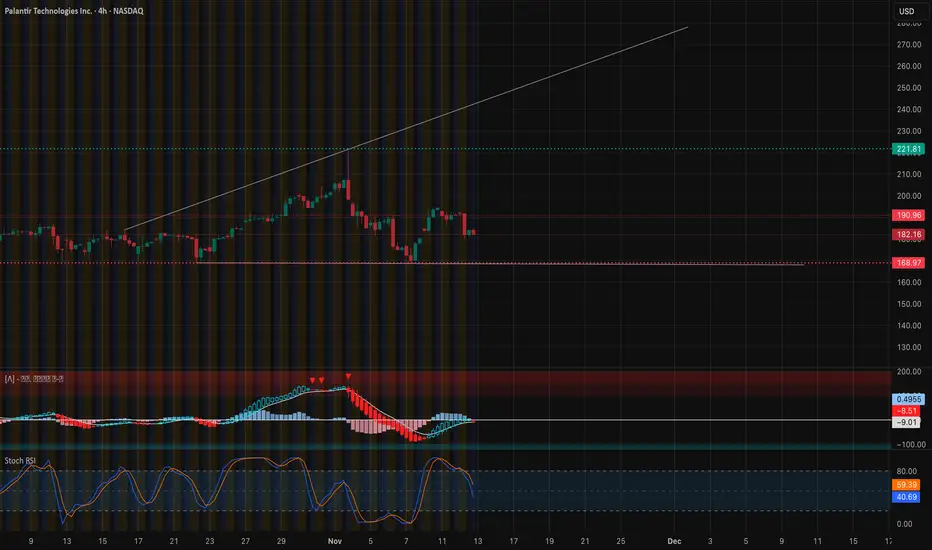
4H — The Structural Story
On the 4H chart, PLTR keeps retesting the same liquidity band near 182–184 — the same region where prior BOS and CHoCH levels formed. This zone is acting like a quiet anchor.
It’s not just technical support.
It’s also where GEX flips from neutral to mildly positive, which naturally slows down selling pressure.
Every bounce from this zone feels controlled, not emotional.
That’s usually a sign of accumulation — or at least defense — by larger players.
1H — Short-Term Calm, Big Potential Energy
On the 1H chart, PLTR is pressing against a thin demand layer. The candles look indifferent, the volume is mild, and sellers don’t have the same force they had earlier in the week.
Why?
Because PLTR is sitting right inside a neutral GEX pocket.
Neutral pockets do one thing extremely well:
They store energy and then release it in one clean direction.
When price leaves a neutral pocket, it usually accelerates — either into the positive GEX shelf above or the negative zone below.
That’s the entire battleground.
GEX Data — The Heart of PLTR’s Setup
(Refer to screenshot below)
This GEX landscape is crystal clear:
🔹 A major positive GEX cluster sits at 190–195
This is the “gravity zone” above current price.
When PLTR enters this zone, hedging flows stabilize the move — often creating controlled bullish structure.
🔹 Neutral GEX pocket between 182–188
This is where PLTR is trapped now.
Price doesn’t accelerate much here, which is why it feels like the stock is “stuck.”
🔹 Negative GEX zone below 182
This is where things get dangerous fast.
If PLTR breaks here, dealer hedging flips and selling accelerates.
This is why I rely heavily on GEX:
It maps out the path of least resistance in a way pure price action cannot.
🔥 Trading Suggestions Based on Structure + GEX
📌 Bullish Setup (Higher Probability)
Price must hold 182–184 and show even a small reclaim of 186–187.
Entry:
185–187 on confirmation (strong 1H candle or liquidity sweep + reject)
Target 1: 190.00 (first positive GEX shelf)
Target 2: 192.50 (clustered gamma resistance)
Target 3: 195.00 (major GEX wall)
Stop-Loss:
Below 181.50 (the moment price enters the negative GEX zone)
This play works because the moment PLTR pushes above the neutral pocket, GEX flow shifts toward the magnet at 190–195.
📌 Bearish Setup (Only if 182 breaks)
This is a fast-move scenario.
Entry:
Break and hold below 181.80
Target 1: 178
Target 2: 175
Target 3: 169 (deep negative GEX liquidity)
Stop-Loss:
Above 184
If price enters negative GEX territory, dealer hedging accelerates the decline, which is why downside can be clean.
🔥 Options Trading Suggestions Based on GEX
📌 Bullish Options Play (Higher Probability)
IF PLTR stays above 182–184 and begins pushing toward 188–190:
Buy:
PLTR 190C or 195C 1–2 weeks out
(These lie directly in the positive GEX shelf)
Reason:
Positive GEX shelves slow volatility and create controlled upside — perfect for directional call plays.
More Conservative Play:
Debit Call Spread: 185/195
(Great R/R inside a rising GEX environment.)
📌 Bearish Options Play (Only if 182 Breaks)
IF PLTR breaks and holds under 182:
Buy:
PLTR 175P or 170P
Reason:
Once PLTR enters the negative GEX zone, dealers must short into the move → downside accelerates, and puts expand in value quickly.
Safer Bearish Play:
Put Debit Spread: 182/175
📌 Neutral/Compression Play
IF PLTR stays inside 182–188 neutral pocket:
Sell Premium Strategy:
Iron Condor or Short Strangles (experienced traders only)
Reason:
Neutral pockets = low volatility = premium decay accelerates.
This is the zone where nothing meaningful happens until a breakout.
My Thought
PLTR is in a rare moment where technical structure and GEX are telling the exact same story:
* Price is compressing
* Liquidity is tightening
* GEX shelves are defining the entire battlefield
* And the breakout direction will be very clean once price exits this pocket
If PLTR holds 182–184 → the path toward 190–195 opens fast.
Lose 182 → price slides into negative gamma and accelerates lower.
Either way, GEX already shows the zones where the real move will unlock.
This outlook is for educational purposes only and not financial advice. Always manage your risk and trade your plan.
PLTR CAUTION!PLTR is at a key critical area, which has already given a warning shot to bulls.
We have a complete rising wedge structure with 3 waves up and a hook that has already cracked! Within it, we also have a head and shoulders at the top, which is bearish. (H&S not a top is usually a continuation pattern.) AS is always the case, if the overall market is not ready to head south, it will fail as a full-on reversal pattern.
I urge CAUTION!! to PLTR bulls.
For shorts, you need to see a crack, gap fill, plus follow through for a new lower low in a small time frame. You can't have a reversal without lower lows and lower highs.
Thank you ALL FOR getting me up to 5,000 followers!! ))
Click boost, follow, comment nicely for more authentic, no BS, raw analysis. Let's get to 6,000 followers. ))

Michael Burry is right about Palantir$PLTR. I have said it before, Michael Burry is right about Palantir.
Expect something like this:

Game Theory & Prices/Options?I posted this before a long time, how crowd in markets always think of the same price.
Here I dont know how this works (but from market behaviors i can assume...), how options influence market? ie NASDAQ:PLTR breaking above the 100$, with enough strength... it has to clear the 150$ and next target is 200$. Because market makers are forced to buy the stock, when unlikely before this period anyone would buy 200$ options. Just a theory.

PLTR --> $85?I'm thinking Mike Burry going to post some kind of Heisenburg type tweet that justifies his PLTR short. Not too long ago was this in the $80s before yet another double of the market cap. Karp videos looking a little sketchy lately after Burry posted the short and Karp defended... I'm thinking Nov 25, 2026+ PLTR will fall hard. Market profile $85 is the next support on a big drop... wild to think... but the chart from $5 is wild in and of itself... makes sense for the smart investors to have taken their 3000% gains and look for greener pastures.

Palantir PLTR Potential 25% momentum?Can Palantir PLTR continue to rocket to the moon? Price has been respecting the moving averages. Palantir has been strong for several months. Is it over or will it continue to crush shorts?

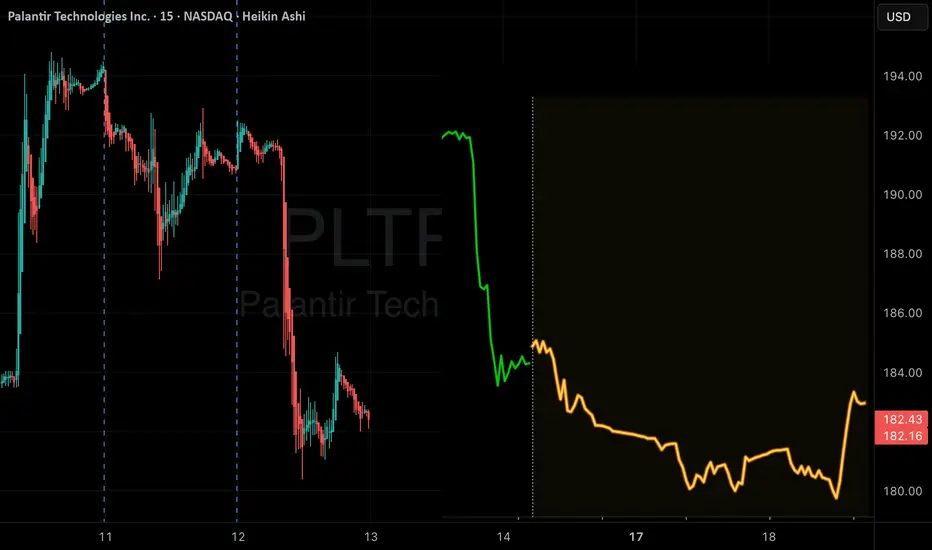
Tesla / Palantir FRACTAL - When will it endTodays 14% Palantir bounce was followed by Tesla...at the same time...in the same ratio.
Learn to spot patterns.
May the trends be with you.
