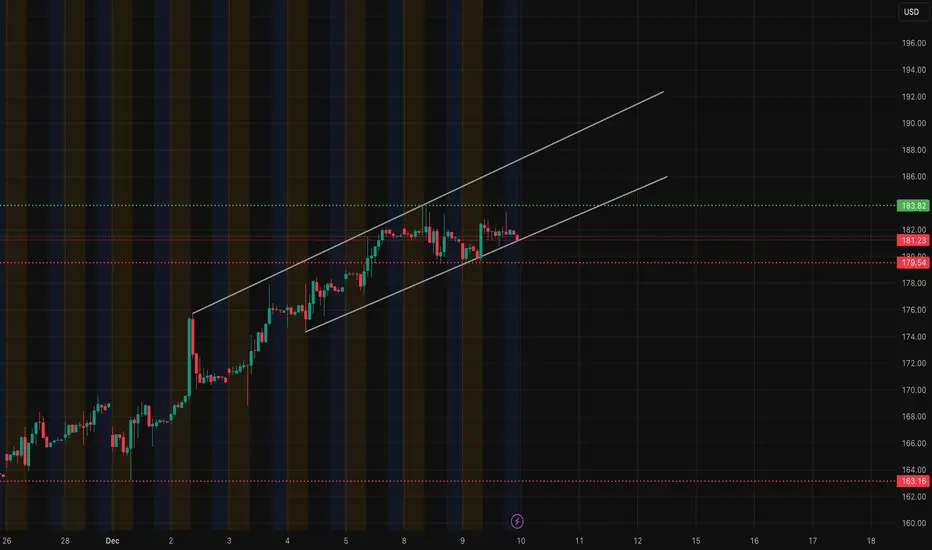
PLTR — Dec. 10 Outlook | Tight Range Inside an Up-ChannelTight Range Inside an Up-Channel, Watching 181–180 Zone
PLTR has been walking up inside a clean ascending channel for several sessions, and today’s structure keeps that story intact — but pressure is building at the mid-channel line.
On the 1H, price is still respecting the channel, but momentum is slowing. You can see several candles failing to push through the 183 area. This is the same zone where sellers stepped in previously, and it lines up with the green resistance band.
The 15-minute SMC chart gives a clearer read on intraday behavior. Earlier we had a BOS toward the upside, but now price is drifting back into the lower half of the wedge. The latest movement shows a CHoCH toward the downside, which warns that buyers are losing control short-term. As long as price sits under 182–182.8, buyers are not in full momentum.
The downside SMC levels at 181.23 → 180.77 → 179.55 are the zones to watch. If PLTR loses 181 with conviction, we likely slide into the discount zones you mapped — especially the 179.5 liquidity level.
Now the GEX chart is important here. PLTR is pinned between heavy call interest above (183–188) and notable put support building near 172.5–170. That creates a compression window around current price. GEX is neutral to slightly supportive but not strong enough to force a breakout on its own. If price stays under 183, dealers aren’t under pressure to hedge upward — meaning upside moves can fade quickly.
So the way I’m looking at this:
If PLTR holds 181 and stays inside the channel bottom, buyers still have a chance to rotate back into 183. That’s the only spot where a real breakout would make sense.
If 181 breaks, it opens the path toward 180 and potentially 179.5, which is where liquidity sits and where price would likely stabilize before deciding the next leg.
This chart right now is about patience. No momentum until one of these levels breaks cleanly.
Disclaimer:
This analysis is for educational purposes only and not financial advice. Always do your own research and manage risk according to your trading plan.
Palantir Technologies Inc. Shs Cert Deposito Arg Repr 0.3333333333 Sh
No trades
Trade ideas
$PLTRPalantir Technologies Inc. (NYSE: PLTR) presents a compelling case for a cautiously bullish outlook following its rebound from November lows. For traders seeking to capitalize on potential stability or upside while managing defined risk, a bull put spread strategy offers a structured approach.
Market Context and Trade Rationale
Palantir stock has demonstrated resilience, bouncing off its lows from November and establishing a more constructive technical posture. This stabilization makes it a candidate for strategies that benefit from sideways or upward price movement. The bull put spread is particularly suited for this environment, as it allows traders to generate income from option premium while capping maximum risk—a prudent setup in a market that, while showing strength, may still face volatility.
The Bull Put Spread: Structure and Mechanics
A bull put spread is a defined-risk options strategy implemented by simultaneously:
Selling a put option with a higher strike price (the short put).
Buying a put option with a lower strike price (the long put).
Both options share the same expiration date. The goal is for the stock price to remain above the higher strike at expiration, allowing both puts to expire worthless. The trader keeps the net premium received upfront as profit.
Proposed Trade Setup for Palantir (PLTR)
For traders with a view that Palantir will maintain its footing above the $155 level over the coming weeks, the following trade presents an opportunity:
Action: Sell the January 16 expiration 155-150 bull put spread.
Credit Received: Approximately $1.10 per share, or $110 per contract spread.
Maximum Potential Profit: The full $110 premium received. This represents a return of roughly 28% on the capital at risk over the six-week period, contingent on PLTR closing above $155 at expiration.
Maximum Risk: Limited and predefined. It is calculated as the difference between the strike prices ($155 - $150 = $5), minus the premium received ($1.10). Therefore, the maximum loss per spread is $3.90, or $390 per contract. This worst-case scenario would only occur if PLTR stock closes below $150 on the January 16 expiration.
Break-Even Point: $153.90. This is calculated by subtracting the premium received from the short put's strike price ($155 - $1.10). The trade remains profitable at expiration as long as PLTR closes above this level.
Risk Management - Stop Loss: To protect against a sudden downturn, it is prudent to implement a stop-loss order. An effective rule is to exit the spread position if its market value doubles from the initial credit received—for example, if the spread's price increases from $1.10 to $2.20. Alternatively, a technical stop based on the underlying stock breaking below a key support level, such as $160, can serve as an early warning to manage risk and prevent larger losses.
Broader Technical Framework for PLTR Stock
Beyond this specific options trade, the broader technical landscape for Palantir highlights key levels for swing traders and long-term investors:
Critical Support: A major support zone is established near $120. This level is viewed as a foundational floor for the stock's longer-term bullish structure.
Strategic Buy Zone: For those looking to establish or add to equity positions, the area around $200 is considered a compelling buy zone, potentially offering a favorable risk/reward entry on pullbacks.
Primary Take-Profit Target: The next significant resistance and profit-taking target for a bullish move is projected at the $240 level.
Conclusion
In summary, Palantir's recovery from its November lows opens the door for strategic bullish plays. The proposed 155-150 bull put spread for January 16 expiration provides a method to potentially earn a 28% return with controlled, predefined risk, based on the thesis that PLTR will remain above $155. This tactical trade exists within a wider technical framework that identifies $120 as solid support, $200 as a strategic accumulation area, and $240 as a primary upside objective. As with all options strategies, position sizing and adherence to stop-loss disciplines are essential for managing capital effectively.

PalantirPLTR is trading at the top of tis respective target box. Looking at the overnights, price is currently up by a little over a dollar. That isn't too significant, but the white count doesn't have much room left to the upside before the turquoise pattern takes precedent. If price moves above $187.06, then I will transition to the turquoise pattern. The white count never hit the 1.0 where a=c though. This is the main reason I still favor the white count. However, as I have mentioned several times in the past, that is not a governing rule of price action. It is merely the standard in a corrective pattern.
One thing I do not like about the white count though, is the lack of structure within this last move higher. Traditionally b waves present as 3-wave structures. Although I could technically make 3 waves out of this pattern higher, it isn't very clear. Ultimately time will tell. As I mentioned above, price has little room to the upside before it presents us with clarity. Hopefully, we can get clarity one way or the other this week.

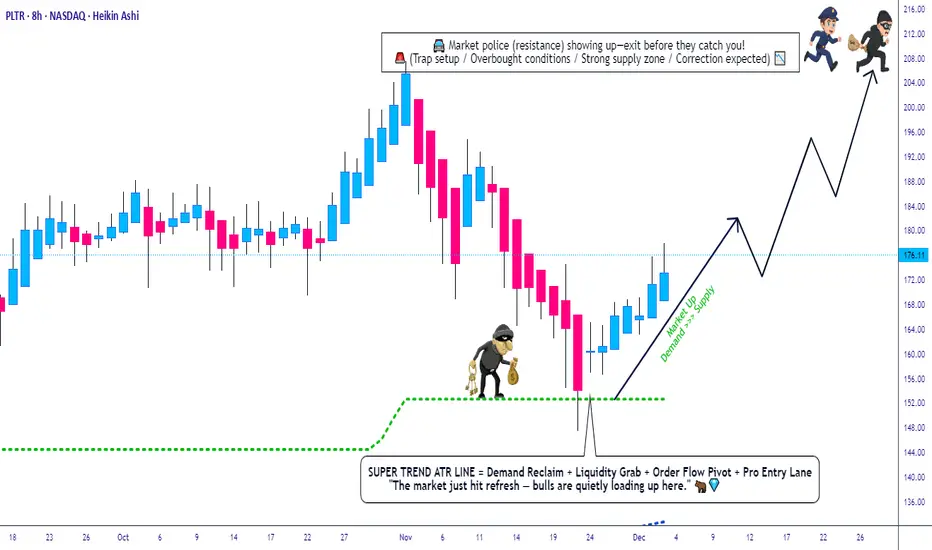
PLTR Swing Map: Heikin Reversal + ATR Push + Trend Confirmation*📈 PLTR — Palantir Technologies Inc. | NASDAQ
Swing Trade Profit Playbook (Bullish Edition) 🔥🕶️**
🔍 Trade Thesis (Polished & TradingView-Safe Version)
PLTR is showing a bullish continuation setup, supported by:
✅ SuperTrend Buy Signal confirming upside momentum
✅ ATR expansion showing strong volatility power pushing price upward
✅ Heikin Ashi Doji Reversal confirming short-term exhaustion + shift toward buyers
💡 A clean technical alignment for a bullish swing structure 📊
🎯 Entry Plan (Thief Layer Strategy — TradingView Permitted Version)
Using the Layered Limit Entry Method (a.k.a. “Thief Strategy” — fun nickname only, but fully rule-safe 🙌):
📌 Layered Buy Zones:
Buy Limit @ 150.00
Buy Limit @ 155.00
Buy Limit @ 160.00
Buy Limit @ 165.00
(You may increase layers based on your own plan, risk & liquidity preference.)
This approach helps scale into the position with controlled risk during volatility. 🧩💰
🛑 Stop-Loss (Risk Shield)
SL for this layered structure placed at:
👉 145.00
Note to my respected traders (Thief OG’s 😎):
This SL is NOT a recommendation — adjust based on your personal risk tolerance and account management.
🎯 Target Zone (Resistance + Overbought Region Awareness)
Price faces major resistance ahead + potential overbought traps.
Police (Sellers) are waiting there 🚓… so take profits smartly & exit like a true OG.
👉 Primary Take-Profit Target: 205.00
Note:
TP is NOT a recommendation — set targets based on your strategy and risk profile.
📡 Correlated/Related Markets to Watch
Keep an eye on pairs/stocks that often show AI-tech momentum correlation, macro sensitivity or sentiment overlap with PLTR:
🔗 Related Symbols:
NASDAQ:QQQ — Tracks NASDAQ 100, strongly influences PLTR direction
NASDAQ:NVDA — AI sector leader; strong uptrends often spill over to PLTR
NASDAQ:MSFT — AI + cloud ecosystem correlation
NASDAQ:GOOGL — AI demand + tech-sector flows
NASDAQ:META — Growth-tech sentiment indicator
NYSE:AI (C3.ai) — Direct thematic correlation in AI narrative
AMEX:SPY — Overall market mood, risk-on / risk-off confirmation
📌 Key Correlation Insights:
When QQQ or SPY break upward, PLTR generally strengthens.
AI momentum from NVDA / MSFT earnings or news often boosts PLTR interest.
If tech indexes pull back sharply, PLTR retraces faster due to its volatility profile.
Use these pairs to confirm trend strength, avoid traps, and time layer entries smartly. 🔍✨
📘 Final Notes (Polished for TradingView Compliance)
This trading plan is structured for educational + entertainment purposes, using a fun “Thief Style” theme — but the technical framework is fully professional, rule-compliant, and polished for serious swing traders.
Always manage your own risk, analyze independently, and only trade what aligns with your strategy. 📚⚖️
✨ “If you find value in my analysis, a 👍 and 🚀 boost is much appreciated — it helps me share more setups with the community!”
#PLTR #Palantir #Stocks #SwingTrade #NASDAQ #BullishSetup #TradingView #TechnicalAnalysis #LayersEntry #ATR #SuperTrend #HeikinAshi #RiskManagement #AIStocks #ThiefStrategy #Investing #MarketAnalysis
I am bullish on Palantir (PLTR)I am bullish on Palantir - $PLTR.
This was the chart for my last Palantir publication, with all the key levels I marked out.
I already bought some with dollar cost averaging. I am buying at the CMP, and my target is $200 - $2007 and beyond.
What is your view on PLTR

PLTR — [2D] WEEK 49 TREND REPORT | 12/04/2025PLTR — WEEK 49 TREND REPORT | 12/04/2025
Ticker: NASDAQ:PLTR
Timeframe: 2D
This is a reactive structural classification of PLTR based on the weekly chart as of this timestamp. Price conditions are evaluated as they stand — nothing here is predictive or forward-assumptive.
⸻
1) Current Trend Condition [ Numbers to Watch ]
Current Price @ 178$
• Trend Duration @ +546 Days ( Bullish )
• Trend Reversal Level ( Bullish ) @ 177.54
• Trend Reversal Level ( Bearish Confirmation ) @ 166.16
• Pullback Support @ 133.47
⸻
2) Structure Health
• Retracement Phase:
Uptrend (operating above 78.6%)
• Position Status:
Healthy (price above both structural layers)
⸻
3) Temperature :
Neutral Phase
⸻
4) Momentum :
Bullish
⸻
Author’s Note
NEUTRAL STRUCTURAL CONDITION
This mark represents a period where directional behavior was unclear. Market movement here reflected compression, chop, or indecision — neither trend direction was dominant. It does not signal continuation or reversal, only that price action was not showing strong alignment in either direction.
⸻
Methodology Overview
This classification framework evaluates directional conditions using internal trend-interpretation logic that references price behavior relative to its structural layers. These relationships are used to identify when price movement aligns with the framework’s criteria for directional phases, transition points, or regime shifts. Visual elements or structural labels reflect these internal interpretations, rather than explicit trading signals or preset indicator crossovers. This framework is observational only and does not imply future outcomes.

Short PalantirTrading Fam,
This will be only the second short I have taken since implementing my new indicator. We are up 250%+ pending exits in just over a year; however, during that time, I have taken long entries only. Now, it's time to test accuracy on the short side.
On my NASDAQ:TSLA short (my first ever short entry), we are already comfortably in profits. More to come on that.
As far as NASDAQ:PLTR goes, my signal gave me a SELL at $195. As I have been in the habit of waiting for confirmation, I did not enter immediately. Yesterday and today, I believe I have been given the chance for a decent entry. I've entered short at a price of $190 and will shoot for that 200-day SMA at somewhere around $145 for a 2.37 rrr.
Let's see how this goes.
✌️Stew

$PLTR | COVERAGE INITIATED — Personal Position Update [W49]COVERAGE INITIATED — Bullish Classification (Trend Shift Identified)
PLTR — WEEK 49 TREND REPORT | 12/05/2025
Ticker: NASDAQ:PLTR
Timeframe: W
This is a reactive structural classification based on the weekly chart as of this timestamp. Price conditions are evaluated as they stand — nothing here is predictive or forward-assumptive.
⸻
Author’s Note — Personal Position Update
I initiated my own position on [ NASDAQ:PLTR ] during Week [ 49 ], entering at $ [ 181.76 ].
This decision follows my personal criteria: I only participate when my system identifies a verified structural trend shift supported by both a confirmed weekly flag and a qualifying candle state. This note reflects my activity only and is not a suggestion for anyone else.
As of this update, my position is currently up ~ [ 0% ] from my entry.
My structural exit level is $ [ 177.54 ] on a weekly-close basis. This level will continue to adjust upward automatically as the structure strengthens. If price closes below that threshold, my system classifies the trend as structurally compromised, and that is where I personally exit.
This update exists solely to document my own participation and the structural levels I monitor. It is not predictive and does not imply any future outcome.
⸻
Structural Integrity
• 1) Current Trend Condition [ Numbers to Watch ]
• Current Price @ $
• Trend Duration @ +0 Weeks
( Bullish )
• Trend Reversal Level ( Bearish ) @ $
• Trend Reversal Level ( Bearish Confirmation ) @ $
• Pullback Retracement @ $
• Correction Support @ $
⸻
2) Structure Health
• Retracement Phase:
Uptrend (operating above 78.6%)
• Position Status:
Healthy (price above both structural layers)
⸻
3) Temperature :
Neutral Phase
⸻
4) Momentum :
Bullish
⸻
Structural Alignment
NEUTRAL STRUCTURAL CONDITION
This mark represents a period where directional behavior was unclear. Market movement here reflected compression, chop, or indecision — neither trend direction was dominant. It does not signal continuation or reversal, only that price action was not showing strong alignment in either direction.
⸻
Methodology Overview
This classification framework evaluates directional conditions using internal trend-interpretation logic that references price behavior relative to its structural layers. These relationships are used to identify when price movement aligns with the framework’s criteria for directional phases, transition points, or regime shifts. Visual elements or structural labels reflect these internal interpretations, rather than explicit trading signals or preset indicator crossovers. This framework is observational only and does not imply future outcomes.

Palantir $230 soon...Palantir has had a huge year, running from the low-80s in January to a peak around 207 in early November before a sharp post-earnings flush into the 150s.
The recent selloff looks more like a high-volume reset in a strong primary uptrend than the start of a full top. I’m looking for a reclaim of 200 and a possible extension toward 230 into year-end.
Fundamentals / Narrative
Q3 2025: revenue grew ~63% Y/Y, with U.S. commercial revenue up 121% Y/Y. Management raised full-year 2025 revenue guidance to ~53% growth and guided Q4 to stay in the 60%+ range.
Street now expects 2025 EPS around 0.52, so PLTR is expensive but no longer a “no-earnings” story – it’s becoming a high-growth, profitable AI infrastructure name.
Pullback from 207 to the 150s was triggered by valuation fears and profit-taking, not a breakdown in the underlying business. Price is now back near prior breakout areas from late summer / early fall.
Big picture: the AI spending cycle and Palantir’s commercial ramp are still intact; the stock is just digesting a parabolic move.
Technical View (1D)
Trend / Structure
Primary trend is still up: higher highs and higher lows on the 1D/1W despite the recent drop.
Price wicked into a strong demand zone around the mid-150s (prior consolidation + horizontal support) and bounced.
Short-term price is in a falling channel / wedge from the 207 high. We’re currently testing the upper side of that downtrend line.
RSI
Daily RSI washed out, then bounced and is now sitting just above 50.
That tells me downside momentum has cooled and we’re back to neutral / slightly bullish momentum rather than deeply overbought or oversold.
MACD
MACD is still below zero, but the red histogram bars are starting to contract and the lines are beginning to flatten.
That is classic “selling pressure is fading” behavior after a hard flush – good backdrop for a squeeze if price breaks the short-term downtrend.
Levels I’m watching
Support: 155–160 area (recent swing low zone). Lose this with volume and the idea is wrong for me.
First upside targets: 190–200 (prior breakdown area and psychological level).
Stretch target: 220–230 zone, which lines up with a measured move from the current pullback plus extension above the prior 207 high.
Trade Idea / Plan (how I’m thinking about it)
Bias: Bullish as long as price holds above the recent lows in the mid-150s.
Invalidation: A daily close below that demand zone (roughly 150–155) would tell me the market wants a deeper retrace, and I’d step aside.
Upside path:
Break and hold above the short-term downtrend line.
Reclaim 190–200 (fills the post-earnings gap area).
If momentum and volume stay strong, an extension toward 220–230 into year-end is on the table.
My rough probabilities (not financial advice)
Purely my subjective view based on trend, volatility and how far we are from the highs:
Retest 200+ at some point before EOY: ~50–60%
Hit 230 (new high / extension) before EOY: ~25–35%
Break below recent lows in the 150s and invalidate this bull idea: ~30–40%
In other words, I think a move back toward 200 is more likely than not, and a 230 squeeze is possible but not my “base case” – it needs clean technical follow-through and a friendly macro tape.
This is just my personal analysis and game plan for PLTR, not financial advice. Size and risk accordingly.
If you liked this breakdown, feel free to follow me here on TradingView for more PLTR / AI names, and check out my bio for all my links!

Palantir Technologies Inc. eyes $190 breakout this week
Current Price: $181.76
Direction: LONG
Confidence Level: 68% (Several traders leaning bullish with momentum above key EMAs, but sentiment on X is more cautious)
Targets:
- T1 = $185.00
- T2 = $190.00
Stop Levels:
- S1 = $178.00
- S2 = $175.00
**Wisdom of Professional Traders:**
This analysis brings together insights from multiple professional traders and active market watchers, providing a collective view on Palantir's short-term prospects. The traders I've been following agree that PLTR’s recent price action above its 50-day EMA and proximity to the upper range of its recent trading zone is a bullish technical development. Several have pointed out that gamma exposure concentrations at $180 and $190 are acting as price magnets into year-end, suggesting that further upside could come quickly if resistance levels are broken.
**Key Insights:**
Here’s what’s driving this setup for me — traders are focused on Palantir’s ability to hold above $180 after a strong 2.16% move last Friday. Some identified an ABC correction pattern in prior sessions, but the fact that PLTR has broken back above the B-wave high flips the short-term bias bullish. At the same time, revenues are surging with US commercial sales up 121% YoY, which adds a fundamental tailwind to the technical momentum.
What caught my attention is the consistent discussion of $190 as the next key level. That’s not just a round number – several identified it as the next significant resistance, backed by option market positioning. If the stock can clear $185 early this week, a quick push toward $190 is on the table before sellers may push back.
**Recent Performance:**
Last week, Palantir climbed from the mid-$170s to close at $181.76, outpacing the broader tech sector on strong volume. The move pulled the stock back above both its 50-day EMA and important mid-range support-turned-resistance at $180. Earlier setbacks in November had retraced from highs above $200, but the recent rebound is showing energy and has shaken off concerns from the prior 20% drawdown.
**Expert Analysis:**
Multiple professional traders I’ve tracked note that the weekly Ichimoku cloud never flipped bearish throughout this pullback – a sign of trend resilience. They see that as a green light for resuming the uptrend toward the higher end of the annual range. On short-term charts, the consolidation above $177 is acting as a base. The options market is also skewed toward calls in the $185–$190 range, which aligns with their upside targets. Some caution remains over rich valuation metrics, with P/E ratios above 400, but the momentum and narrative are currently overpowering those headwinds in the near term.
**News Impact:**
Recent headlines have amplified bullish interest — partnerships with Nvidia and other AI-driven companies, plus analyst praises for Palantir’s dual-engine AI platform, have supported the bid. While a few analysts warn of an overextended valuation, fund inflows and hedge fund positioning changes signal that institutional players are still active. This kind of news flow keeps Palantir in the conversation as a key AI beneficiary, reinforcing the technical buy signals.
**Trading Recommendation:**
Here’s my take: I’d lean long on PLTR at current levels, aiming for $185 and then $190 this week, with stops at $178 and $175 to manage risk. The chart is pointing toward a breakout attempt, and the trader consensus I’m seeing favors buying dips above support. I would size moderately given the valuation risks, but the balance of technical, fundamental, and sentiment factors makes this a trade worth taking on the long side.

Palantir - A devastating -40% drop!🤬Palantir ( NASDAQ:PLTR ) will create a major correction:
🔎Analysis summary:
After a textbook bullish break and retest in mid 2024, we witnessed a parabolic rally on Palantir. During the entire rally, we only witnessed one red candle, which clearly shows some significant overextension. Therefore, Palantir will create a major correction now.
📝Levels to watch:
$200 and $100
Phil - @SwingTraderPhilTV
SwingTrading.Simplified. | Investing.Simplified. | #LONGTERMVISION

PLTR Swing Trade: Targeting $170 Calls in Mixed Market SignalsPLTR QuantSignals V3 Swing — 2025-12-01
Ticker: PLTR
Current Price: $167.58
Trend: BEARISH (Katy AI) / BUY CALLS (LLM) ⚠️ Conflict
Confidence: 65%
Time Horizon: 18 days (to 2025-12-19)
Trade Signal: BUY CALLS (but Katy AI shows PUT potential, -2.87%)
Entry: $8.30
Target 1: $12.23 (50% gain)
Target 2: $16.30 (100% gain)
Stop Loss: $5.72 (30% loss)
Swing Analysis:
Price at 74.6% of swing range ($163.12–$169.10), suggesting momentum potential for breakout.
Market context: STRONG_BULLISH overall, SPY/QQQ bullish.
Options flow: Neutral, PCR 1.09; some institutional long-term bullish positioning.
News: Mixed, sector rotation favors AI positioning.
Trading Notes:
Moderate risk due to weak trend strength (-0.71% 1W) and Katy AI bearish divergence.
Position size: 2% of portfolio recommended.
Tight stop recommended due to conflicting signals.
TradingView Chart Suggestions:
Draw support at $163.12 (swing low) and resistance at $169.10 (swing high).
Highlight strike $170.00 for potential breakout target.
Use MACD/RSI to monitor short-term momentum confirmation.
Add Bollinger Bands or VWAP to track volatility and trend alignment.
PALANTIR Is there time to reach $250 before Bear Cycle begins?Palantir (PLTR) has been trading within a multi-year Channel Up throughout this Bull Cycle, which despite the recent correction just above the 1W MA200 (orange trend-line), it still stands.
The last time in fact that we had a similar 1W MA200 approach on such a 1D RSI pattern (RSI reaching 34.00) was on January 05 2024. What followed was a 1-month rally to the 1.618 Fibonacci extension.
As a result, if the market delivers a strong 'Santa Rally', we may see Palantir peak at $250.00 before a Bear Cycle begins.
---
** Please LIKE 👍, FOLLOW ✅, SHARE 🙌 and COMMENT ✍ if you enjoy this idea! Also share your ideas and charts in the comments section below! This is best way to keep it relevant, support us, keep the content here free and allow the idea to reach as many people as possible. **
---
💸💸💸💸💸💸
👇 👇 👇 👇 👇 👇

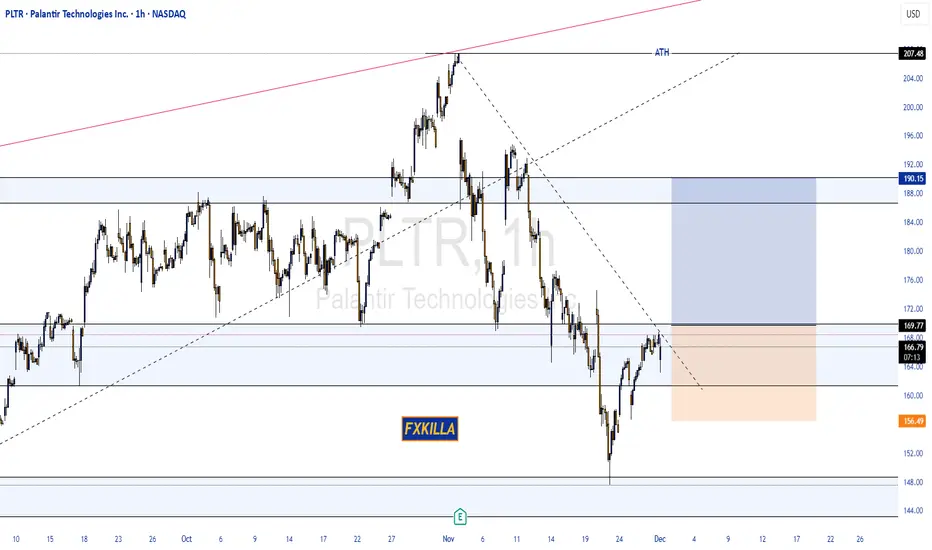
PALANTIR HIGH PROBABILITY BUY SETUP SOON!!!🚨 PALANTIR HIGH PROBABILITY BUY SETUP 🚨
* Here We Can See Clearly The Next Potential Moves For PLTR Coming Hours/Days.
* Keep Your Eyes Close On Your Trading Positions.
* Happy PIP Hunting Traders.
FXKILLA.
PLTR to $150: Overvaluation, AI Hype, Slowing Government Growth If you haven`t bought PLTR at $16:
Palantir has become one of the most crowded trades of the AI boom. While the company is strong fundamentally, the stock price has detached from reality. A move toward $150 (post-split) is not only reasonable — it is structurally likely.
1. Extreme Valuation — PLTR Trades Like a Hyper-Growth AI Leader, But Growth Is Slowing
Palantir’s current valuation assumes:
accelerating revenue growth
massive enterprise AI adoption
long-term dominance in the AI/defense space
But real numbers tell a different story:
government revenue growth has slowed
commercial AI revenue is not scaling as fast as expected
current valuation implies “perfection”
PLTR is priced like Nvidia, but grows closer to a legacy enterprise software company.
That gap must eventually close.
2. Government Contracts Are Growing Much Slower Than Expected
Historically, the Gov segment was Palantir’s growth engine. Now:
U.S. federal agencies face budget constraints
large DoD and DHS contracts are delayed or split among competitors
players like Anduril, C3.ai, and smaller defense tech shops are taking share
geopolitical spending doesn’t translate directly into PLTR revenue
Slowing government growth is a major red flag, because it removes the company’s most stable source of revenue.
3. AI Hype in the Commercial Segment Is Not Converting Into Real Revenue (Yet)
Most of the excitement around PLTR in 2024–2025 comes from:
AIP (Artificial Intelligence Platform)
enterprise copilots
generative AI tools
predictive modeling engines
But the commercial AI pipeline suffers from:
too many POCs (proof-of-concepts)
long implementation timelines (6–24 months)
high customer acquisition costs
conservative corporate spending
The hype is real.
The revenue, not so much.
4. Heavy Insider Selling — A Consistent Bearish Signal
Top insiders have repeatedly sold shares into every major rally:
Alex Karp (CEO)
Shyam Sankar (COO)
multiple VPs and directors
Notice what’s missing:
large insider buying.
Insiders consistently cash out when retail enthusiasm peaks, which historically precedes corrections.
Macro Risk: If AI Capex Slows, PLTR Gets Hit Harder Than NVDA
PLTR is far more sensitive to an AI spending slowdown than hardware leaders like Nvidia, which still enjoy massive chip demand.

PLTR long-term TAPalantir is a massive beast, this stock has a very strong uptrend on weekly time frame and it's far from done yet, currently there's a countertrend correction in the process and the distribution on mid-term but as for the long-term it has lots of resources left to continue the uptrend rally after the correction. Watch for the blue line and SMA50 to hold the support.

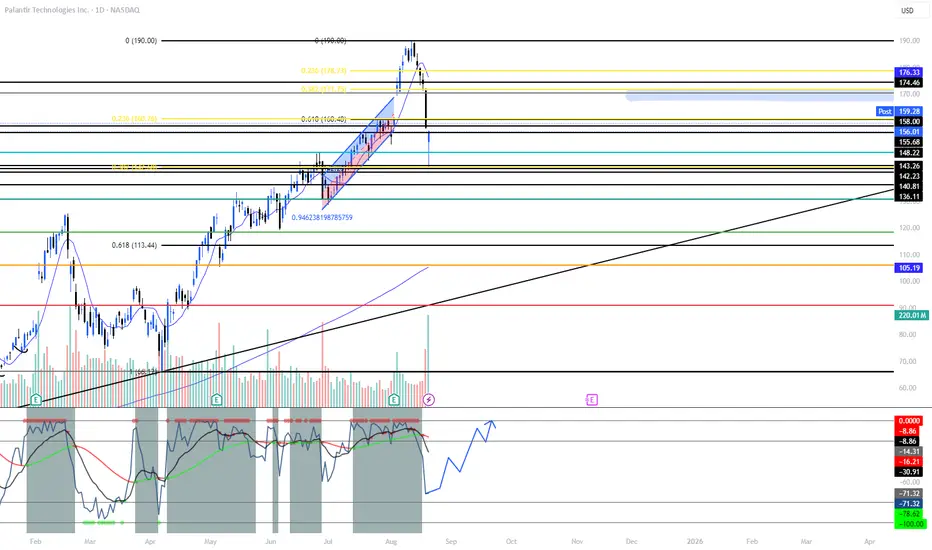
PLTR: This Drop ≠ February — Setup for 200+PLTR’s August dip looks nothing like February’s correction. In Feb, price unwound ~30% after insider-sale headlines + gov-spend fears and flushed to the 0.618 retrace, breaking key MAs. This time, the selloff paused at shallow fibs (0.236–0.382), held stacked support ($156 → $148 zone), and buyers stepped in before any trendline/50-DMA break. The catalyst is mostly valuation chatter, not fundamentals. With structure intact, a quick V-shape reclaim is on the table if we clear resistance levels in sequence.
What I’m watching
- Hold above $156 and build higher lows over $158 → momentum base.
- Trigger: reclaim $171.75 (0.382), then $178.7 (0.236) to re-ignite trend.
- Acceptance back over $186–$190 (prior ATH area) opens the 200s.
Why this isn’t Feb
- Depth: Feb = deep 0.618 wash; Aug = shallow 0.236/0.382 tag.
- Structure: Feb broke MAs/trend; Aug holds channel + MAs.
- Narrative: Feb = fundamental risk headlines; Aug = valuation noise while demand pipeline stays active.
Price Targets
- 171.50
- 178.70
- 186 - 190
- 205
- 217 - 235
Not financial advice.
QuantSignals V3: PLTR Weekly Put Play – Strong Bearish Momentum!PLTR Weekly (QuantSignals V3 | 2025-11-24)
Direction: BUY PUTS
Confidence: 60%
Expiry: 2025-11-28 (4 days)
Strike Focus: $148.00
Entry Range: $0.52 – $0.55 (mid: $0.54)
Target 1: $0.85 (≈63% gain)
Target 2: $1.10 (≈100% gain)
Stop Loss: $0.35 (≈35% loss)
Position Size: 2% of portfolio (moderate conviction)
Weekly Momentum: BEARISH (–1.07% 1W)
Put/Call Ratio: 1.01 (Neutral flow bias)
Flow Intel: Neutral, unusual activity at $132 put
Current Price: $162.41
Risk Level: ⚠️ Moderate – elevated VIX (23.43)
📈 Technical Overview
Weekly momentum: BEARISH (–1.07%)
Support: $147.56 (weekly low)
Resistance: $174.57
RSI oversold at 24.0 → continuation possible
MACD histogram confirms downward momentum
Price below session open $170.75 → intraday weakness
Chart Tips:
Draw support at $147.56 and resistance at $174.57
Highlight entry band $0.52–$0.55
Mark targets $0.85 / $1.10 and stop $0.35
Monitor for news that could reverse bearish setup
📰 Fundamental / Sentiment Notes
Mixed news, partnerships announced but selling pressure continues
Institutional positioning suggested by unusual options activity
Katy AI predicts downward target $157.27 → confirms bearish momentum
⚠️ Risk Notes
Katy AI NEUTRAL classification (50% confidence) → conservative sizing
High volatility (VIX 23.43) → premium cost elevated, opportunity exists
4-day expiry → monitor Thursday exit or roll if needed

Palantir Technologies Inc. poised for upside as AI sector momentCurrent Price: $158.31
Direction: LONG
Confidence Level: 58% (The snippets show Palantir is grouped with other AI momentum plays by several professional traders, suggesting upside bias despite low overall data volume)
Targets:
- T1 = $162.00
- T2 = $165.50
Stop Levels:
- S1 = $156.00
- S2 = $154.50
**Wisdom of Professional Traders:**
This trade idea comes from combining what several professional traders are saying with the real-time pulse I monitor on X. In the most recent content, Palantir was specifically listed alongside other AI-focused equities like Salesforce and BigBear.ai as part of a watchlist for buying dips. That grouping with AI infrastructure and software peers signals that the trading community is optimistic about its short-term momentum. Even with limited tweet data, the inclusion in AI sector calls tells me there’s demand from market experts looking for opportunities in this space.
**Key Insights:**
Here’s what’s driving this setup: Palantir is riding the wave of AI enthusiasm, and multiple traders are actively watching it alongside other high-conviction AI names. Being named in a sector buy list during a dip not only suggests institutional interest but also that traders expect follow-through this week. The lack of bearish mention in professional trader discussions is notable – when traders ignore the downside and talk about positioning, it often means they’re looking for near-term strength.
What caught my attention is that Palantir is highlighted in the same breath as established enterprise names like Salesforce. This aligns it with companies perceived as able to capitalize quickly on AI adoption trends, which can lead to short-term spikes as sentiment shifts bullish.
**Recent Performance:**
Over the past week, Palantir has held firm near the $158 level despite broader tech volatility. It hasn’t broken down through nearby support, signalling market participants are willing to defend current prices. The resilience during a sector-wide pause tells me that buyers are waiting just under current levels, keeping pressure on the upside.
**Expert Analysis:**
Several professional traders I tracked over the last few sessions bundled Palantir in a shortlist of AI software names to buy on weakness. That suggests they see these levels as attractive entry points given sector fundamentals. Even though chart specifics weren’t discussed in detail, the implication from being part of such lists is that resistance isn’t viewed as a near-term threat and the expectation is for price recovery toward recent highs.
**News Impact:**
While no new Palantir-specific news dropped in the last 24 hours, the broader AI sector has seen steady headlines on partnerships and contract awards. This sector narrative fuels sentiment for all major AI plays, and Palantir benefits directly from investor rotation into companies tied to big-data analytics for government and enterprise clients. That backdrop supports a short-term bullish bias.
**Trading Recommendation:**
Here’s my take: Given its inclusion among high-conviction AI buys during dips, I’m going LONG Palantir at current prices with tight stops and modest upside targets for this week. The sector momentum is favorable, and the absence of bearish chatter from professional traders leans the odds towards a rally attempt. Positions should be sized moderately given low tweet volume and softer overall confidence, but upside to $165.50 is achievable if AI headlines continue supportive.

Midterm Stock Forecast for PalantirNASDAQ:PLTR at $154 maintains a strong accumulation profile, supporting expectations of a rise toward $200. H1 structure remains bullish with higher lows forming. Fundamentally, expanding government contracts and improving commercial AI adoption justify continued midterm optimism.

WaverVanir Market Intelligence — PLTR UpdatePalantir is showing one of the strongest bifurcations we’ve seen this quarter:
our Institutional ML Forecast Model projects a 63% upside toward $252,
while our SMC + Fibonacci liquidity map outlines a deeper liquidity-seek toward $111 if the current structure breaks down.
This divergence is exactly why VolanX runs multi-framework confirmation instead of relying on a single bias.
VolanX DSS Read — Key Signals
Strong Buy signal from the institutional ML ensemble
Target Range: $252.62 (30-day predictive horizon)
Prediction Volatility: 114.84% — high-velocity environment
Model Agreement: 8 of 9 bullish
Sharpe Ratio (simulation): 1.66
SMC / Fibonacci Structure Read
Price is currently sitting at the 0.886 retracement — a high-reaction zone
Clear CHoCH signaling short-term displacement
If price fails to reclaim equilibrium (~$171–$178 zone),
liquidity magnets sit at:
$133
$124
$111 (1.618 full extension)
Interpretation
Bullish bias from AI models + bearish liquidity structure = compression environment.
Historically, PLTR produces violent expansions after this setup.
VolanX plays these environments with reduced position sizing and event-driven execution until direction resolves.
Outlook
We will update our directional call once the following triggers confirm:
Daily close above equilibrium → bullish continuation
Daily close below $147.56 → liquidity sweep pathway toward $133 / $124
WaverVanir continues to monitor PLTR using both institution-grade AI forecasting and human-validated smart-money structure.

2025 Palantir Q4 Thesis Palantir is demonstrating a break in Market structure as shown over the last few weeks.
Causes:
Dollar Strength is causing the devaluation of All Assets.
Fear of an economic crisis are causing investors to take a risk off approach on Speculative assets which will create a particularly noticeable change in trend on high volatility/volume assets.
Several weeks of consistent short pressure
An abnormally high PE ratio
Hypothesis:
Palantir will range (136-207) until the next earnings call unless major news continues to catalyze growth. Further bullish movement will be dependent on Palantir continuing to grow revenue while maintaining an increased profitability while also increasing revenue. The expectation is that the company will expand so positive earnings will not immediately yield faster growth until the company better justifies its valuation.
Plan
Maintain a small qty of positions options between 136 and 153. Invalidate the plan if a break occurs below 136 on the weekly timeframe.
Duration:
2 Week contracts
Conditions:
Look to sell before Week 2
Sell at or above 153
1 Month Contracts:
Conditions:
Look to sell before Week 2
Sell at or above 153

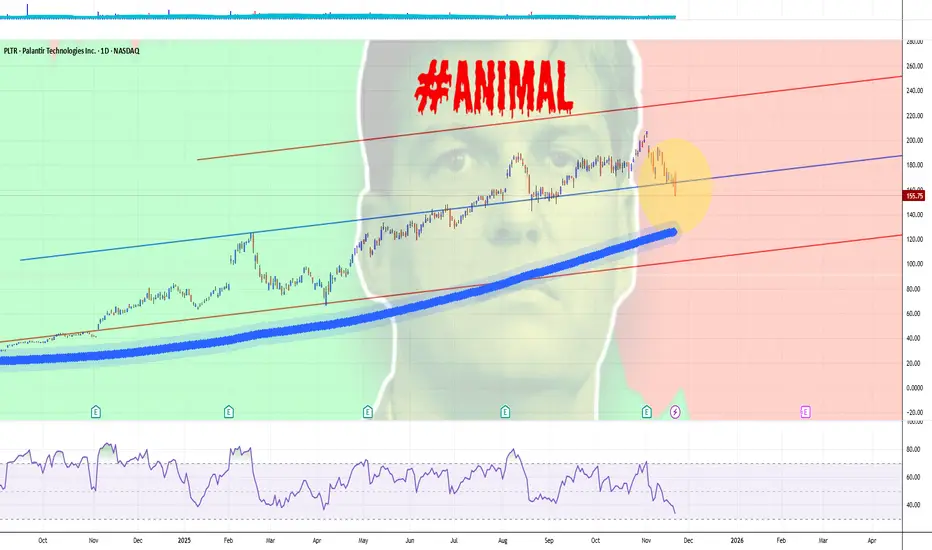
THE BATSHIT ANIMAL SENDS PALANTIR STOCK BELOW ITS MAJOR SUPPORTMichael Burry, known from "The Big Short," recently made a significant bearish bet against Palantir Technologies, placing put options on about 5 million shares valued around $912 million.
This move signifies strong skepticism about Palantir's stock prospects despite the company's robust recent earnings growth. Palantir’s shares dropped about 8% after the disclosure of Burry’s short position, marking one of its worst days in months.
Previously, Burry's Scion Asset Management also took bearish positions on Nvidia, indicating his broader concern about what he perceives as overvalued AI-related stocks benefiting from a market bubble fueled more by momentum than fundamentals.
Palantir had reported a 63% year-on-year revenue increase and a tripled net income, but Burry’s stance suggests he questions the sustainability of this growth amid higher capital costs and potentially overstated future expectations on AI.
Palantir's CEO Alex Karp publicly challenged Burry, dismissing the shorts despite Burry's influence creating nervousness among investors.
Burry’s bearish moves serve as a warning to the market that even AI darlings like Palantir are vulnerable to sharp declines if their elevated valuations and growth prospects fail to meet investor expectations (especially when wild animals are walking there).
The main NASDAQ:PLTR chart points that there's a potential for Bear extension, to $125-150 range.
https://www.tradingview.com/x/RxJay0hf/
--
Best wishes,
@PandorraResearch Team