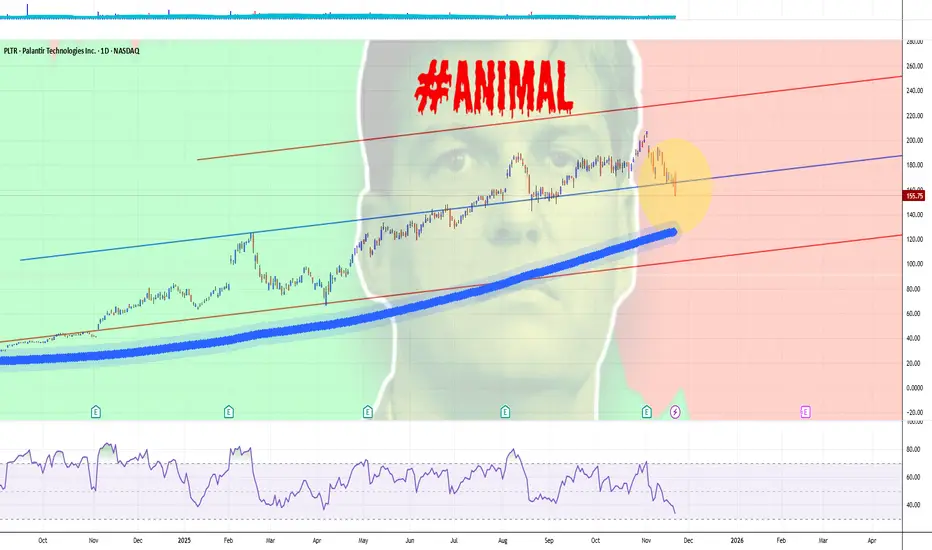
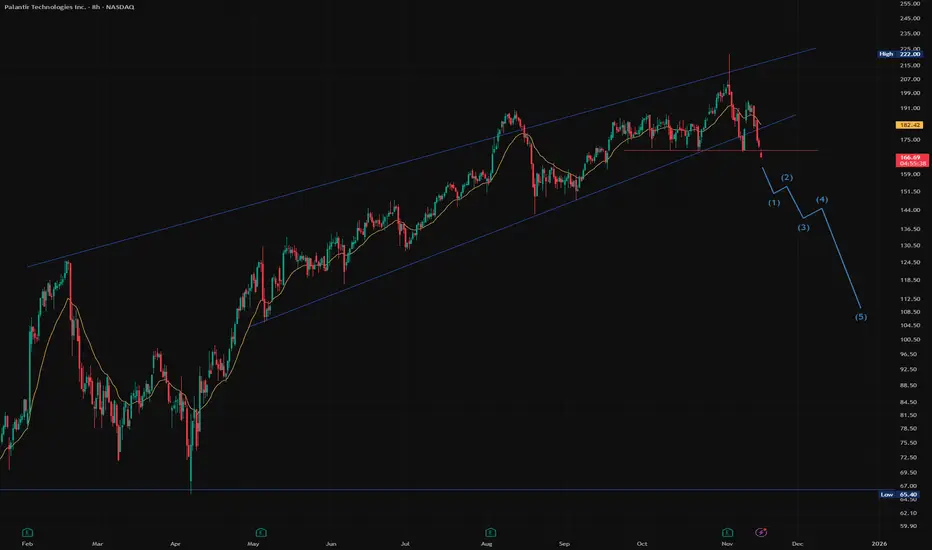
PALANTIR Is there time to reach $250 before Bear Cycle begins?Palantir (PLTR) has been trading within a multi-year Channel Up throughout this Bull Cycle, which despite the recent correction just above the 1W MA200 (orange trend-line), it still stands.
The last time in fact that we had a similar 1W MA200 approach on such a 1D RSI pattern (RSI reaching 34.00) was on January 05 2024. What followed was a 1-month rally to the 1.618 Fibonacci extension.
As a result, if the market delivers a strong 'Santa Rally', we may see Palantir peak at $250.00 before a Bear Cycle begins.
---
** Please LIKE 👍, FOLLOW ✅, SHARE 🙌 and COMMENT ✍ if you enjoy this idea! Also share your ideas and charts in the comments section below! This is best way to keep it relevant, support us, keep the content here free and allow the idea to reach as many people as possible. **
---
💸💸💸💸💸💸
👇 👇 👇 👇 👇 👇
Palantir Technologies Inc. Shs Cert Deposito Arg Repr 0.3333333333 Sh
No trades
Trade ideas

QuantSignals V3: PLTR Weekly Put Play – Strong Bearish Momentum!PLTR Weekly (QuantSignals V3 | 2025-11-24)
Direction: BUY PUTS
Confidence: 60%
Expiry: 2025-11-28 (4 days)
Strike Focus: $148.00
Entry Range: $0.52 – $0.55 (mid: $0.54)
Target 1: $0.85 (≈63% gain)
Target 2: $1.10 (≈100% gain)
Stop Loss: $0.35 (≈35% loss)
Position Size: 2% of portfolio (moderate conviction)
Weekly Momentum: BEARISH (–1.07% 1W)
Put/Call Ratio: 1.01 (Neutral flow bias)
Flow Intel: Neutral, unusual activity at $132 put
Current Price: $162.41
Risk Level: ⚠️ Moderate – elevated VIX (23.43)
📈 Technical Overview
Weekly momentum: BEARISH (–1.07%)
Support: $147.56 (weekly low)
Resistance: $174.57
RSI oversold at 24.0 → continuation possible
MACD histogram confirms downward momentum
Price below session open $170.75 → intraday weakness
Chart Tips:
Draw support at $147.56 and resistance at $174.57
Highlight entry band $0.52–$0.55
Mark targets $0.85 / $1.10 and stop $0.35
Monitor for news that could reverse bearish setup
📰 Fundamental / Sentiment Notes
Mixed news, partnerships announced but selling pressure continues
Institutional positioning suggested by unusual options activity
Katy AI predicts downward target $157.27 → confirms bearish momentum
⚠️ Risk Notes
Katy AI NEUTRAL classification (50% confidence) → conservative sizing
High volatility (VIX 23.43) → premium cost elevated, opportunity exists
4-day expiry → monitor Thursday exit or roll if needed

Palantir Technologies Inc. poised for upside as AI sector momentCurrent Price: $158.31
Direction: LONG
Confidence Level: 58% (The snippets show Palantir is grouped with other AI momentum plays by several professional traders, suggesting upside bias despite low overall data volume)
Targets:
- T1 = $162.00
- T2 = $165.50
Stop Levels:
- S1 = $156.00
- S2 = $154.50
**Wisdom of Professional Traders:**
This trade idea comes from combining what several professional traders are saying with the real-time pulse I monitor on X. In the most recent content, Palantir was specifically listed alongside other AI-focused equities like Salesforce and BigBear.ai as part of a watchlist for buying dips. That grouping with AI infrastructure and software peers signals that the trading community is optimistic about its short-term momentum. Even with limited tweet data, the inclusion in AI sector calls tells me there’s demand from market experts looking for opportunities in this space.
**Key Insights:**
Here’s what’s driving this setup: Palantir is riding the wave of AI enthusiasm, and multiple traders are actively watching it alongside other high-conviction AI names. Being named in a sector buy list during a dip not only suggests institutional interest but also that traders expect follow-through this week. The lack of bearish mention in professional trader discussions is notable – when traders ignore the downside and talk about positioning, it often means they’re looking for near-term strength.
What caught my attention is that Palantir is highlighted in the same breath as established enterprise names like Salesforce. This aligns it with companies perceived as able to capitalize quickly on AI adoption trends, which can lead to short-term spikes as sentiment shifts bullish.
**Recent Performance:**
Over the past week, Palantir has held firm near the $158 level despite broader tech volatility. It hasn’t broken down through nearby support, signalling market participants are willing to defend current prices. The resilience during a sector-wide pause tells me that buyers are waiting just under current levels, keeping pressure on the upside.
**Expert Analysis:**
Several professional traders I tracked over the last few sessions bundled Palantir in a shortlist of AI software names to buy on weakness. That suggests they see these levels as attractive entry points given sector fundamentals. Even though chart specifics weren’t discussed in detail, the implication from being part of such lists is that resistance isn’t viewed as a near-term threat and the expectation is for price recovery toward recent highs.
**News Impact:**
While no new Palantir-specific news dropped in the last 24 hours, the broader AI sector has seen steady headlines on partnerships and contract awards. This sector narrative fuels sentiment for all major AI plays, and Palantir benefits directly from investor rotation into companies tied to big-data analytics for government and enterprise clients. That backdrop supports a short-term bullish bias.
**Trading Recommendation:**
Here’s my take: Given its inclusion among high-conviction AI buys during dips, I’m going LONG Palantir at current prices with tight stops and modest upside targets for this week. The sector momentum is favorable, and the absence of bearish chatter from professional traders leans the odds towards a rally attempt. Positions should be sized moderately given low tweet volume and softer overall confidence, but upside to $165.50 is achievable if AI headlines continue supportive.

Midterm Stock Forecast for PalantirNASDAQ:PLTR at $154 maintains a strong accumulation profile, supporting expectations of a rise toward $200. H1 structure remains bullish with higher lows forming. Fundamentally, expanding government contracts and improving commercial AI adoption justify continued midterm optimism.

WaverVanir Market Intelligence — PLTR UpdatePalantir is showing one of the strongest bifurcations we’ve seen this quarter:
our Institutional ML Forecast Model projects a 63% upside toward $252,
while our SMC + Fibonacci liquidity map outlines a deeper liquidity-seek toward $111 if the current structure breaks down.
This divergence is exactly why VolanX runs multi-framework confirmation instead of relying on a single bias.
VolanX DSS Read — Key Signals
Strong Buy signal from the institutional ML ensemble
Target Range: $252.62 (30-day predictive horizon)
Prediction Volatility: 114.84% — high-velocity environment
Model Agreement: 8 of 9 bullish
Sharpe Ratio (simulation): 1.66
SMC / Fibonacci Structure Read
Price is currently sitting at the 0.886 retracement — a high-reaction zone
Clear CHoCH signaling short-term displacement
If price fails to reclaim equilibrium (~$171–$178 zone),
liquidity magnets sit at:
$133
$124
$111 (1.618 full extension)
Interpretation
Bullish bias from AI models + bearish liquidity structure = compression environment.
Historically, PLTR produces violent expansions after this setup.
VolanX plays these environments with reduced position sizing and event-driven execution until direction resolves.
Outlook
We will update our directional call once the following triggers confirm:
Daily close above equilibrium → bullish continuation
Daily close below $147.56 → liquidity sweep pathway toward $133 / $124
WaverVanir continues to monitor PLTR using both institution-grade AI forecasting and human-validated smart-money structure.

2025 Palantir Q4 Thesis Palantir is demonstrating a break in Market structure as shown over the last few weeks.
Causes:
Dollar Strength is causing the devaluation of All Assets.
Fear of an economic crisis are causing investors to take a risk off approach on Speculative assets which will create a particularly noticeable change in trend on high volatility/volume assets.
Several weeks of consistent short pressure
An abnormally high PE ratio
Hypothesis:
Palantir will range (136-207) until the next earnings call unless major news continues to catalyze growth. Further bullish movement will be dependent on Palantir continuing to grow revenue while maintaining an increased profitability while also increasing revenue. The expectation is that the company will expand so positive earnings will not immediately yield faster growth until the company better justifies its valuation.
Plan
Maintain a small qty of positions options between 136 and 153. Invalidate the plan if a break occurs below 136 on the weekly timeframe.
Duration:
2 Week contracts
Conditions:
Look to sell before Week 2
Sell at or above 153
1 Month Contracts:
Conditions:
Look to sell before Week 2
Sell at or above 153

THE BATSHIT ANIMAL SENDS PALANTIR STOCK BELOW ITS MAJOR SUPPORTMichael Burry, known from "The Big Short," recently made a significant bearish bet against Palantir Technologies, placing put options on about 5 million shares valued around $912 million.
This move signifies strong skepticism about Palantir's stock prospects despite the company's robust recent earnings growth. Palantir’s shares dropped about 8% after the disclosure of Burry’s short position, marking one of its worst days in months.
Previously, Burry's Scion Asset Management also took bearish positions on Nvidia, indicating his broader concern about what he perceives as overvalued AI-related stocks benefiting from a market bubble fueled more by momentum than fundamentals.
Palantir had reported a 63% year-on-year revenue increase and a tripled net income, but Burry’s stance suggests he questions the sustainability of this growth amid higher capital costs and potentially overstated future expectations on AI.
Palantir's CEO Alex Karp publicly challenged Burry, dismissing the shorts despite Burry's influence creating nervousness among investors.
Burry’s bearish moves serve as a warning to the market that even AI darlings like Palantir are vulnerable to sharp declines if their elevated valuations and growth prospects fail to meet investor expectations (especially when wild animals are walking there).
The main NASDAQ:PLTR chart points that there's a potential for Bear extension, to $125-150 range.
https://www.tradingview.com/x/RxJay0hf/
--
Best wishes,
@PandorraResearch Team
PLTR: Trend Analysis 📈 PLTR | SMC Trend Continuation or Reversal? Watch This Key Zone
🔍 Chart Type: 15m
🧠 Strategy: Smart Money Concepts (LuxAlgo), EMA Stack (20/50/100/200)
📊 Volume Surge: 177.99K
🧭 Narrative: Institutional Accumulation + Premium Rejection
🚨 Current Price: $145.88
📍 Market Structure:
Price is currently reacting from a Premium Zone just above a recent Break of Structure (BoS).
We've seen a Chg of Character (ChgofCHoCH) and several bullish BoS confirming smart money intent.
Volume expansion at the highs suggests potential liquidity grab.
📐 Key Levels:
Premium Zone near $146
Equilibrium at ~$143
Discount Zone begins near $140
Strong Edge (deep discount) below $138
Long-term Target remains at $165.11 if bullish channel is respected.
📉 Bearish Scenario:
Break below Equilibrium and retest of Discount Zone = liquidity sweep
Watch if price retraces toward $140.10 (blue line) or lower for a higher-probability long.
📈 Bullish Scenario:
Break above current swing high confirms expansion toward $152+ and eventually $165.11
EMA stack remains bullishly aligned → trending continuation likely unless broken with momentum.
🔎 Institutional Insight:
Smart Money is likely building positions below equilibrium before major continuation. Liquidity pockets between $138–$140 are prime zones for potential long entries.
📆 Watchlist Catalyst:
Earnings cycle or Palantir federal contract news could align with breakout.
🧠 VolanX DSS Rating: BULLISH BIAS
✅ Structure: Bullish
✅ Volume: High
✅ Liquidity: Grabbed above recent highs
⛔ Confirmation: Await premium rejection or retrace to discount
—
🔁 Executed via VolanX Scanner + WaverVanir DSS
📊 Trade the future. Protect the edge. Lead with intelligence.
#WaverVanir #PLTR #SmartMoneyConcepts #VolumeProfile #MarketStructure #TechnicalAnalysis #VolanX #InstitutionalTrading #QuantFinance #TradingEdge #PropTrading

Is the Tesla / Palantir Fractal showing where Tesla goes next?If Tesla follows the Palantir fractal then there may be bearish pressure on Tesla.
What do you think?
May the trends be with you.

Update.155 target from prior post achieved. Price accelerated through the red bullish divergence lines. Got worried with NVDA pump but luckily now that created a very clean price target now. Looking to hit 142 next. White solid lines are showing a negative divergence in RSI vs price.

QuantSignals V3: PLTR Bearish Divergence PUT SetupPLTR QuantSignals V3 – Weekly PUT Trade (2025-11-19)
Trade Signal:
Direction: BUY PUTS (Short)
Strike Price: $165.00
Entry Price: $4.60–$4.65 (mid $4.62)
Target 1: $6.90 (50% gain)
Target 2: $8.32 (80% gain)
Stop Loss: $3.23 (30% risk)
Expiry: 2025-11-21 (2 days)
Position Size: 3% of portfolio
Confidence: 65% (Medium)
Market Analysis:
Trend: NEUTRAL with strong bearish bias on short-term expiry day
Price Action: Current $164.25, down 10.06% intraday
Technicals: EMA BEARISH, RSI 25.6 (oversold), VWAP resistance $172.45, support $161.79
Options Flow: Put/Call Ratio 1.44, institutional put-heavy positioning
Momentum: Weekly -2.52%, 2-week -3.56%, confirming bearish trend
News Sentiment: Positive news failing to lift price; bearish divergence present
Competitive Edge:
Time series shows near-term weakness despite Katy AI neutral summary
High PCR indicates smart money positioning for downside
Mid-week entry maximizes theta decay for short-term puts
Tight stop loss limits downside risk
Risk Notes:
Medium-high risk due to oversold RSI and only 2 days to expiry
High gamma risk – monitor closely, consider exiting early if price holds above support
Low conviction trade; smaller position size recommended
Strategy Rationale:
Combines strong bearish technical momentum, bearish options flow, and price-news divergence for a high-probability put setup
Pre-expiry positioning captures rapid time decay potential while mitigating risk with tight stop

155 targetIf price breaks the prior low (solid yellow line) target of 155.00 in play. Expect price to accelerate downward when RSI passes the bullish divergence line.

Tesla / Palantir FRACTAL - STILL following for weeks now.So why focus on fractals? I'm driving a point home and I hope you get it. These Tesla/ Palantir "fractal" charts should trigger questions like, "how is it possible for these 2 random assets to basically have the same price action (at the same time) over a 5 week period (on a 15 minute time frame & the 1 day"?
Or better yet, you may ask yourself, "how was I able to spot this fractal, weeks ago AND anticipate they would track so closely"?
"How can this be used in trading"?
Yet the most important question one can ask is, "what else have I not been seeing"?
So many of you have been reaching out to me, asking me how am I so accurate? Yet they don't schedule the 30 min FREE consult I offer in my description. They claim they don't want to learn TA (or pay for education), they just want me to briefly summarize my life's work for them so they don't have to do ANY of the work (or pay for it). That's Intellectual Property Theft and I can't give that magic shortcut cheat code, that so many desperately seek. What I can offer is an answer to "how am I so Accurate".
I studied my ass off, as if I had just discovered gold. In the process, I developed an eye for broad based "pattern recognition" & a mind for "tracking historical data/statistical analysis". I put in the work. MOST importantly, I also had/have a willingness to study, which sadly most of you will not. There is no short cut for learning TA! No magic indicator, no "free lunch" for the impatient. Learn. Grow. Learn more.
"Achieving mastery in a skill requires about 10,000 hours of deliberate practice"
-Malcolm Gladwell
PLTR Technical Analysis (Daily Chart)In your chart, PLTR is trading inside a well-defined ascending channel.
Right now, the price is sitting exactly on the lower boundary of the channel, close to the 50-day moving average (SMA50) — a major decision zone.
This area typically determines whether the market will:
Bounce toward the top of the channel,
or
Break down into a deeper correction.
Bullish Scenario (Bounce from channel support)
If PLTR holds support around $165–170 and prints a bullish reversal candle:
Upside Targets
1. $185 – first resistance / SMA50
2. $205 – mid-channel resistance
3. $225–230 – top of the ascending channel
Bullish Stop-Loss
Below $158
(A confirmed breakdown of the channel support)
Bearish Scenario (Breakdown below channel)
If the price closes below $158, the ascending channel breaks and a broader correction begins.
Downside Targets
1. $145 – first major support
2. $125 – next historical support
3. $105–110 – deeper correction / long-term support
Bearish Stop-Loss
Above $172
(In case of a failed breakdown and retest)
Quick Summary
• PLTR is at a major inflection point.
• As long as the channel bottom holds, the trend remains bullish.
• A confirmed breakdown = start of a larger correction.

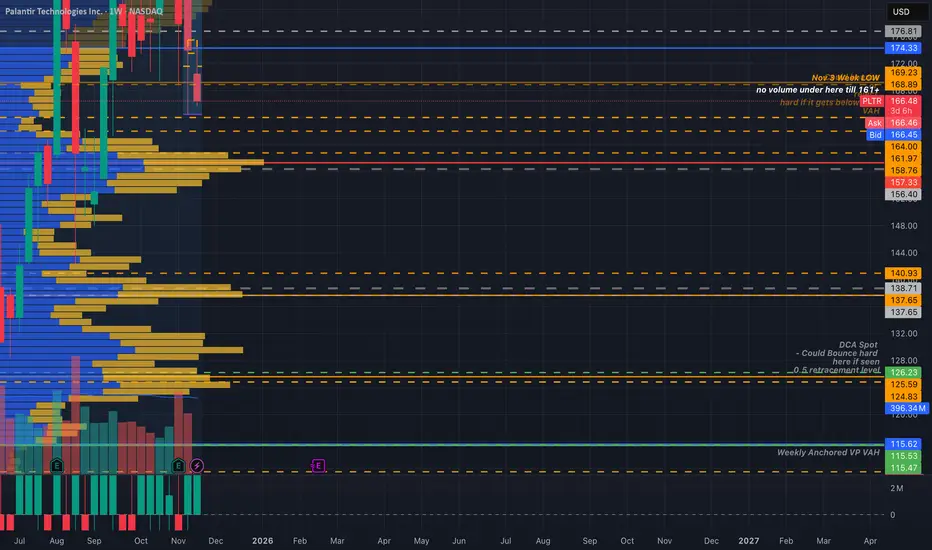
Huntin Wabbits 2.0 - The Doc Sees What's UpPalantir is coming into that death zone if the market doesn't see a recovery soon. If seen, the PA at 161-157(VPOC) will let us know if we dip to $126-$124 again.
Taking a look at this weekly volume profile, the most value for buyers would be at the $115 area.
I'd sell my wife and kids to buy that dip. Jk, I'm single ladies ;).
If price falls and is maintained below the VPOC this simply means that sellers have taken control. Continuation below there and the stock gets Burry'd.
PLTR USPalantir: Rocket Growth vs. Sky-High Valuation. Which Will Outweigh the Other?
The quarterly results are very strong, but investors face significant risks. Let's break it down.
🚀 Strengths:
Explosive revenue: $1.18 billion (+63% YoY), EPS: $0.21. Both metrics beat expectations.
Brighter-than-expected future: Q4 guidance ($1.33 billion) and 2025 guidance (~$4.4 billion) are significantly higher than consensus.
Commercial: 121% YoY growth in the US. This is the company's main driver.
Sales are strong: Closed contracts worth $2.8 billion. The client base grew to 911 companies (+45%).
Super-efficient: Revenue +63%, while headcount is only up 10%. An operating margin of 51% is fantastic.
AI is the fuel: Products like AIP are accelerating adoption, and customers are switching en masse to the Palantir platform.
⚠️ What's scary: Risks and "buts"
The price is sky-high: A P/S ratio of over 110 is nonsense, even for a growing company. Market cap is growing faster than revenue.
The model predicts a collapse: Under optimistic scenarios (40% annual growth), the fair price could be tens of percent lower than the current one.
Share dilution: Share-based compensation (SBC) eats up 24% of revenue—a huge amount. Insiders are actively selling.
Shorted a billion: The legendary Michael Burry bought put options on 5 million shares, betting against PLTR. He believes the AI sector is inflating.
Vulnerability: Business is concentrated in the US, creating regulatory and macro risks. Europe is experiencing stagnation.

Palantir reversal underway.Here is the #PLTR chart compared to Silver.
We can observe a softness in this ratio.
This has formed a minor head and shoulders pattern, initiating a downward trend.
In the end, I truly believe that the significant inverse head and shoulders breakout is probably going to be tested.
Michael Burry's puts might very well yield substantial returns as a lot of the AI trade experiences a retracement or backing and filling following some massive upward movements.

PLTR Weekly Bounce Alert — Don’t Miss This AI SignalPLTR QuantSignals V3 Weekly 2025-11-14
Ticker: PLTR
Current Price: $165.24
Trend: Mixed / Oversold
Confidence: 60%
Expiry: 2025-11-21 (7D)
Strike: $165.00
📈 AI & Technical Forecast
Katy AI Target: $187.16 (+13.3% upside)
Detailed Time-Series: Uptrend toward $190+ by mid-week
RSI: 9.9 → deeply oversold, strong mean-reversion potential
Weekly Range Position: 2.8% → near capitulation
EMA / MACD: Bearish alignment → but sets up rebound opportunity
Insights:
Contrarian setup: heavy institutional put accumulation (PCR 3.12) signals potential upside squeeze
Mixed news: CEO bullish commentary vs. defensive sentiment from hedge fund activity
Low volume (0.1× average) → price may move sharply on small flows
🎯 Trade Setup
Parameter Value
Direction CALL
Strike $165.00
Entry $10.96
Target 1 $16.40 (+49.6%)
Stop Loss $7.65 (–30.3%)
Expiry 2025-11-21
Position Size Moderate (consider 2–3% portfolio)
⚡ Key Advantages
Oversold RSI + AI bullish trajectory → potential rebound squeeze
Contrarian against institutional put-heavy positioning
Deep ITM strike limits extrinsic decay and provides high delta exposure
Timing Edge:
Friday expiration allows discount on premium ahead of expected mid-week momentum
Potential upside acceleration if put-heavy positions unwind
🚨 Risk Notes
Expiration week → elevated gamma and theta risk
Low liquidity and volume → choppy price action possible
Stop loss should be strictly followed due to high-risk setup
Conflicting market signals → manage position size carefully
Summary
PLTR weekly call offers medium-conviction, contrarian upside potential, combining AI bullish trajectory, oversold RSI, and institutional positioning for a 7-day horizon.

PLTR long daily gap playI already entered too early.
Maybe new entry at the daily gap. would cut the trade when we close below the gap.

$PLTR The short of the year?Update NASDAQ:PLTR
I am still heavily short.
Palantir has spent all of 2025 inside a bull channel. I see bull channels as bear flags because they behave exactly the same.
Now we’ve broken the channel in the pre market and taken out a 5-touch support level. That’s a major structural failure.
Nothing is guaranteed in trading, but it’s hard to find a cleaner setup than this. Risk/reward is exceptional.
A Risk of Deeper Pullback in PLTRThe trend on daily/time-short frames is weak, momentum is bearish, the chart shows a likely distribution phase entering mark-down.
Its Longer term trend is still positive but fading.
I’d lean bearish to neutral in the near‐term with a risk of deeper pullback .
PLTR - wave [4]PLTR completed the wave at $207.52.
The current decline is probably a wave .
In terms of duration, this wave may be proportional to wave , that is ~ 2 years.
So I expect the end of the wave in October 2027.
