PLTR Profit target or shortlast short didnt work out. it held the level and continued after trading sideways for a few weeks. i would like to see it react off this yearly level.
Palantir Technologies Inc. Shs Cert Deposito Arg Repr 0.3333333333 Sh
No trades
Trade ideas

Palantir Technologies (PLTR) Shares Plunge Below $150Palantir Technologies (PLTR) Shares Plunge Below $150
Shares of Palantir Technologies (PLTR), a company specialising in big data analytics software, delivered an unpleasant surprise to investors:
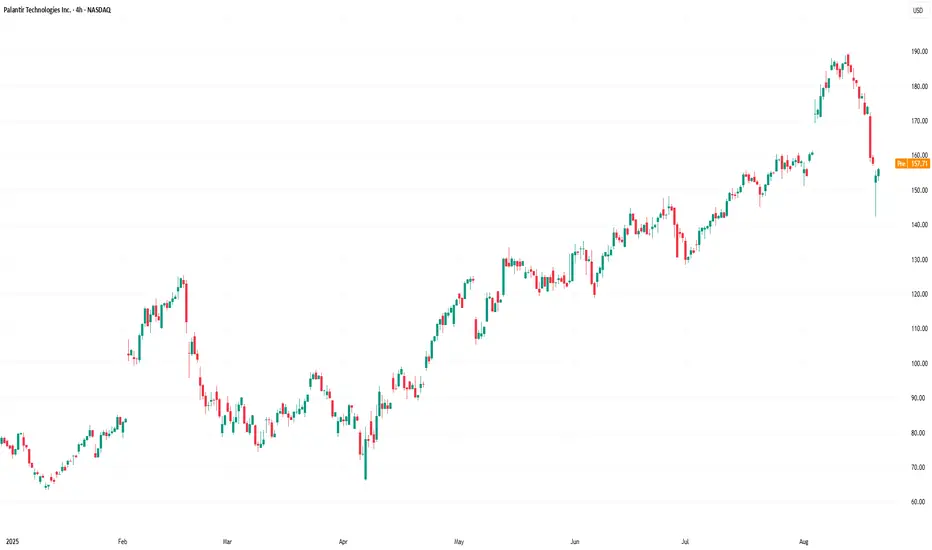
→ just last week, the stock was trading at its all-time high of around $190;
→ yesterday, the price collapsed below $150. At yesterday’s intraday low, PLTR stock had dropped almost 25% from its record peak.
Why Did Palantir Technologies (PLTR) Stock Fall?
Bearish sentiment may have been driven by:
→ capital rotation from risk assets into so-called defensive stocks ahead of the Federal Reserve Chair’s speech at the Jackson Hole Symposium (as we reported yesterday);
→ growing speculation that a “bubble” is forming in the technology sector, which could burst.
According to Investor’s Business Daily, Andrew Left, founder of Citron Research, bet on downside in PLTR, arguing that the stock is severely overvalued following its phenomenal 340% rally in 2024.
Technical Analysis of Palantir Technologies (PLTR) Stock
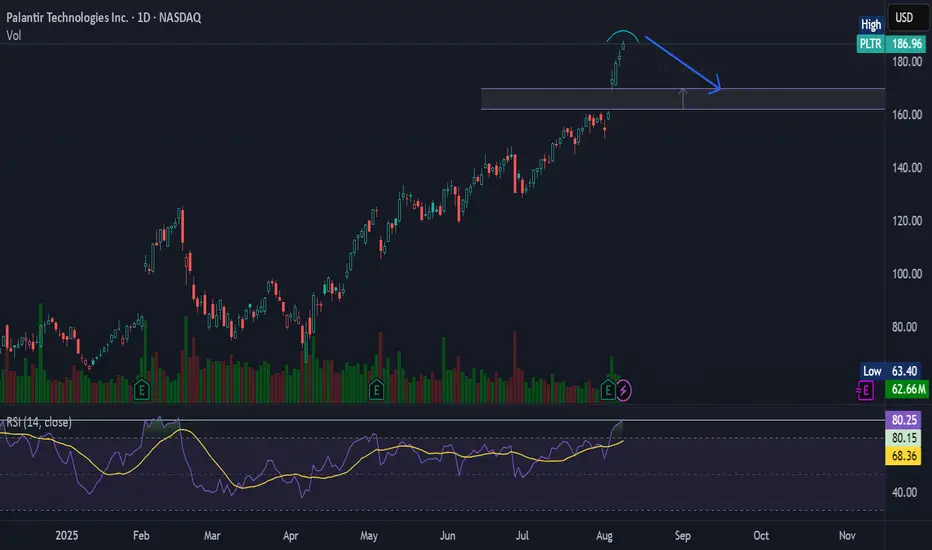
In our previous analysis of PLTR’s price action, we:
→ identified an ascending channel (shown in blue);
→ suggested that the upcoming earnings release would push the stock towards the upper boundary of this blue channel.
Indeed, the strong earnings report on 5 August acted as a catalyst for the surge (breaking through resistance at $160, as indicated by the arrow) towards the channel’s upper boundary. However, the optimism stemming from these fundamentals was swiftly and completely erased – a highly significant bearish signal.
That said, the bulls still have valid reasons to remain hopeful, as the price:
→ staged a false bearish breakout below the key $145 level, which had previously acted as resistance (and has now flipped into support);
→ closed yesterday’s volatile session above its opening price (forming a dragonfly doji on the daily chart);
→ thus, the blue channel remains valid, with demand showing signs of aggression.
We can assume that the market has undergone a stress test and, after the volatility spike, the price has returned to the prevailing ascending channel, maintaining the uptrend. If so, the bulls will need to prove their resolve by overcoming key resistance levels at $160 and $170 (these mark not only the gap boundaries but also psychological barriers). If successful, PLTR’s price could advance towards the channel’s median line.
This article represents the opinion of the Companies operating under the FXOpen brand only. It is not to be construed as an offer, solicitation, or recommendation with respect to products and services provided by the Companies operating under the FXOpen brand, nor is it to be considered financial advice.
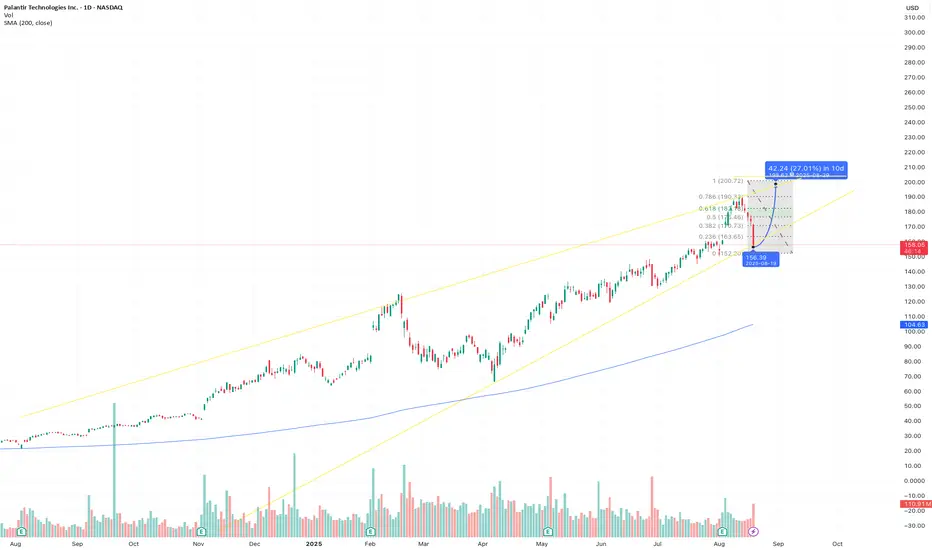
PALANTIR Stock Chart Fibonacci Analysis 082025Trading Idea
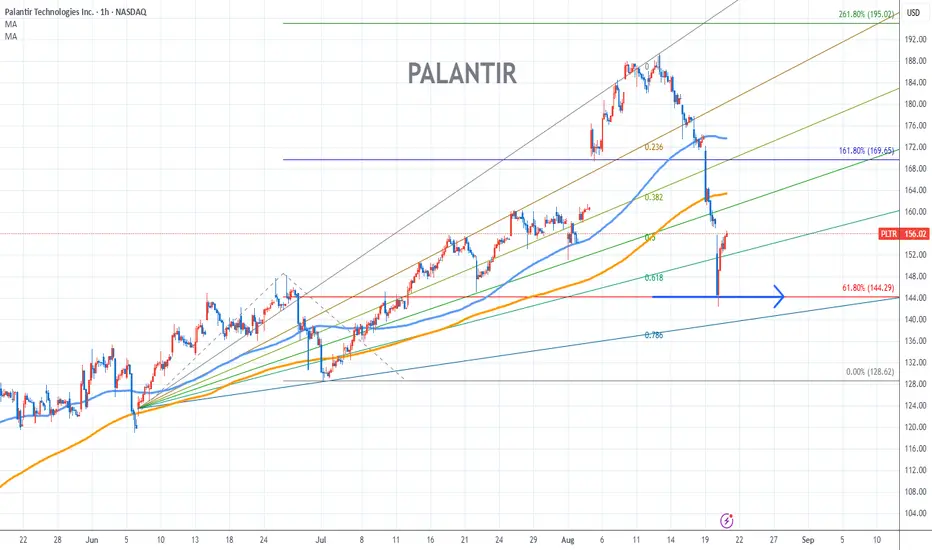
1) Find a FIBO slingshot
2) Check FIBO 61.80% level
3) Entry Point > 144/61.80%
Chart time frame:B
A) 15 min(1W-3M)
B) 1 hr(3M-6M)
C) 4 hr(6M-1year)
D) 1 day(1-3years)
Stock progress:C
A) Keep rising over 61.80% resistance
B) 61.80% resistance
C) 61.80% support
D) Hit the bottom
E) Hit the top
Stocks rise as they rise from support and fall from resistance. Our goal is to find a low support point and enter. It can be referred to as buying at the pullback point. The pullback point can be found with a Fibonacci extension of 61.80%. This is a step to find entry level. 1) Find a triangle (Fibonacci Speed Fan Line) that connects the high (resistance) and low (support) points of the stock in progress, where it is continuously expressed as a Slingshot, 2) and create a Fibonacci extension level for the first rising wave from the start point of slingshot pattern.
When the current price goes over 61.80% level , that can be a good entry point, especially if the SMA 100 and 200 curves are gathered together at 61.80%, it is a very good entry point.
As a great help, tradingview provides these Fibonacci speed fan lines and extension levels with ease. So if you use the Fibonacci fan line, the extension level, and the SMA 100/200 curve well, you can find an entry point for the stock market. At least you have to enter at this low point to avoid trading failure, and if you are skilled at entering this low point, with fibonacci6180 technique, your reading skill to chart will be greatly improved.
If you want to do day trading, please set the time frame to 5 minutes or 15 minutes, and you will see many of the low point of rising stocks.
If you want to prefer long term range trading, you can set the time frame to 1 hr or 1 day
PLTR: Temporal Patterns🏛️ Research Notes
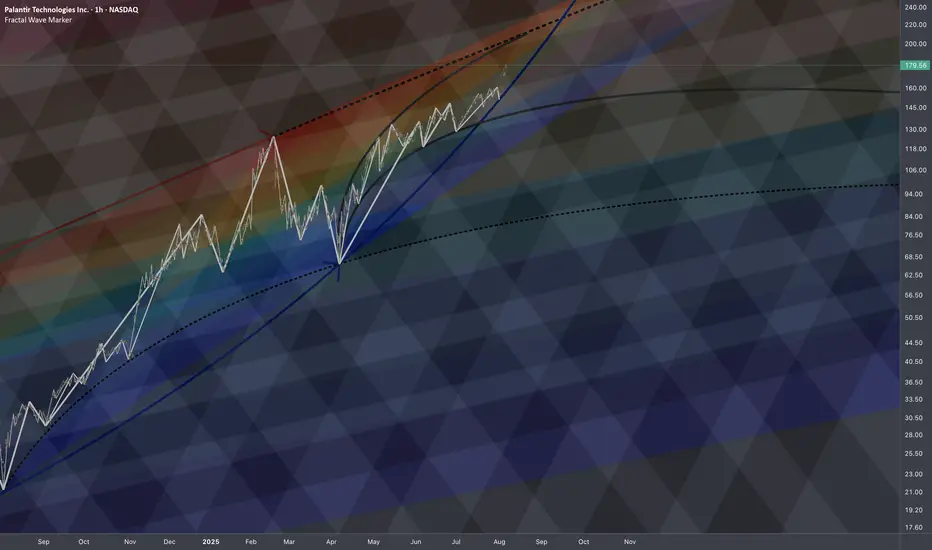
The fact that price touched and reflected up from the curve that mimics exponential growth, forced me to focus on the precursors that could explain the geometry of such decisive move.
Let's strip the chart and document how exactly chronological chain of human emotions were progressing across vast cycles.
Essentially, the composite sub-cycles patterns are the same but stretched towards denser probability point. It's not just percentages that matter, but how it was structured on the way down. Evidently that was enough to trigger exponential growth. (BTW, since that super-bottom price is up 2950%)
So, that force made the time tick differently in the following bigger cycle. Manifests in frequency of reversals of sub-waves and changing scaling laws.
Particular parts of large curves with gradient of last reaction move can be connected to further express how two forces push the price toward some mutual angle.
Publishing interactive chart as low as 1h TF to observe in details.
PLTR SELL ++++$129 first "major" support, way overvalued anywhere over $20 but have at it! Several sell signals on ichimoku cloud MA cross at cloud support first support to maintain the uptrend is at $129

PLTR Bear Play! $145 Put Poised for Big Weekly Move!
# ⚡ PLTR Weekly Put Play – \$145 Strike for 50-100% Gains 💹🔥
### 🔎 Quick Market Snapshot
* **📉 Daily RSI:** 33.8 → Oversold & accelerating downward momentum
* **📊 Weekly RSI:** 56.8 → Falling, weakening bullish momentum
* **💵 Price Action:** -15.65% drop, bearish engulfing pattern
* **📈 Volume:** 1.5x previous week → Institutional selling confirmed
* **📊 Options Flow:** Call/Put ratio 1.00, but heavy put volume @ key strikes
* **🌡️ VIX:** 15.8 → Low volatility environment, ideal for directional trading
---
### 🎯 Trade Setup (High Conviction Put Play)
* **Ticker:** PLTR
* **Direction:** 📉 PUT
* **Strike:** \$145.00
* **Entry Price:** \$1.70
* **Profit Target:** \$2.52 (50% gain), secondary \$3.36 (100% gain)
* **Stop Loss:** \$0.84 (50% of premium)
* **Expiry:** 2025-08-22
* **Confidence:** 🟢 75% Bearish
* **Timing:** Enter **market open Thursday**
---
### 📝 Trade Thesis
Strong institutional selling + oversold technicals + bearish price action = **high-probability short-term put trade**.
⚡ **Play: \$145 Put targeting 50-100% gains before Friday expiration.**

Palantir - The unstoppable company!💣Palantir ( NASDAQ:PLTR ) is just too strong:
🔎Analysis summary:
Since mid 2022, Palantir managed to rally more than 2.500%, creating new all time highs every single month. Eventually this rally will slow down, but before this happens, Palantir could rally another +100%. This is a classic example of stock market behaviour and you should take advantage.
📝Levels to watch:
$200
SwingTraderPhil
SwingTrading.Simplified. | Investing.Simplified. | #LONGTERMVISION

PLTR Markets Overreacting? Hidden bullish RSI divergence on the weekly PLTR chart forming as investors react strongly to recent company criticisms and the upcoming Jackson Hole conference.
This feels more like knee-jerk panic selling than a genuine change in sentiment, but we'll have to see if this is true.
If the previous PA is anything to go by, we may see prices quickly reverse. There, we can see price gapped up significantly before retracing again, leaving a hidden bullish RSI divergence on the weekly that led to a sharp reversal (minus the April Trump tariff shakedown)
I'll be interested to see how this one plays out. A dovish Fed this week would also certainly help the situation, and this next move may hinge almost entirely on that outcome.

PALANTIR is dropping but below the 1D MA50 lies the best BUYLast time we looked at Palantir (PLTR) was almost 4 months ago (May 06, see chart below), giving a buy signal that gradually but surely hit our $185 Target:
This time, the stock has found itself on a short-term pull-back that is about to hits its 1D MA50 (blue trend-line) for the first time since April 21 (4 months). This is far from alarming as the strongest buy signal within its long-term (since February 2023) Channel Up, has been below the 1D MA50.
At the same time, the 3-year RSI Buy Zone (40.00 - 30.00) is also close to being tested, so once it does, we will technically get the most optimal buy confirmation.
Even though another 183% rise from the potential bottom is possible, we will pursue a more modest Target this time, especially as we get close to the end of the year (and potentially the Cycle).
The minimum rise the market has delivered upon a 1D MA50 break has been +58.11%. As a result, our Target will be $220.00.
-------------------------------------------------------------------------------
** Please LIKE 👍, FOLLOW ✅, SHARE 🙌 and COMMENT ✍ if you enjoy this idea! Also share your ideas and charts in the comments section below! This is best way to keep it relevant, support us, keep the content here free and allow the idea to reach as many people as possible. **
-------------------------------------------------------------------------------
💸💸💸💸💸💸
👇 👇 👇 👇 👇 👇

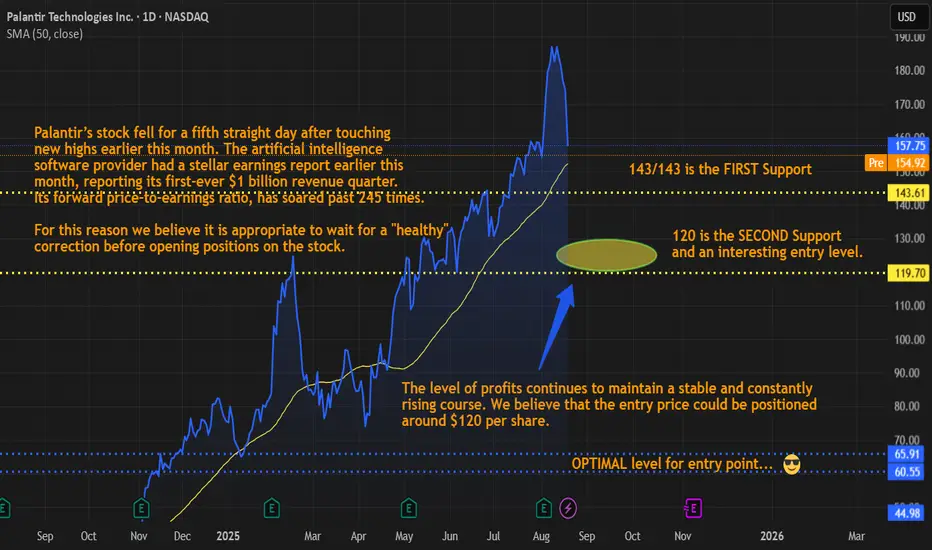
Palantir Technologies Inc (PLTR)Its forward P/E Ratio is at 245, wait for a healty correction before opening positions.
PLTR to get back to 200 by October 2025From the trend lines and support it appears like the next move up is very likely to go beyond 190 to 200 range. The support for 157.4 is strong. The close today may give clear signal for going up.
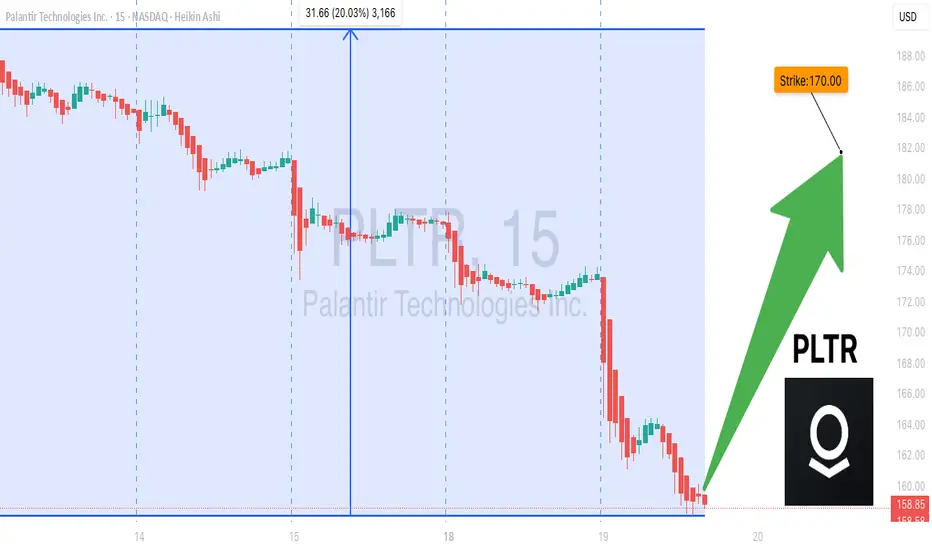
PLTR CALL 170C —Don't Miss it
🚀 **PLTR Weekly CALL Alert!** 🚀
Momentum building 📈 | RSI rising | Favorable volatility ⚡
🎯 **Strike:** \$170 CALL
💵 **Entry:** 0.70 | 🎯 **Target:** 1.40 | 🛑 **Stop:** 0.35
📅 **Expiry:** Aug 19 | ⏰ **Entry:** Open
⚡ **Confidence:** 70%
Bulls in control + rising RSI = upside potential 💥📊
\#PLTR #OptionsTrading #WeeklyCalls #BullishMomentum #SwingTrade #TradeSetup #VIX #TechStocks
PLTR still bullish - Cup n Handle patternPLTR in Cup and handle pattern, broke out.
The price closed on Friday is $131.78 (05.30.2025).
Desired entry price $127.88.
Target $147.58/ 164.99/ 183.41.
Stop loss $119.41.
IMO.

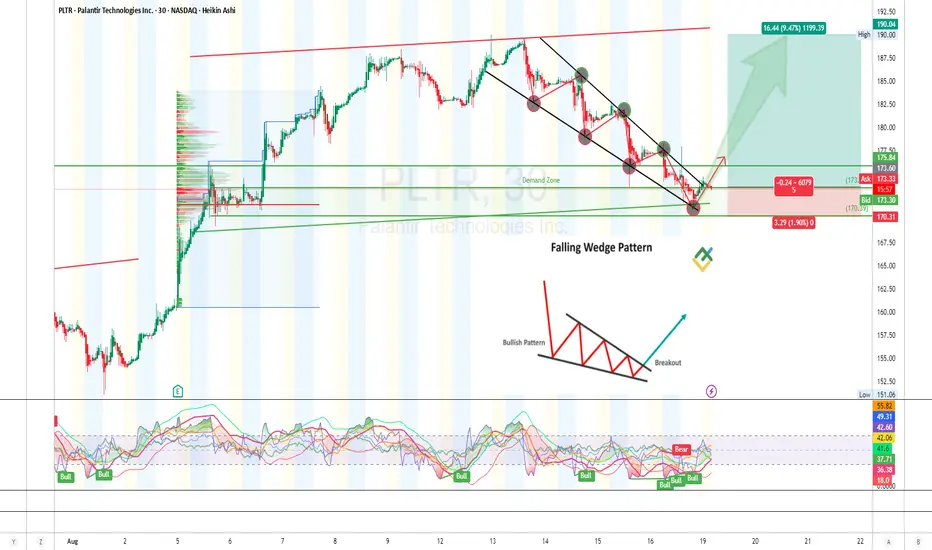
Palantir (PLTR) 30-min chart "Potential falling wedge" - Long.PLTR ripped up hard in early August, forming a solid base and a steep uptrend, which has now corrected into a **clean descending channel**.
Price is now reacting off a key **Demand Zone**
The move down formed a corrective structure with potential **ending diagonal / falling wedge**, signaling a possible end to the corrective wave.
**Key Zones**
**Demand Zone:**
**\$170.31 – \$173.50**
* Price has bounced here multiple times.
* Confluence with ascending trendline.
* High volume node on VPVR = solid support.
**Supply Zone (Target Area):**
**\$190.00 – \$192.50**
* Previous high & price memory.
* Strong overhead resistance for profit-taking.
**RSI Divergence**
**bullish** divergences observed on the RSI
* While price was making lower lows, RSI indicators were making **higher lows**.
* This confirms **bullish momentum shift**. Great sign of hidden strength!
Long Setup
🎯 **Entry:**
* Market entry around **\$173.60**
🛑 **Stop Loss:**
* Just below demand zone & trendline
**\$170.31**
🎯 **Target:**
**\$190.00**
**Risk/Reward:**
* RR: **\~5.0**
* Risk: **\$3.29** per share
* Reward: **\$16.44** per share
**Risk Management**
* **Max risk: 1–3%** of total trading capital.
* Consider **reducing position size** if trading multiple assets.
* Ideal position size should match account size and stop loss to stay within defined % risk.
**Trade Management Tips**
* **Move SL to Break Even** once RR hits 1:1.
* Monitor for strong rejection at \$182–185 area (midway supply).
* Consider **scaling out 50%** of position at \$182, letting the rest run to \$190.
“Be fearful when others are greedy, and greedy when others are fearful.” – Warren Buffett
⚠️ **Disclaimer**
This analysis is for **educational purposes only** and does **not constitute financial advice**. Always do your own research and manage your risk responsibly.
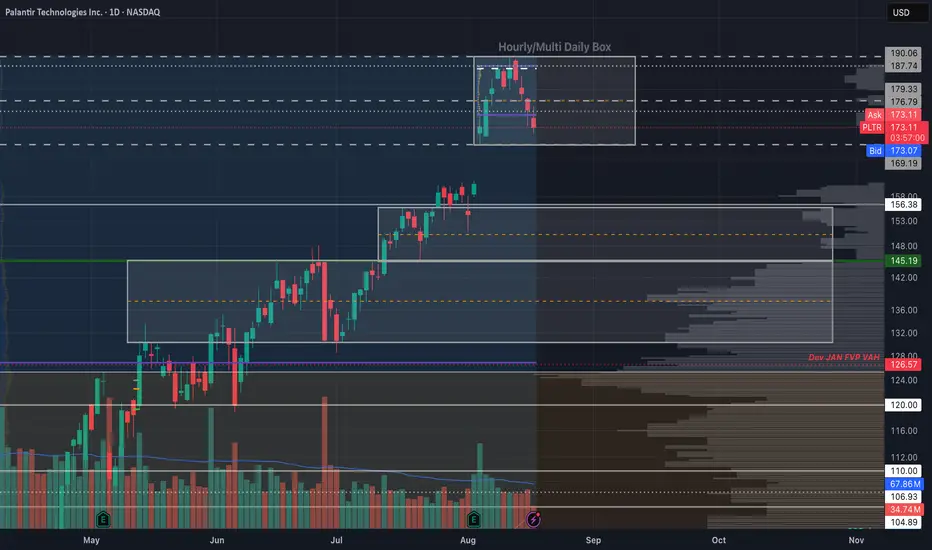
Palantir - The Box Calls The ShotsI recently posted a palatir chart with clean levels of where I'd look to DCA. While those dip-buy levels can easily be used to trade the name, I think it would also help to be mindful of the box ranges as we trade into them. As you'll see, Palantir loves to play with box as much as I do.
If you are familiar with how to trade box set-ups, you can take advantage immediately; otherwise, you may want to do some research on how to trade these.
~The Villain
looking for a push up on pltr but needs to break temp resistancelooking for a push up on pltr but needs to break temp resistance

PLTR still up... 167 perhaps?i know i know i know... this stock is riding high to the moon.
flipped this week back to the earnings push. let's see if we get continuation into 167-165. The wick on Friday's (8/15) candle says let's bounce. So watch that.
160 was former resistance. If we get there 1st, we can bounce. Can look for puts back below if that makes your feel safer.

Short PLTR as it's time for a pullbackExtremely High Valuation: Palantir's stock has soared, and it's now trading at over 200 times its forward earnings. Such a high valuation can be hard to sustain, making the stock vulnerable to a correction.
The stock is up 28% in the last month. It is up close to 600% in the last year.
Even though Palantir has good profit margins that may grow even more in the coming years, there is only so much margin expansion you can achieve.
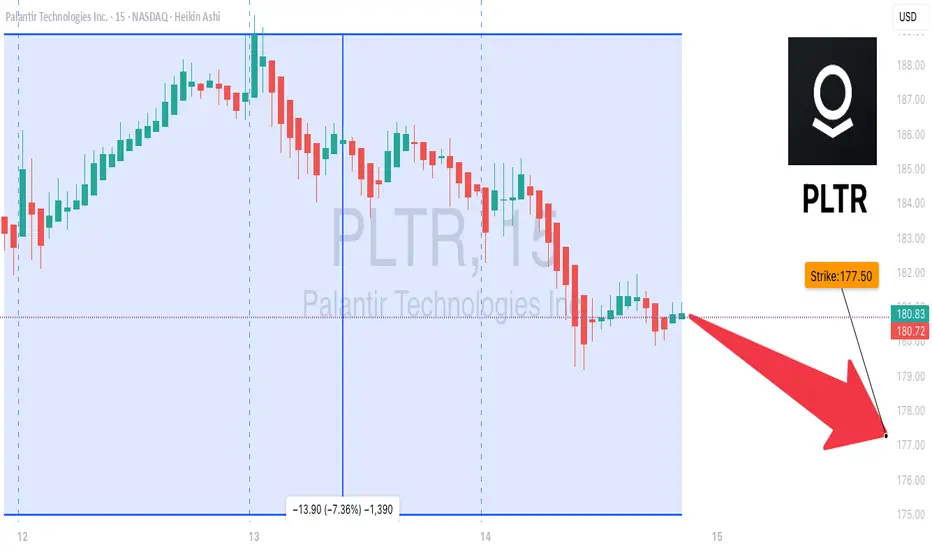
PLTR Gamma Risk High – Is This the Perfect Time for Puts? 📉 PLTR One-Day Put Play – Failed Breakout Turns Bearish
**Sentiment:** 🔻 *Bearish to Neutral*
* **Daily RSI:** 72.7 ⬇️ (falling from overbought)
* **Weekly RSI:** 83.0 ⬇️ (weakening momentum)
* **Volume:** 0.8× last week → low institutional conviction
* **C/P Ratio:** 1.05 (neutral flow)
* **Gamma Risk:** HIGH — expiry in 1 day
* **Time Decay:** Accelerating ⚠️
---
### 📊 **Consensus Snapshot**
✅ All models agree momentum is fading
✅ Weak volume + falling RSI = bearish bias
⚠️ Gamma risk means tight stop-loss & active monitoring
---
### 🎯 **Trade Setup**
* **Type:** PUT (Short)
* **Strike:** \$177.50
* **Expiry:** 2025-08-15
* **Entry:** \$0.69
* **Profit Target:** \$1.00 (+45%)
* **Stop Loss:** \$0.35 (–50%)
* **Confidence:** 70%
* **Entry Timing:** Market open
---
💬 *This is a 24-hour bearish momentum play — watch price action closely.*
📌 *Not financial advice. DYOR.*
---
**#PLTR #OptionsTrading #PutOptions #TradingSignals #GammaRisk #StocksToWatch #DayTrading #OptionsFlow**
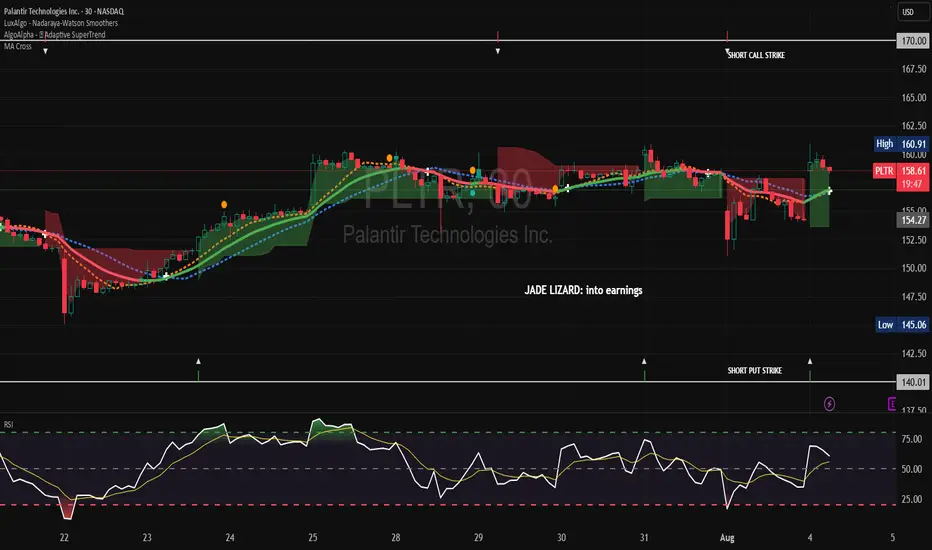
A Jade Lizard Play for Earnings (4-dte) on PLTR.
This is 4-DTE with a wide $140 short Put and $170 Short Call spread.
A slightly bullish strategy combining an out-of-the-money short put and out-of-the-money bear call spread. When created properly, this strategy has no upside risk. It is best suited for oversold stocks with high implied volatility.
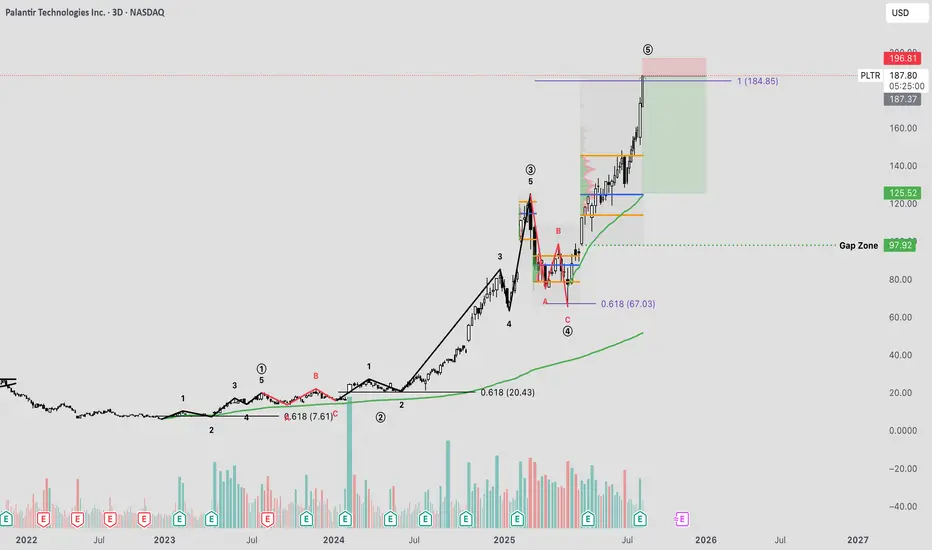
PLTR Elliot Wave Short Trade IdeaPalantir has experienced a remarkable rally since its April lows, surging to its current price levels. Throughout this uptrend, I’ve been analyzing the movement through the lens of Elliott Wave Theory. Given the stock’s relatively limited price history, the wave structure has been notably straightforward and discernible.
We’ve decisively broken through several key price zones as the stock appears to be approaching the culmination of a fifth wave, with a projected target around the $185–$186 range. Based on my analysis, this level may act as a potential area for profit-taking, potentially triggering a retracement toward the Point of Control (POC)—the price range that has seen the highest volume during this ascent.
If such a pullback does occur, it could serve as an effective hedge for those who have realized significant gains during this impressive rally.
PLTR: The Top Is INPLTR has reached my top as stated in a previous post. This post is simply to show fib retracement levels to show how I came to this conclusion. As seen in the circles labeled, PLTR has given clues along the way by hitting these fib retracement, either as resistance or support. The next target for PLTR is $161 in the next week or two.

PLTR – TA + GEX Confluence for August 13, 202530-Minute Price Action
PLTR broke out of a short-term downtrend channel and is now testing the $188.45 resistance zone.
* Resistance: $188.45 – key breakout level; aligns with recent highs before pullbacks.
* Support: $182.68 – breakout retest level; $181.97 – secondary support.
* Indicators:
* MACD shows strong bullish momentum after crossover, though starting to flatten.
* Stoch RSI cooling off from overbought, indicating possible consolidation before next leg.
1-Hour GEX Insights
* Highest Positive NET GEX / Gamma Wall: $188.66 – major upside resistance.
* Next Call Walls Above: $190 (strong GEX concentration) and $192.5–$195 (layered gamma resistance).
* Put Support: $180 (GEX support floor), $172.5 (secondary defense), $170 (major downside floor).
* IVR: 9.3 – relatively low implied volatility rank, making long options affordable.
TA + GEX Combined Read
The 30m breakout toward $188.45 lines up with the largest GEX wall at $188.66 on the 1h chart.
* A break above $188.66 could quickly fuel momentum toward $190 and $192.5 on gamma hedging flows.
* Failure to hold above $188 could see a retest of $182.68 and possibly $180, where GEX provides strong support.
Trading Scenarios for August 13
* Bullish Breakout: Long calls or debit spreads above $189 targeting $190–$192.5.
* Bearish Rejection: Puts or put spreads if $188.66 rejects and $182.68 breaks, targeting $180.
* Neutral Play: If price stays between $182–$189, short premium strategies could work given low IVR, but manage risk for breakout moves.
Reasoning
The 30m breakout and retest structure aligns with the 1h GEX’s largest resistance level. Tomorrow’s trading will likely hinge on $188.66 — a confirmed break could trigger gamma-fueled upside, while rejection keeps PLTR in consolidation or sends it back to key GEX support zones.
Disclaimer: This analysis is for educational purposes only and does not constitute financial advice. Always do your own research and manage risk appropriately before trading.
