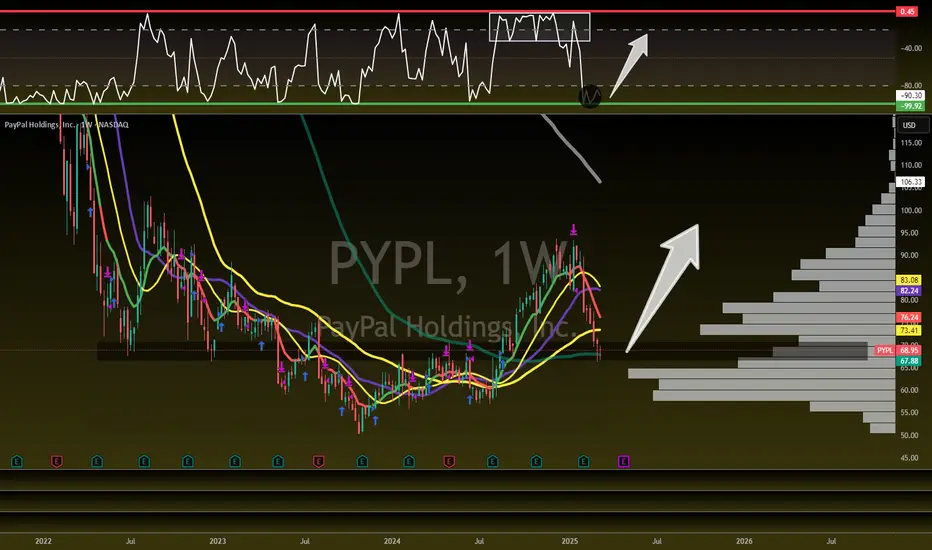
Indicators that Warn of a Top or Bottom Before It HappensHybrid Leading Indicators use all 3 data sets from each transaction that occurs in the stock market. Today this lesson talks about Chaikin Oscillator and Chaikin MFI. Both are used on the same chart as the volume oscillator reveals the volume and price correlation to what the Dark Pool Buy Side institutions are buying or selling for long term holds. The oscillator also shows pro trader activity and indicates with a spike to the top or bottom of its chart a probable reversal of the trend the next day. When the Oscillator spikes to the top, then a profit taking day by pros or a run down is likely the next day.
When the oscillator hits a V shape at the bottom of the chart, the stock price is likely to move up the next day, warning those selling short to exit quickly. The oscillator also shows topping price and volume changes before the Flat Top forms. It also shows Bottoming development before the recent rebound in $NASDAQ:PYPL.
Money Flowing into or out of a stock is also a critical analysis for swing traders as it confirm whether you should continue swing trading to the upside OR if you should switch quickly to selling short. MFI in this chart is harmonious with the oscillator, both confirming a strong indication of the direction the stock will take over the next few days.
A bottoming formation starts well ahead of the actual final low. This is important to recognize early when selling short, to avoid a huge whipsaw day that can cause huge sell short losses.
When you can read the chart as easily as you read a book, your Spatial Pattern Recognition Skills are finely tuned and you can be proud to be a member of the semi-professional retail swing traders. Let that be your goal, along with consistent profits with minimal losses.
Raise your expectations.
Trade Wisely,
Martha Stokes CMT
Trade ideas

PayPal: Slight Recovery!In recent days, PYPL shares showed a significant recovery, raising the central question of whether the price will indeed dive into deeper territories once more, as assumed in our primary scenario. In this case, we expect the stock to fall below the support at $50.18. There, the stock should form the final low of the overarching beige wave II, thus laying the foundation for a sustainable trend reversal. Alternatively, the overarching low may have already been settled at the beginning of the month. In this 45% likely scenario, the recovery would imminently gain momentum, allowing PYPL to sustainably rise above the resistance levels at $78.86 and $94.97.

PAPL - Good epxectation for earnings, collect potential?Hi guys we would be looking into Paypal Today
Analysts maintain a "Moderate Buy" consensus on PYPL, with 17 buy, 17 hold, and 2 sell ratings. The average 12-month price target is $84.69, suggesting a potential upside of about 29.6% from the current price. Price targets range from $49 to $125.
Earnings Performance
In the most recent quarter, PayPal reported adjusted earnings per share (EPS) of $1.20, a 22% year-over-year increase, surpassing expectations. However, revenue grew by 6% to $7.85 billion, slightly below forecasts. Notably, PayPal has exceeded EPS estimates in each of the last four quarters.
Growth Initiatives and Strategic Outlook
Branded Checkout Enhancements: Efforts to improve user experience and competitiveness against rivals like Apple Pay
Venmo Monetization and Debit Card Expansion: Initiatives to increase revenue through Venmo and broader payment options.
Fastlane Guest Checkout: A new feature aimed at streamlining the checkout process, with significant monetization expected in 2025.
Valuation and Future Prospects
PayPal's current valuation at 14 times forward 2025 earnings is below its five-year average P/E of 50.5, indicating potential for multiple expansion. Forecasts suggest revenue could reach $35.1 billion in 2025, with EPS around $4.93.
Our Conclusion
Given its strategic initiatives, consistent earnings performance, and favorable valuation, PayPal appears poised for growth. While challenges like competition in digital payments persist, the company's focus on innovation and user experience may drive its stock price upward in the coming years.
📌 Trade Plan
📈 Entry: 65.50
✅ Target: 75.50 - Targeting the weak resistance
❌ SL: 55.50 - protecting the trade above the bottom zone

Paypal to the moon 93 dollar until octoberYou can see the futures! This is paypal. It is going to make the 100 dollar this year. Just check the video and enjoy it. peace.

Opening (IRA): PYPL February 21st 77.5/82.5/97/102 Iron Condor... for a 1.66 credit.
Comments: Earnings announcement volatility contraction play.
Metrics:
Max Profit: 1.66
Buying Power Effect: 3.34
ROC at Max: 49.70%
50% Max: .84
ROC at 50% Max: 24.85%

PYPL Building a Base or Faking a Bounce? All Eyes on This CHoCH!Market Structure & Price Action
PayPal (PYPL) is showing early signs of a potential reversal after forming a CHoCH (Change of Character) near the $66 level following a prior BOS (Break of Structure) and key demand reaction around $63.38. The price is now trading inside a retest range from a previous order block and pushing higher with a bullish structure of higher lows. A clean ascending trendline supports the move, with price respecting the diagonal base.
MACD is showing light momentum to the upside, and Stoch RSI is coiled just under overbought — signaling possible short-term consolidation before continuation or a breakout.
Key Levels to Watch:
* Resistance Zone (Supply): $71.50 – $72.00
* Support Zone (Demand): $63.38 – $64.57
* Breakout Trigger: Over $66.50 with volume
* Breakdown Trigger: Below $63.38 BOS zone
GEX & Options Flow Sentiment
* GEX Walls (Gamma Exposure):
* Highest Call Wall / Resistance: $72.00
* Put Wall / Support: $63.00
* Options Oscillator (Pro):
* IVR: 39.7
* IVx avg: 45.3
* Call$: 12.6%
* GEX: 🟢🟢🟢
* Bias: Slightly Bullish into resistance, volatility could expand above $67.
Trade Setup Ideas
Bullish: If price holds above $65.50 and breaks $66.50, we may see a squeeze toward $69 and eventually $71.
* Entry: $66.50
* Stop: $64.70
* Targets: $69 / $71.50
Bearish: Failure to break $66.50 with rejection + bearish divergence may offer a put opportunity toward $63.
* Entry: $65.70 rejection or breakdown below $64.50
* Stop: $66.60
* Target: $63.50 / $62.80
Conclusion
PYPL is bouncing within a consolidating range, and the CHoCH suggests possible accumulation. A breakout above $66.50 confirms strength; otherwise, it’s a fade back to support. Watch the trendline and volume closely this week.
Disclaimer
This analysis is for educational purposes only and does not constitute financial advice. Always do your own research and trade responsibly.

$PYPL - Uh oh!NASDAQ:PYPL How wrong was I? Things were looking up until tariff and stagflation news delivered a one-two punch to the market.
Friday’s candle broke below the support level with good volume.
It is getting very close to retesting the uptrend line that started back in October 2023. They’d better start deploying those buyback dollars before that trendline breaks.
The worst-case scenario for the bulls is the $59 to $57 area, which is a good area to load.

PYPL PUTS ON: PAIN PAL FORECAST FY25if it dont pay it pains from bad trades to gold diggin women we are counting down
the biggest L's of 2025
last year i was wrong but i did catch 24% of it plus weekly timeframe gives me plenty of time to correct my errors now im absotut-e-ly positive we negative hard this semester season year
i had to make it technical so the technicalist's here can relate
break of the first green trendline was the first indication after rejecting my zone
now we looking for the retest which wont break the smaller timeframe downtrend trendline
once the retest is confirmed me and the big money taking our shorts if you scared hey cool thats fine this aint advice anyway keep buying paypal lets see who laughs last
you bag holders (holding garbage bags cause mc donalds aint hiring this coming recession lol)
imma spice this up imma only get out by margin call if im wrong yea yeaaaaa
im going for 2025 degen of the year
i see over -200% if i stack this humbly

PayPal - Multiple Signals Pointing to a Potential Bottom!I’ve just entered a position in PayPal, and the reason is that several overlapping factors are lining up in a way that suggests a potential bottom may be in.
First, it looks very likely that Wave (2) is complete. The stock tapped the 61.8% Fibonacci retracement level with precision and has held that level over the past few days – all while the RSI has been climbing, which is a strong bullish divergence signal in my book.
Second, PayPal just touched last year’s VWAP level perfectly, which I view as another strong technical indicator for a potential reversal.
How far this move could go is still unclear, but the open gap above is definitely something I’m watching closely. For that to be in play, $71 needs to be reclaimed. And from here on, $66 should not be touched again.
That’s my plan – and that’s how I’m trading it. Let’s see if the market plays along.

PayPal is too cheap to ignore here!NASDAQ:PYPL
Undervalued and looking for a turnaround spot!
I believe this is a good R/R area:
$66-$70 S/R Zone
Also, has 100D MA Support and wicking hard at this area showing buyers coming in to stop the bleeding.
Not Financial Advice
A+ dip entry setup here!boost and follow for more ❤️🔥 very simple setup here on Paypal, holding above previous resistance which is now the new support since its last breakout.. Also holding above trend support zone from October 2023.
It could dip a bit more to 63-70 but I think a rally higher 90s and 100s should happen either way. 🎯

PYPL a Bright Spot in a Sea of RedPYPL may have begun a turnaround on Friday. It is teasing both the SMA 9 and SMA 300, with a possible gap fill beginning at around $82.69.
Meanwhile, XLF bounced off the SMA 140, which I like to use as a support level.

PYPL Long OpportunitySimple EWT in play -- finally retested the top of the previous lower range, finishing the formation of the broader inverse H&S pattern.
Will update with more fundamentals as I continue research, but feel the e-commerce competition is overblown and the company is generally undervalued.

$PYPL - potential inverse head and shouldersNASDAQ:PYPL broke below the buy area. Added more. It looks to be forming inverse head and shoulders.

ContinuationAny way you look at this, the chart looks insanely bullish.
The moves it has made in the arch looks a mirror to what it done throughout the years prior and gives me the impression we should see some aggressive moves upwards in the coming weeks. We can dip outside the arch as it has done that before, but it doesn't change its path. Lets hope it finds the momentum and reaches the Fibonacci target which is sitting in the 120-130 zone.
P.S:
Funnily enough, this is the exact same pattern as SQ (XYZ) so I will be doing a copy and paste as the direction potential is the same.

PYPL IS BEING PREPAREDI think the price will rise from the 65-67.5 price range. It is a nice range and we can see it as a test of the area it breaks. Although 75 is the first resistance, it should not bring much selling. After staying above 78, I expect a movement towards the 86 gap and the 110 region.

bullish retracement retracing to it's neckline, look to buy around 68$ - 65$ with a stop below 56 and a target of 120$

PYPL: Zone 2PayPal returning to the 40wk ma after a stage 1 breakout. In an early stage 2 chart, touches on the 40wk tend to be good times to buy.

pypl trend is your friendLong since 76
PayPal is a online payment method that follows you wherever you go. Pay any way you want. Link your credit cards to your PayPal Digital wallet, and when you want to pay, simply log in with your username and password and pick which one you want to use.

PayPal: We've been here before (?)August 2019, PYPL saw the same market structure as we see now (1:1). Market has currently dropped on weak payment transactions but the forecast and main figures remain strong.
Currently PYPL is trading with multiples below fintech's average with P/E 17 (sector 84), market price 100 USD (1:1 target) would make P/E about 22,5, which still makes sense in context of current tech valuations, that are often priced at significantly higher multiples.

Markup phase begun ?It seems like a massive accumulation phase has been completed in paypal and potentially a markup phase has begun. If an impulsive move has begun, then its a good trade to go long on a correction.

$PYPL PAYPAL’S FINANCIAL LANDSCAPE: VALUATION & OPPORTUNITIESPAYPAL’S FINANCIAL LANDSCAPE: VALUATION & OPPORTUNITIES
1/8
PayPal ( NASDAQ:PYPL ) has been on the move lately—announcing a FWB:15B buyback and posting mixed but intriguing earnings results. Let’s dive into what’s making this fintech giant tick! 💳💡
2/8 – Recent Revenue Growth
PayPal’s revenue soared during the digital payment boom but has moderated recently.
Although the exact figures aren’t in the latest posts, growth since 2017 is substantial.
Stabilization might indicate a new normal in digital payments.
3/8 – Earnings & Guidance
Some quarters saw EPS pop by 61%—pretty impressive! 🚀
Mixed guidance ahead: margin expansion concerns and flat-to-down cash flow.
The FWB:15B buyback suggests management sees long-term potential.
4/8 – Valuation vs. Peers
Forward P/E near 10, PEG ratio of 0.52—that’s cheap compared to Visa/Mastercard.
PayPal straddles fintech + payments, competing with everyone from Square ( SET:SQ ) to Apple Pay.
Lower growth vs. some peers, but strong operating margins help PayPal stay ahead.
5/8 – Risk Factors
1️⃣ Regulatory: New rules could cramp expansion.
2️⃣ Market Saturation: Need emerging markets to fuel next leg of growth.
3️⃣ Competition: Stripe, Apple Pay, & countless fintech upstarts.
4️⃣ Tech Disruption: Blockchain, AI, or next-gen payments could reshape the landscape.
6/8 What’s PayPal’s biggest near-term challenge?
1️⃣ Regulatory Hurdles
2️⃣ Competition
3️⃣ Market Saturation
4️⃣ Tech Disruption
Vote below! 🗳️👇
7/8 – SWOT/SCOT
Strengths: Massive user base, recognizable brand, buyback confidence.
Weaknesses: Slowing user growth, uncertain future margins.
Opportunities: Emerging markets, strategic partnerships, AI integration.
Threats: Fierce competition, cyber risks, evolving payment tech.
8/8 – Your Next Move?
PayPal’s at a pivot—undervalued or a value trap? 💰
Let’s see if NASDAQ:PYPL can keep up the momentum!
#PayPal #Fintech #DigitalPayments #PYPL #Investing #Earnings #Valuation #Finance

PYPL: Buy ideaOn PYPL as you can see on the chart, we would have a high probability of seeing the market go higher. This is explained by the fact that we have a red candle with a small body and a long wick which signals us to a possible rise in the market. In addition, this increase will be confirmed by the appearance of a large green candle accompanied by a large green volume which will cause the Vwap indicator to forcefully break, hence this upward trend.
