9/2/25 - $rgti - Here's where u short it... again9/2/25 :: VROCKSTAR :: NASDAQ:RGTI
Here's where u short it... again
- co says they are giving some of their warez to a uni for research
- market says "cool let's send this up $500 mm mcap"
- guys, this chart is breaking down and i'm not even a technician
- when the liquidity toilet bowl gets flus
−0.37 USD
−200.99 M USD
10.79 M USD
About Rigetti Computing, Inc.
Sector
Industry
CEO
Subodh K. Kulkarni
Website
Headquarters
Berkeley
Founded
2013
ISIN
AR0662506531
FIGI
BBG01V2GHRG7
Rigetti Computing, Inc. provides full-stack quantum computing services. It serves global enterprise, government, and research clients through its Rigetti Quantum Cloud Services platform. The company was founded by Chad Rigetti in 2013 and is headquartered in Berkeley, CA.
Related stocks

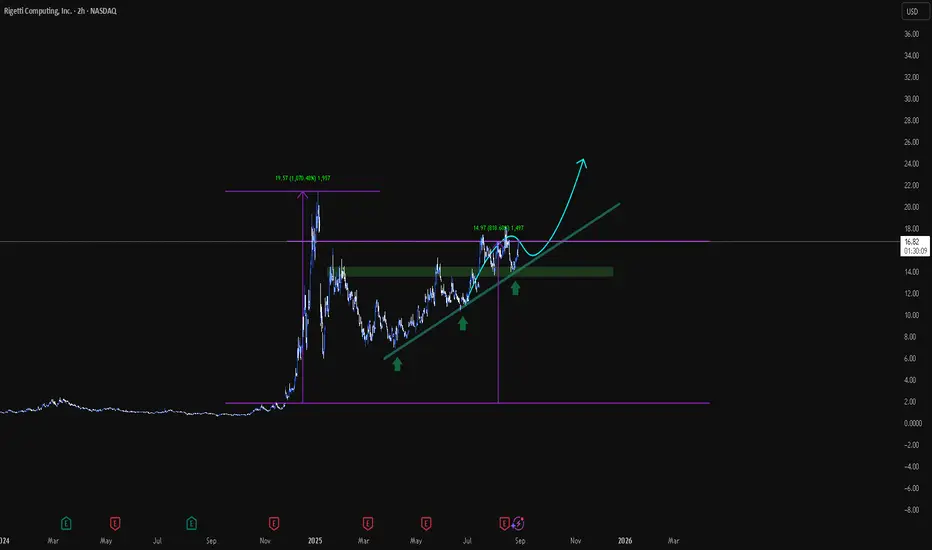
ABC Correction done?Looks like we completed 5 waves and a ABC bullflag correction phase.
This might result in a wave 1 breakout out of the bullflag soon.
If wave 1 is as strong as the last impulsive move, we might see 24 usd+

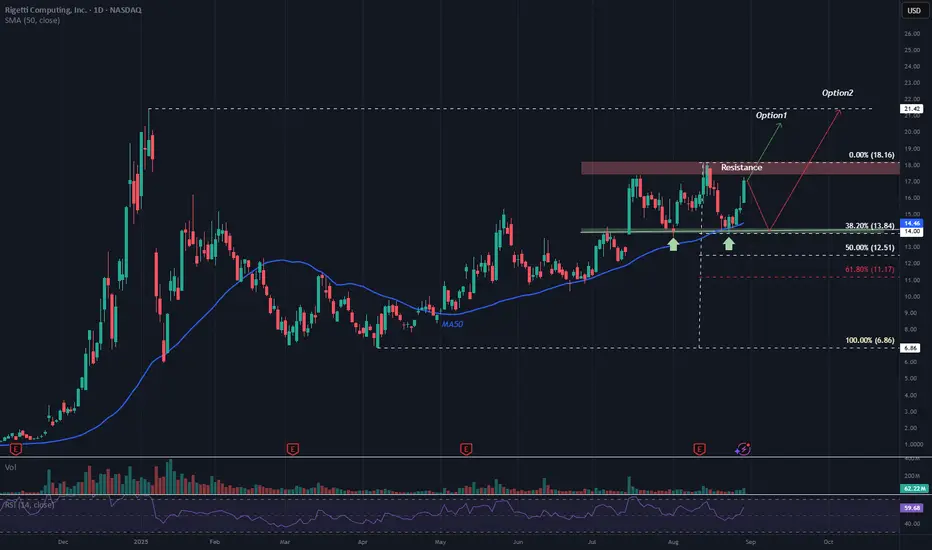
$RGTI Trading Range with Potential Breakout or PullbackThe stock is currently trading within a healthy horizontal range, with support around the $13.80 area (considered a buy zone) and resistance between $17.50 and $18.00 (potential sell zone).
From this point, two scenarios are possible:
Pullback Scenario: A reversal toward the support zone, potenti
Rigetti | Technical analysis. 2H.This stock price performance is so crazy...
The price still looks like it's going to reach the previous highest mark first.
RGTI Swings Thesis
Quantum sector trades on hype. Companies like Rigetti (still pre-commercial, burning cash) and D-Wave (more advanced) move in the same patterns. Market treats all projects alike at this stage, similar to early crypto. Sorting by real business models comes later. For now, price action is drive

Rgti High potentialSomehow, I keep hanging up here for the highest potential in this field, especially the zone it in will start accumulating under 20 fingers crossed y’all

RGTI - let's gambleHigh risk RGTI gamble with good 4:1 ratio. Not sure why TW is forcing me to write more to publish this degen gamble.

RGTI - Rigetti Computing - Where are we? 20.00 Soon?Hello Everyone,
This is the last one for Today.
You can see my previous analysis here:
So where are we now?
It got support from 50 SMA this level is also our first support level and if this level is broken we can unfortunately see the 11.xx price levels.
My expectations is that it will stay in

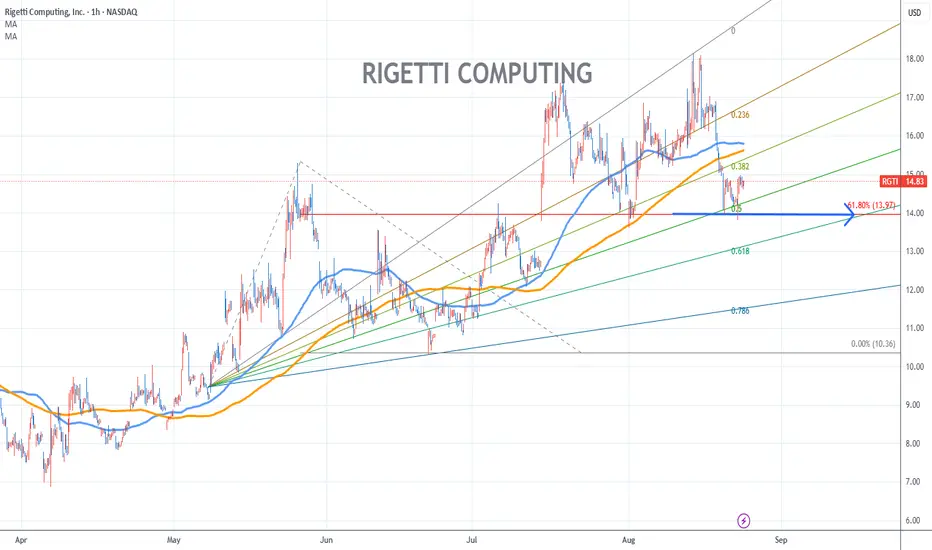
Riggeti Computing Stock Chart Fibonacci Analysis 082225Trading Idea
1) Find a FIBO slingshot
2) Check FIBO 61.80% level
3) Entry Point > 14/61.80%
Chart time frame:B
A) 15 min(1W-3M)
B) 1 hr(3M-6M)
C) 4 hr(6M-1year)
D) 1 day(1-3years)
Stock progress:A
A) Keep rising over 61.80% resistance
B) 61.80% resistance
C) 61.80% support
D) Hit the bottom
E)
The Next Jump?The chart of an asset with two strong support levels suggests we are in an ideal position for further upward movement.
Technical characteristics:
✅ MA50 Support: The price is consistently trading above the 50-period moving average, acting as dynamic support
✅ Bollinger Band Bottom Test: Having to

See all ideas
Summarizing what the indicators are suggesting.
Oscillators
Neutral
SellBuy
Strong sellStrong buy
Strong sellSellNeutralBuyStrong buy
Oscillators
Neutral
SellBuy
Strong sellStrong buy
Strong sellSellNeutralBuyStrong buy
Summary
Neutral
SellBuy
Strong sellStrong buy
Strong sellSellNeutralBuyStrong buy
Summary
Neutral
SellBuy
Strong sellStrong buy
Strong sellSellNeutralBuyStrong buy
Summary
Neutral
SellBuy
Strong sellStrong buy
Strong sellSellNeutralBuyStrong buy
Moving Averages
Neutral
SellBuy
Strong sellStrong buy
Strong sellSellNeutralBuyStrong buy
Moving Averages
Neutral
SellBuy
Strong sellStrong buy
Strong sellSellNeutralBuyStrong buy