RGTI: The Bullish Dragon Awakens for 2026
The Bull Case:
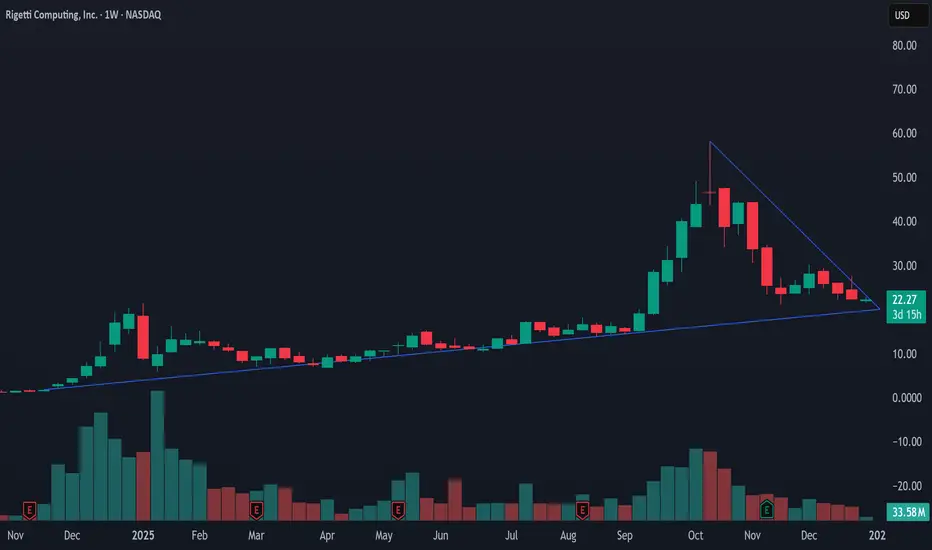
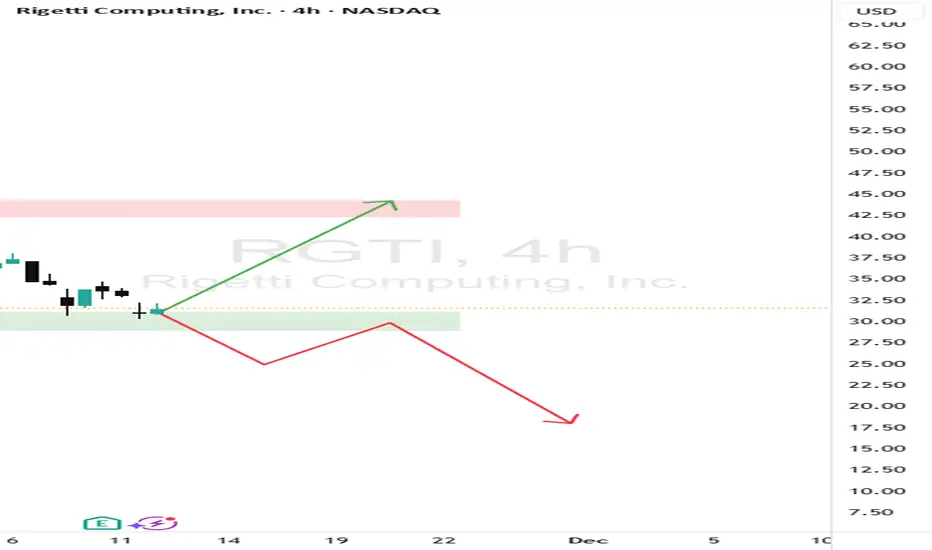
Technical Setup: The Dragon Pattern We are witnessing a textbook Bullish Dragon formation on the Rigetti chart, signaling a major trend reversal.
The Head: Formed at the previous swing high before the initial decline.
The Feet: We have two distinct lows—the "Left Foot" followed by a higher "Right Foot." This higher low indicates that selling pressure is exhausted and buyers are stepping in earlier than before.
The Hump: The mid-pattern peak that provides our primary resistance level.
The Trigger (Tail): A breakout above the trendline connecting the "Head" and the "Hump" confirms the pattern. With the stock recently showing resilience around the $23.60–$25.00 level, a move above the hump will confirm the "Tail" extension toward targets at $35.00 and $50.00.
Fundamental Bull Case:
2026 Technology Roadmap: Rigetti is on track to deploy its 150+ qubit system by late 2026, targeting a 99.7% median two-qubit gate fidelity. This is a critical step toward their 1,000+ qubit goal in 2027.
Strong Liquidity: As of late 2025, Rigetti fortified its balance sheet with roughly $600 million in cash and equivalents, providing a substantial runway for R&D without the immediate need for dilutive financing.
Strategic Partnerships: Recent support for NVIDIA’s NVQLink platform positions Rigetti at the intersection of AI supercomputing and quantum processing, a high-growth hybrid niche for 2026.
Commercial Momentum: The company secured $5.7 million in purchase orders for its Novera systems in late 2025, with deliveries scheduled for the first half of 2026, marking a shift from pure research to commercial hardware sales.
The Verdict: The confluence of a confirmed "Dragon" reversal pattern and a well-funded 2026 roadmap makes RGTI a high-conviction play for the next phase of the quantum revolution.
Rigetti Computing, Inc. Shs Cert Deposito Arg Repr 0.5 Shs
No trades
Market insights

Rigetti Computing breakout setup as quantum stocks kick off 202Current Price: 23.6 (Analysis was generated on Monday Morning)
Direction: LONG
Confidence level: 52%(Limited data and low social activity, but early-2026 momentum in quantum stocks and trader tone tilt this slightly bullish)
Targets
Target 1: 24.30
Target 2: 24.80
Stop Levels
Stop 1: 23.10
Stop 2: 22.70
Wisdom of Professional Traders:
This analysis pulls together the collective intelligence of professional traders who are actively tracking Small Caps ETF price action. When I stack all the trader commentary together, the short-term picture stands out clearly: several traders are warning that IWM is showing early weakness near the $250–$251 zone, with repeated failures to push cleanly higher. The wisdom of crowds matters here. Even though longer-term charts remain constructive, the near-term trader consensus is cautious to bearish, which carries more weight for a one-week trade.
Key Insights:
Here’s what’s driving this: several professional traders discussing quantum stocks highlighted that the sector opened the first trading session of 2026 with broad upside momentum. They pointed out that many names are holding or reclaiming their 200-day moving averages, which usually attracts swing traders looking for follow-through during the first week of the year.
What caught my attention is the lack of aggressive bearish language. Traders aren’t calling tops or breakdowns; instead, the tone is about watching upside levels and momentum continuation across the quantum space. With Rigetti Computing trading at $23.6, this places price close enough to recent support that I’d rather lean long than fade it, especially given the typical early-year risk appetite.
Recent Performance:
Rigetti Computing ended the recent session around $23.6 after participating in the broader strength seen across quantum-related stocks. Price action has been firm rather than choppy, and there hasn’t been a sharp rejection that would suggest heavy distribution. This kind of steady behavior often precedes a short-term push higher when momentum traders step in.
Expert Analysis:
Professional traders covering the quantum sector are zoomed out and watching trend-defining levels like the 200-day average. Even though specific dollar targets for Rigetti Computing weren’t repeatedly mentioned, the consensus view is that quantum names are trying to build a base for higher prices in early 2026. When I put that together with the current price location, it supports a cautious long bias for the week.
At the same time, social chatter on X is light, which keeps confidence moderate rather than high. Still, low noise can sometimes work in favor of upside, since there’s less crowded positioning to unwind.
News Impact:
There’s no fresh headline catalyst specifically for Rigetti Computing right now, but the broader narrative around quantum technology investment and long-term adoption continues to underpin interest in the group. The market seems willing to give these names room to move early in the year, and that backdrop helps the short-term long case.
Trading Recommendation:
Putting it all together, I’m taking a LONG stance on Rigetti Computing for this week. I’d look for a move toward $24.30 first and potentially $24.80 if momentum across quantum stocks stays intact. Risk is clearly defined with stops at $23.10 and $22.70 in case sector strength fades quickly. Given the mixed depth of data, I’d keep position size moderate and treat this as a tactical early-2026 momentum play rather than a high-conviction swing.

Understanding Rigetti ComputingRigetti Computing is a high-tech company that builds Quantum Computers. While normal computers (like your phone or laptop) use "bits" (0s and 1s), quantum computers use "qubits." This allows them to solve mathematical problems that are too complex for even the world's fastest supercomputers.
In 2025, Rigetti’s stock price became a "hot topic" because it grew by thousands of percentage points. However, as a new trader, it is important to understand why the price moved and why many experts are now careful.
Why the Stock Rose: The "Quantum Hype"
Several factors pushed Rigetti’s stock higher during the AI boom:
* Technology & Innovation: Rigetti is "vertically integrated." This means they make their own chips and their own software. This is a very professional and efficient way to build a company.
* Geopolitics: The United States government wants to win the "Quantum Race" against other countries. Because of this, companies like Rigetti often receive government support and contracts.
* Industry Trends: As Artificial Intelligence (AI) grows, it needs more power. Quantum computing is seen as the next step to make AI even smarter.
The Risk: Is the Price Too High?
When a stock grows too fast without having enough sales (revenue), traders call it " overbought." Here is the current situation for Rigetti:
* The Valuation Gap: Rigetti’s "Price-to-Sales" ratio is very high. This means the stock price is much higher than the actual money the company is making.
* High Cash Burn: Building quantum computers is very expensive. The company spends a lot of money on science and research, but does not yet have many paying customers.
* Market History: Professional traders remember the "Dot-Com" bubble of the year 2000. Back then, many internet stocks rose quickly and then crashed by 90%. Some experts fear Rigetti might follow a similar path.
Market Impact and 2026 Prediction
If you are trading this stock, you should expect high volatility. This means the price can go up or down 10% or 20% in a single day.
What to expect by the end of 2026:
Many analysts believe the "hype" will slow down and the price will return to a more realistic level. Predictions suggest the stock could settle between $3 and $7 by the end of 2026. This would be a "correction," where the market moves from trading on "dreams" to trading on "real financial results."
Rigetti | Technical analysis. 2H.This stock price performance is so crazy...
The price still looks like it's going to reach the previous highest mark first.
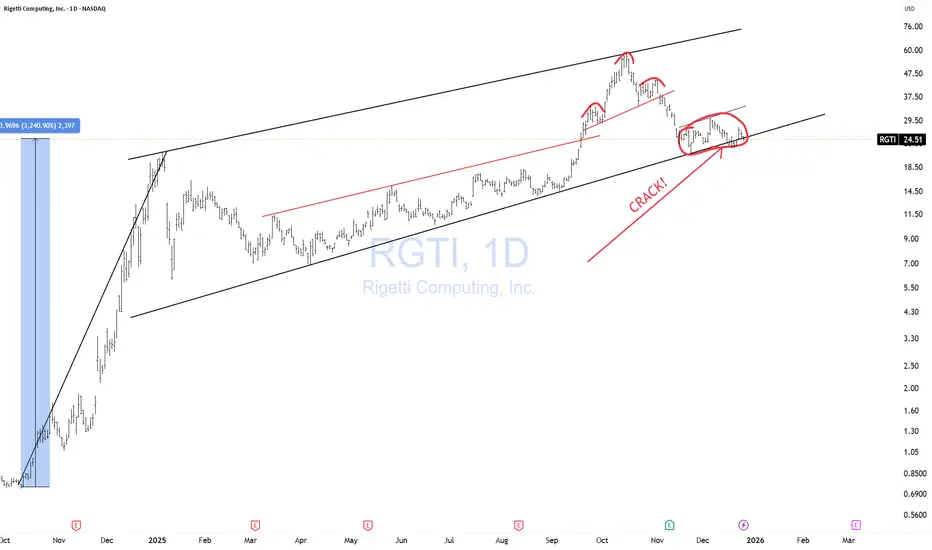
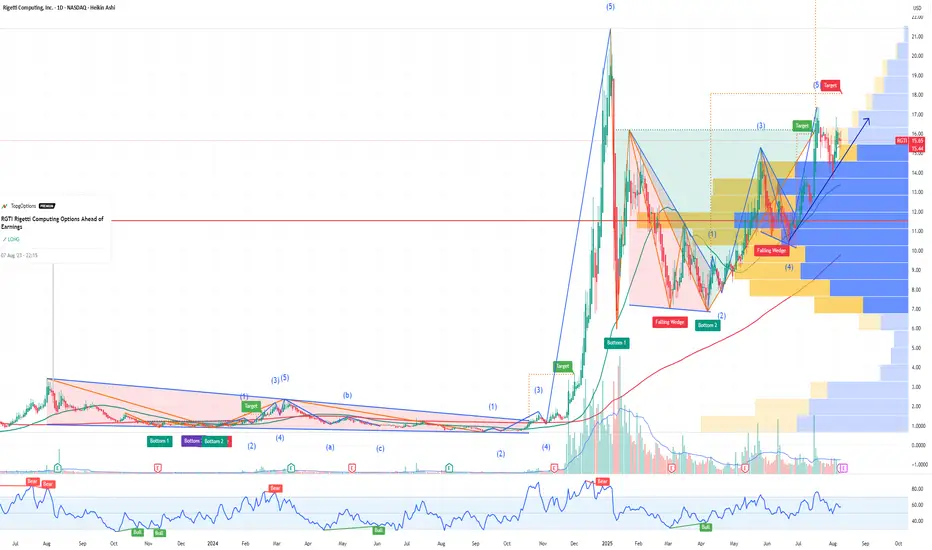
RGTI CRACK!RGTI is up 3,240% in a bit over a year, with A complete wave 3 up with a hook, Rising F flag that CRACKED, with a broken H&S within it, followed by a low base consolidation flagging out.
RGTI has already lost about -57% of its total value. Don't be surprised if it loses another 50% from here given the run it has had. (And no, I am not doing Trump math. hahah!)
THANK YOU for getting me to 5,000 followers! 🙏🔥
Let’s keep climbing.
If you enjoy the work:
👉 Drop a solid comment
Let’s push it to 6,000 and keep building a community grounded in truth, not hype.
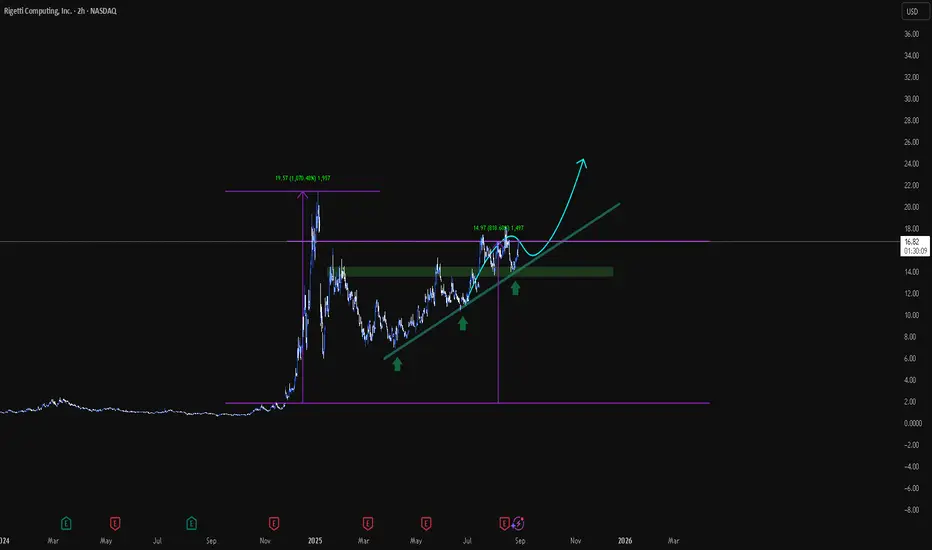
$RGTI giga-longMrJosephTrades here with another quantum name that I think has room to run. Check out this weekly of RGTI, a highly speculative, shorted, and volatile quantum name in the nascent space. "Confluences" to support this "thesis."; retracement to the 71 Fib level (deep discount zone of the market structure); pullback to the breakout-pullback zone (green rectangle); a double bottom just above the 50-period weekly ema (indicated by the 2 green arcs). Long and strong baby. See you near the recent swing high at about $53/share...Great trading to all. Be careful. Do not follow my advice (disclaimer).

RGTI - Potential ScenarioI may have not made it clear, but I am not a fan of quantum computing at all. Practical financial use? Not much, highly speculative and I very much believe that majority of retail getting involved don't truly understand what it's utilization is.
However, historically I've let my own prejudice on a thing stop me from making stupid money. This is a scenario I could def see playing out, especially with a 70% Retrace from the all-time-high.
Tracking for now, looking for an entry near the lowest VWAP line you see on the chart.

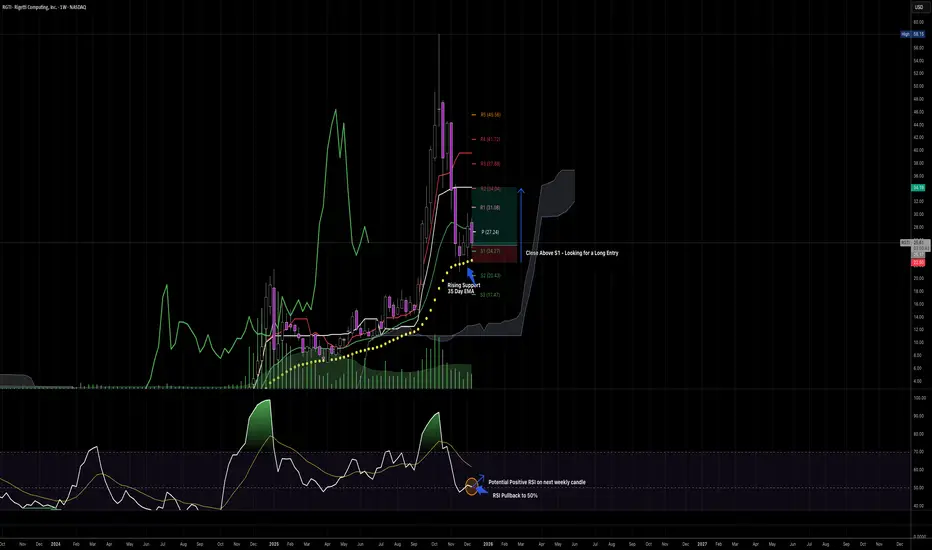
Rigetti - Weekly Chart - Potential Long Entry
The Weekly candle has pulled back nicely into Weekly S1 Support.
In addition, a rising channel (35 EMA) of support underpins the pull-back.
The RSI has also pulled back to the 50%, which could result in a upward and positive bounce into next week, if it holds.
I am looking for a long entry on the this Weekly candle closing above S1 , with a stop below the 35 EMA.
-> Take Profit will be at R2 ($34) and the Ichi-Moku Base-Line, which is also located very close to R2.
-> Expect first resistance at the 20 Day EMA ($27) and second at R1 ($31).
Naturally monitor the trade and take some profit off if momentum fails on lower timeframe closes on the Daily and 4H charts.
This is not trading advice, do your own research. Always! :)
Bullish Thesis on RGTI (Rigetti Computing)Swing-to-position | High Beta Momentum + Fundamental Inflection
1. A deep base followed by a violent expansion
RGTI spent almost ten months building a flat, forgotten base with low participation.
Then it erupted with a multi-hundred-percent move on real volume.
This kind of structure is classic for high-beta tech names that shift suddenly from neglect to aggressive re-rating.
The recent correction is a textbook post-parabolic digestion.
Price returned to the prior breakout zone, found buyers again, and held a higher low. That’s typically a sign of strength, not weakness.
2. A clean higher low after a major run
This is often the moment where the next leg begins.
The stock printed a capitulation low, reversed sharply, reclaimed key levels, and stabilized above support around 25–26.
When high-beta names form their first higher low after a parabolic advance, institutions usually prefer to accumulate because the risk becomes well-defined.
3. The downtrend break confirms an early trend reversal
The main descending trendline from the highs has now been broken.
Price retested that area and held.
From a structural point of view, this is one of the clearest reversal formations you can get: compression, breakout, retest, continuation.
The next logical liquidity area sits around 34–36.
4. Momentum is rotating back into speculative tech
High-beta and speculative technology are attracting flows again.
RGTI is one of the purest quantum computing names in the public markets, and it tends to outperform whenever risk appetite rises.
Right now, there is strong momentum coming back into these themes, which gives RGTI a favorable backdrop.
5. Fundamentals are improving quietly but meaningfully
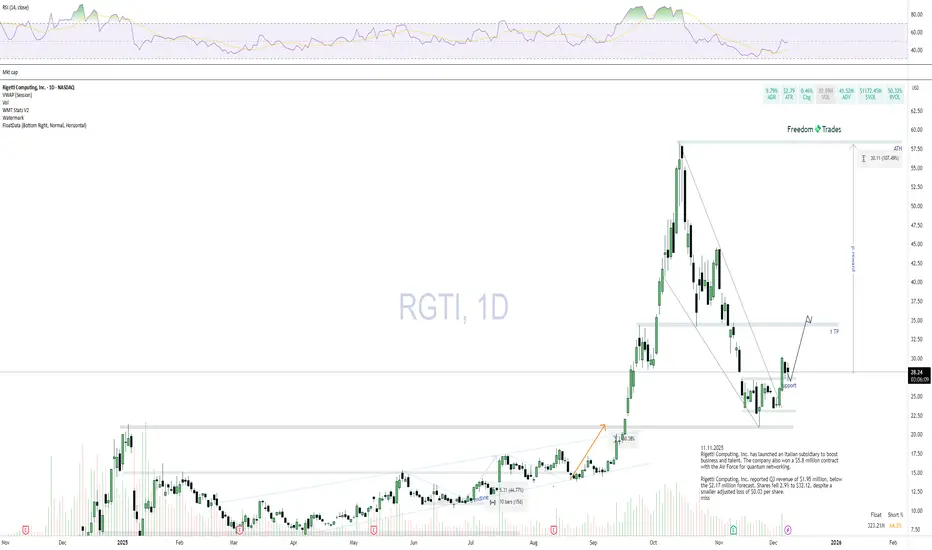
Rigetti has expanded internationally, launched a new Italian subsidiary focused on scaling talent and operations, and secured a 5.8 million dollar contract with the U.S. Air Force for quantum networking.
Revenue also came in better than expected in Q3.
The stock pulled back on a small EPS miss, but that part of the story is already well digested by the market.
For a micro-cap, even moderate improvements have an outsized impact on sentiment and price behavior.
6. Clean air above current levels
There is very little resistance between 28 and the mid-30s.
Volume drops off in that zone, which often acts like a magnet during recovery phases.
If buyers continue to step in, the next natural target becomes the 34–35 range, followed by the 40–42 zone.
Price Targets
TP1: 34–35
Short-term, driven mostly by momentum and liquidity gaps.
TP2: 40–42
Medium-term, aligned with the next structural shelf.
Extended scenario: 55–60
If quantum computing gains fresh attention or if another government contract comes in, a move toward the old highs becomes realistic.
Risk Management
Small position sizing is essential because RGTI is still a speculative micro-cap.
A clean invalidation sits below 24.
Expect volatility, which is normal for this type of name.
Quantum stocks finally took a breatherQuantum stocks were very overbought in October, which I noted in a previous post on October 15. They have since corrected by 59%. That doesn't mean they are cheap. But with RSI approaching oversold conditions, the sector may be primed for a rally.

Potential Inverse Heads and ShouldersSummary
NASDAQ:RGTI is forming a potential inverse head and shoulders on the 4-hour timeframe. The neckline is sitting at around $27.5. A strong break above the neckline with volume indicates conviction and a good time to enter the trade. Target would be roughly $34.
Breakdown
Entry : $27.5
Target : $34
Caution
This stock is entirely speculative and has no real value from an investor's standpoint. The company still has negative revenue and is only kept up by retail traders hoping for a quantum breakthrough. Even though the potential pattern is bullish, it is best to position yourself more conservatively on companies that have no real income.

RGTI - Prime Dip Buy TerritoryRGTI has printed a bullish Morning Star Pattern with the lower wicked whipsaw re-testing longer term support.
So a higher time frame re-test has completed and a bullish reaction has printed.
We've had to wait for this one, but if you're going to buy a stock with a strong longer term uptrend then this area is prime dip buy territory having seen that price action signal.
In the short term this can still easily be rocked by Nasdaq wobbles.
And in the area since the Trump threat on China tariffs back in early October, there have been sharp Nasdaq wobbles:
But as we have looked at - if Nasdaq is now finally readying for the next wave up then high volatility stocks like RGTI may be about to fly.
So the short term buy point is somewhat a guess because we can't know if Nasdaq will wobble again of if the uptrend is already underway.
But a scattered buy in this area may work well.
This quantum stock is a proven winner and if there is another wave up then this can be a lucrative area 👍.
This analysis is shared for educational purposes only and does not constitute financial advice. Please conduct your own research before making any trading decisions.

RGTI Rigetti Computing Options Ahead of EarningsIf you haven`t bought RGTI before the rally:
Now analyzing the options chain and the chart patterns of RGTI Rigetti Computing prior to the earnings report this week,
I would consider purchasing the 15usd strike price Calls with
an expiration date of 2027-1-15,
for a premium of approximately $6.20.
If these options prove to be profitable prior to the earnings release, I would sell at least half of them.
$RGTI: Reaction from Macro Resistance and Structural OutlookPrice reacted as expected from the key resistance outlined in the October update.
The main hypothesis remains that price has likely topped and is now completing its first wave of decline.
Any upcoming recovery attempt will be considered a bounce and potential lower high formation before further downside later this year.
Chart:
In the broader context, the critical zone to monitor is the 35–25 support area.
If price manages to stage an impulsive 5-wave recovery from this zone, the probability for another upside leg toward the next macro resistance at 85–115 will remain valid.
However, if the recovery from this area unfolds as a corrective 3-wave structure, then a breakdown below the Dec’24 top and continuation into the macro support zone will become the higher-probability scenario.
Chart (weekly):
Previous Updates
• On macro resistance and potential topping (Oct 13)
Chart:
View Idea
• On support and pullback potential (Sep 24)
Chart:
View Idea
• On macro structure (Sep 18)
Chart:
View Idea
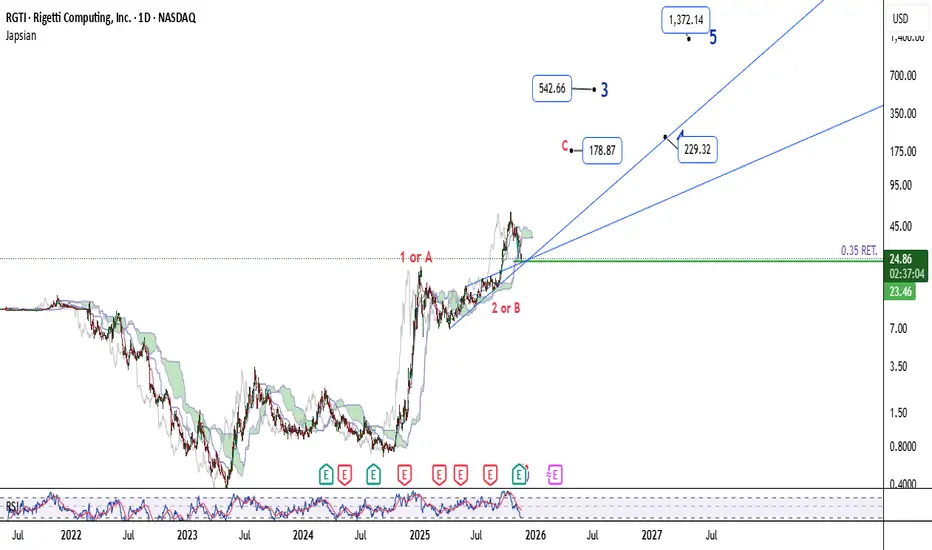
RGTIIn my view, RGTI has reached a major and very strong support zone. From this level, it may start forming either wave C or a larger wave 3, with the potential targets already marked on the chart.
RGTI: Buy the dip zoneRGTI:
.
Quantum collapsed! Risk or opportunity? That depend on you!
Buy the dip zone!
.
US STOCKS- WALL STREET DREAM- LET'S THE MARKET SPEAK!

RGTI at Key Support Zone — Potential Rebound or BreakdownNASDAQ:RGTI is currently testing a key demand zone around $30, where previous accumulation occurred before the last rally. A clear reaction from this area could decide the next major move:
Bullish scenario: A rebound from this zone could drive the price toward the $42–45 resistance area (previous supply zone).
Bearish scenario: Failure to hold above $30 may trigger a continuation of the downtrend toward $20.
RSI is approaching the oversold region, hinting at a possible short-term bounce, but confirmation requires a strong bullish candle or a break above the recent lower high.
Given the high volatility of RGTI, traders should watch for volume confirmation before entering.
Fundamentally, Rigetti remains a speculative quantum computing stock—strong balance sheet but unprofitable, with long-term potential yet short-term valuation risks.
RGTI - Dip Buy Opportunity In Winning Quantum Stock Earnings coming up at market close today for this high volatility quantum stock that has printed a very bullish HTF trend so far.
HTF chart:
Notice on LTF chart that it has dipped into the higher liquidity zone below support.
Then notice the lower wicked candle (arrow) that has printed a bullish whipsaw - signalling potential bullish interest.
That low is within a 1:0.618 Golden Window and if the LTF pivot holds then that is a bullish signal since the ratio with shorter wave 3 signals downside weakness.
This also has more bullish potential with Nasdaq looking bullish to start the week:
I bought some here and I may buy more through earnings 🙂.
This analysis is shared for educational purposes only and does not constitute financial advice. Please conduct your own research before making any trading decisions.

Rigetti Computing Stock Analysis before earningsRGTI Stock Analysis before earnings
About Rigetti Computing Stock (Ticker: RGTI), I see decent buying moment, altough having a P/S ratio of 1500 aproximately, which looks absurd in a value investing perspective, the stock is considered cheap and with great potential of having an uptrend in the long term. Great innovative perspective.
- In a technical outlook, this week has shifted above 42.25 usd level, which means a market structure shift, and breakout of the tanking effect last days. Today in the last trading day, has closed in expansion relating to the profile.
Relating investment advice: Not financial advice, and never risk more money that you can lose, trade at your own diligence!,
Stay safe,
Sebastian.

Rgti bull flag Drew this on my phone and I hate that this likely plays out. How is this garbage stock still pumping on zero fundamentals? Anyhow my bet is it pumps very hard into end of year.

RGTI - quantum computing on the move?Rigetti RGTI beginning a 50% move? New technology requires more and more computing power. Quantum computing is the next frontier. Is the risk work the return?
RGTI Weekly Outlook (Oct 28–31)RGTI Weekly Outlook (Oct 28–31): “Quantum Pullback or Continuation? Watching $40 for the Next Big Move”
1. Weekly (1W) — Long-Term Structure
Rigetti Computing (RGTI) recently completed a massive breakout structure, with a BOS (Break of Structure) that sent price soaring from single digits into the $40 zone — a gain exceeding 500%. The stock is now undergoing its first healthy correction phase within a broad ascending channel.
* Trend Bias: Still bullish on higher timeframe.
* Support Levels: $22 → $18 → $10
* Resistance Levels: $40 → $55 → $75
* Momentum: Weekly MACD remains firmly bullish but histogram momentum is cooling — a normal retracement after parabolic expansion.
* Stoch RSI: Rotating down from overbought, showing consolidation rather than full reversal.
💡 Macro takeaway: The structure suggests continuation potential toward $55 once the pullback stabilizes. Maintaining above $18–$22 would confirm the higher low formation and keep long-term bulls in control.
2. Daily (1D) — Corrective Phase in Play
On the daily timeframe, RGTI is retracing after forming a high near $55. The latest daily candles show early stabilization as buyers defend near-term support at $38–$40, coinciding with the trendline and prior BOS zone.
* Market Structure: Still in a correction phase after a vertical breakout.
* Support Zones: $40 → $34 → $28
* Resistance Zones: $43 → $50 → $55
* Indicators:
* MACD remains bearish short-term, but histogram contraction suggests momentum loss on the downside.
* Stoch RSI showing a potential bullish cross from oversold territory.
📈 Daily insight: The base-building around $38–$40 is crucial. If bulls can reclaim $43–$45 with volume, the next leg toward $50–$55 could trigger, supported by short-covering momentum.
3. 1-Hour (1H) — Intraday Playbook
On the 1-hour chart, the price has reclaimed its short-term uptrend after a CHoCH → BOS sequence. The stock is attempting to hold above the local trendline and defend $40 as its key pivot level.
* Bias: Intraday bullish while holding above $38.
* Support: $38 → $36 → $34
* Resistance: $43 → $45 → $48
* Playbook Scenarios:
* Bullish scalp: Break above $43.50, target $45–$48 with stop under $40.
* Dip buy: Enter near $38–$39 if defended; risk below $36 for bounce back to $43.
* Bearish invalidation: Below $36 = structure break, opens $34 retest.
💬 Intraday read: Momentum on MACD is neutral but improving. A decisive push over $43 could trigger momentum ignition, aligning with the hourly ascending structure.
4. GEX & Options Sentiment
From the GEX (Gamma Exposure) data and volume structure:
* Highest Positive NETGEX / Gamma Wall: $45 → $50 zone.
* Call Walls: $43 → $50 → $55.
* Put Support: $38 → $34.
* IVR: Elevated at ~50+ (speculative sentiment strong).
* Call Sentiment: Heavily call-weighted, aligning with bullish bias post-consolidation.
🔍 Interpretation: As long as RGTI maintains above $38–$39, the gamma setup favors upside continuation. A break above $43 could ignite a push toward the $50 call wall region.
5. Suggested Option Setups
Bullish Play (Primary Bias):
* Play: 40C–45C (0–2DTE) breakout setup.
* Entry: Above $43 breakout confirmation.
* Targets: $45 → $48 → $50.
* Stop: Below $39.
Dip Buy Setup:
* Play: 40C (1DTE) near $38–$39 support bounce.
* Target: $43–$45.
* Stop: Below $36.
Bearish Hedge (only if breakdown):
* Play: 35P (1DTE) if price loses $36 structure.
* Target: $34 → $30.
* Stop: Above $39.
Directional Bias
RGTI remains a high-beta quantum computing momentum stock with strong institutional attention. While short-term cooling is evident, the structure still supports continuation once the $43–$45 zone breaks.
🎯 Primary Bias: Bullish continuation after correction.
⚠️ Invalidation: Breakdown below $36 → deeper retracement toward $30–$34 range.
This analysis is for educational purposes only and does not constitute financial advice. Always do your own research and manage risk before trading.
RGTi Going long here at support just because the rsi is well oversold on the 1 hr time frame . option premium someone bought olmost 3 million in value for call for 2027 I don’t know if this is a hedge but I will long here
