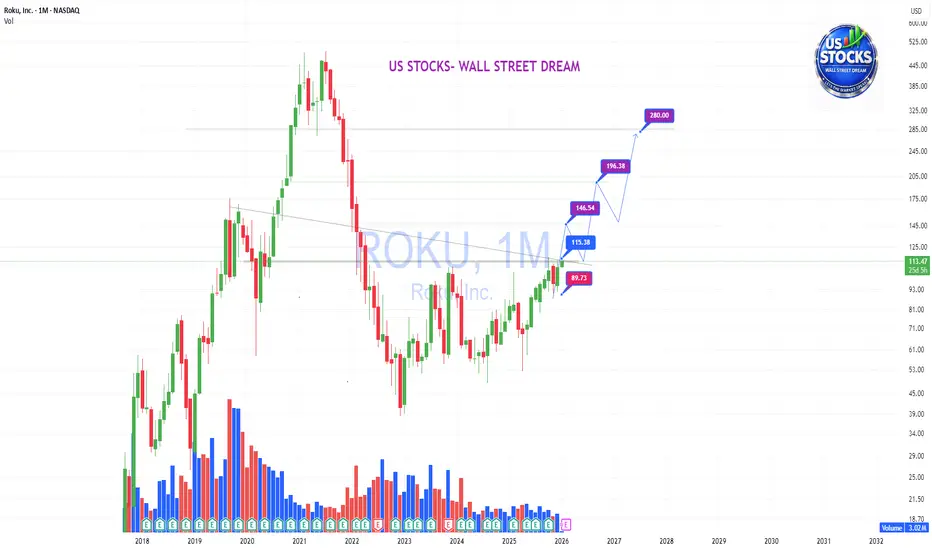
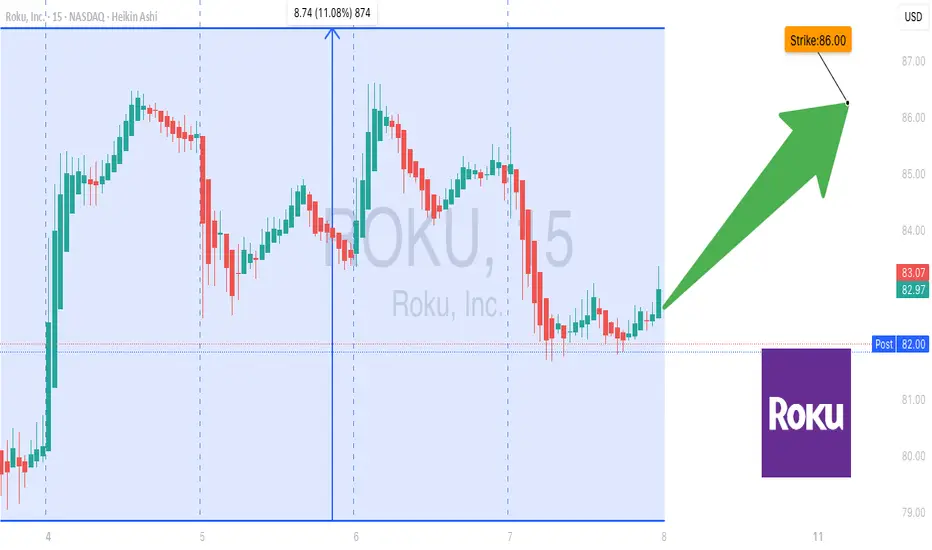
ROKU: A so tight base, a so good CAUSE- and what EFFECT?ROKU:
.
A so tight base, a so good CAUSE- and what EFFECT?
Wait for break and plan been confirmed.
.
US STOCKS- WALL STREET DREAM- LET'S THE MARKET SPEAK!
Roku, Inc. Shs Cert Deposito Arg Repr 0.0769230769 Shs
No trades
0 ARS
−118.48 B ARS
3.77 T ARS
About Roku, Inc.
Sector
Industry
CEO
Anthony J. Wood
Website
Headquarters
San Jose
Founded
2002
Identifiers
2
ISIN AR0187927956
Roku, Inc. engages in the provision of a streaming platform for television. It operates through the Platform and Devices segments. The Platform segment includes digital advertising and related services including the demand-side platform and content distribution services such as subscription and transaction revenue shares, media and entertainment promotional spending, the sale of premium subscriptions, and the sale of branded channel buttons on remote controls. The Devices segment is involved in the sale of streaming players, audio products, smart home products, and accessories that are sold through retailers and distributors, as well as directly to customers through the company’s website. The company was founded by Anthony J. Wood in October 2002 and is headquartered in San Jose, CA.
Related stocks
ROKU — Trend Reversal | Upside Potential +200%This long position was opened today in the Premium channel.
The idea remains valid and can still be considered by those who haven’t entered the position yet.
✅ Roku, Inc. #ROKU is a leading streaming platform and Smart TV operating system, monetizing through advertising, subscriptions, and content

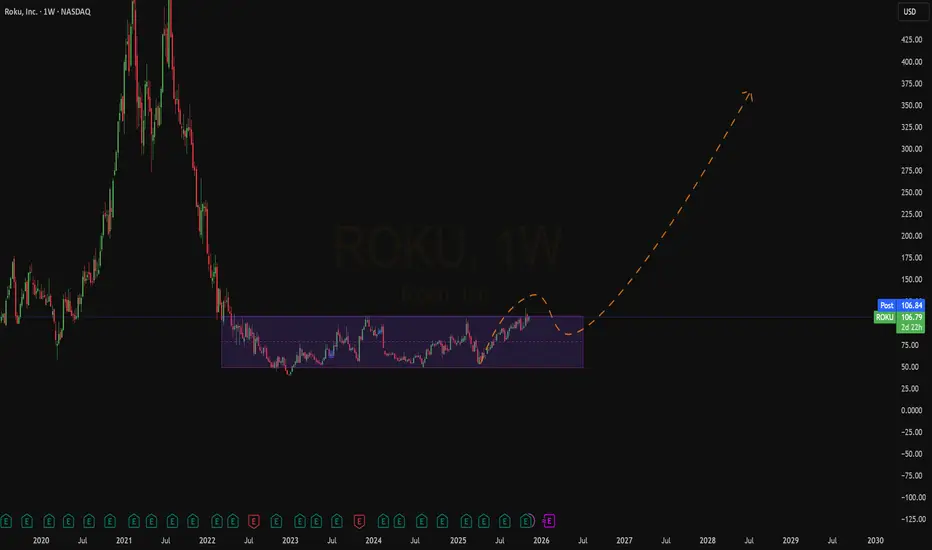
Pickup $ROKU ahead of monster breakoutNASDAQ:ROKU is on the cusp of a potential breakout with monster upside targets of 50% and 100%.
The weekly chart shows the broader picture with a years long consolidation period pressing at times on the current resistance $110/$111 area. Notably Morgan Stanley has upgraded the stock to overweight,

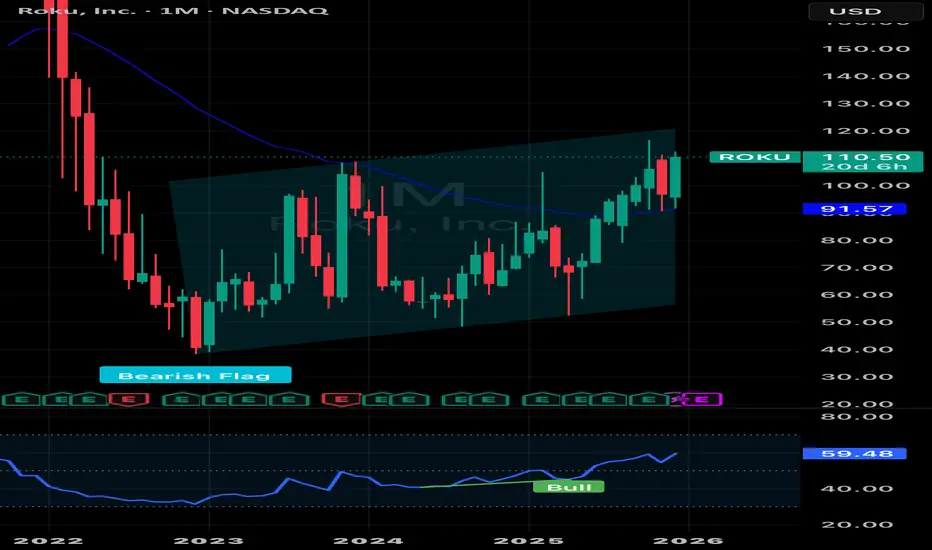
Roku: Turning for multi-week gains?Roku gaps up today and is holding up on strong relative strength following a surprise & pleasing last earnings about 6 weeks ago.
It’s even got this ‘change in character’ on Monthly chart as it breaks the highs earlier in the year. Plus RSI divergence.
Company’s fundamentals strong & strong cha
New Setup : $ROKU - WeeklyThe Weekly chart sees an attempt to break the multi-year base to the upside.
L2 alert already popped out.
Ready to catch it !
ROKU | Wow, This Rally Is Going To Be GOOD | LONGRoku, Inc. engages in the provision of a streaming platform for television. It operates through the Platform and Devices segments. The Platform segment includes digital advertising and related services including the demand-side platform and content distribution services such as subscription and tran

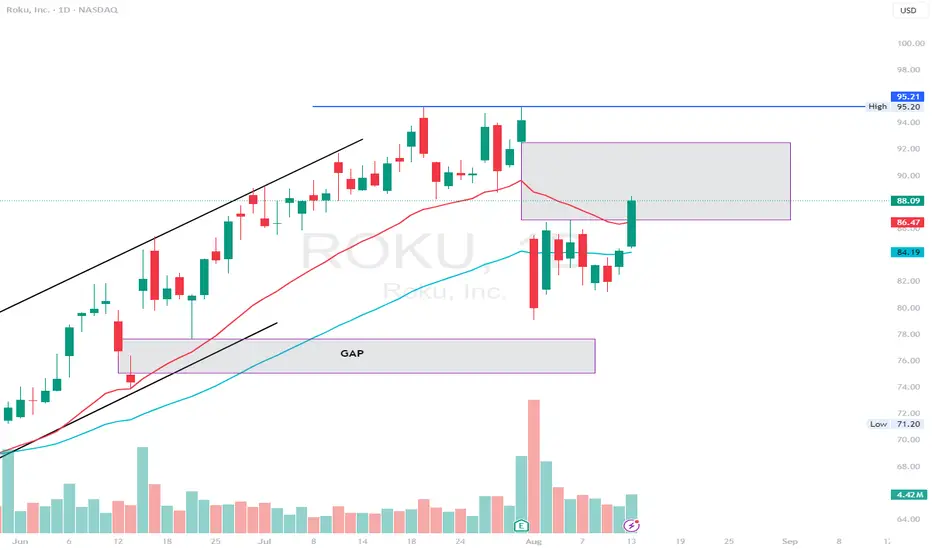
ROKU - gap fill to $92ROKU - stock moving higher after post earnings lows. Stock is trying to fill the earnings gap to $92.50. ABove that stock has resistance at $95. looking for calls as long as $88 holds for a move towards gap fill
ROKU Call Alert: Cheap Options, Big Upside?🚨 ROKU Options Alert (Aug 6) – Bullish Breakout or Bull Trap?
📉 **Daily RSI < 45** → Bears in control
📈 **Weekly RSI Rising** → Bulls not giving up
📊 **Heavy Volume on Red Candle** = Institutional Selling?
💥 **Call/Put Ratio Spikes** → Speculators loading calls
⚠️ **High Gamma Risk** (Only 2DTE) =
ROKU Stock Chart Fibonacci Analysis 052925Trading Idea
1) Find a FIBO slingshot
2) Check FIBO 61.80% level
3) Entry Point > 74.6/61.80%
Chart time frame:D
A) 15 min(1W-3M)
B) 1 hr(3M-6M)
C) 4 hr(6M-1year)
D) 1 day(1-3years)
Stock progress: B
A) Keep rising over 61.80% resistance
B) 61.80% resistance
C) 61.80% support
D) Hit the bottom

Potential Long Opportunity on ROKU from Current Levels up to 73.ROKU stock is showing signs of a potential rebound from the key support zone around 68-70, with early momentum improvement despite technical indicators still being in negative territory.
A break and hold above the 73.73 resistance could confirm a short-to-medium term bullish move toward the major re

See all ideas
Summarizing what the indicators are suggesting.
Oscillators
Neutral
SellBuy
Strong sellStrong buy
Strong sellSellNeutralBuyStrong buy
Oscillators
Neutral
SellBuy
Strong sellStrong buy
Strong sellSellNeutralBuyStrong buy
Summary
Neutral
SellBuy
Strong sellStrong buy
Strong sellSellNeutralBuyStrong buy
Summary
Neutral
SellBuy
Strong sellStrong buy
Strong sellSellNeutralBuyStrong buy
Summary
Neutral
SellBuy
Strong sellStrong buy
Strong sellSellNeutralBuyStrong buy
Moving Averages
Neutral
SellBuy
Strong sellStrong buy
Strong sellSellNeutralBuyStrong buy
Moving Averages
Neutral
SellBuy
Strong sellStrong buy
Strong sellSellNeutralBuyStrong buy
Displays a symbol's price movements over previous years to identify recurring trends.