SHOP in BUY ZONEMy trading plan is very simple.
I buy or sell when at either of these events happen:
* Price tags the top or bottom of parallel channel zones
* Money flow volume spikes beyond it's Bollinger Bands
So...
Here's why I'm picking this symbol to do the thing.
Price in buying zone at bottom of channe
0.010 USD
1.79 B USD
7.89 B USD
About Shopify Inc.
Sector
CEO
Tobias Albin Lütke
Website
Headquarters
Ottawa
Founded
2004
ISIN
ARBCOM460341
Shopify, Inc. is a global commerce company that provides essential internet infrastructure for commerce, offering trusted tools to start, scale, market, and run a retail business of any size. The Company's software enables merchants to run their business across all of their sales channels, including web and mobile storefronts, physical retail locations, social media storefronts and marketplaces. The Shopify platform provides merchants with a single view of their business across all of their sales channels and enables them to manage products and inventory, process orders and payments, fulfill and ship orders, build customer relationships, source products, leverage analytics and reporting and access financing, all from one integrated back office. The company was founded on September 28, 2004 and is headquartered in Ottawa, Canada.
Related stocks

Shopify is holding its ground within a strong ascending channelShopify Inc. NASDAQ:SHOP is holding its ground within a strong ascending channel on the daily timeframe.
After facing resistance near $250, price pulled back to retest the lower boundary of the channel around $223, a level that could now act as key support.
As long as it stays above this trendli

SHOP QuantSignals V3 Earnings 2025-11-03SHOP QuantSignals V3 Earnings 2025-11-03
SHOP Earnings Signal | 2025-11-03
• Direction: NEUTRAL | Confidence: 55%
• Entry Plan: Open | Expiry 2025-11-07
• Strike Focus: $167.50
• Entry Range: $7.55
• Target 1: $11.03
• Stop Loss: $5.15
• Implied Move: $20.75 (12.0%)
• 24h Move: -2.15%
• Flow Intel:

$SHOP: A 4-Year Pattern Breakout Before EarningsWith the AI bubble looking frothy, investors are hunting for the next big rotation. The consumer holiday play looks like the perfect switch, and all eyes are on $SHOP.
This is looking like a clean breakout from a massive 4-year rounding bottom—a pattern this big is a major deal.
The setup couldn't b

SHOP | Consensus Dealer Price Target $185Shopify ripped through its pivot on Friday, but dealers indicate that the run has further to go. Watch for continued strength.

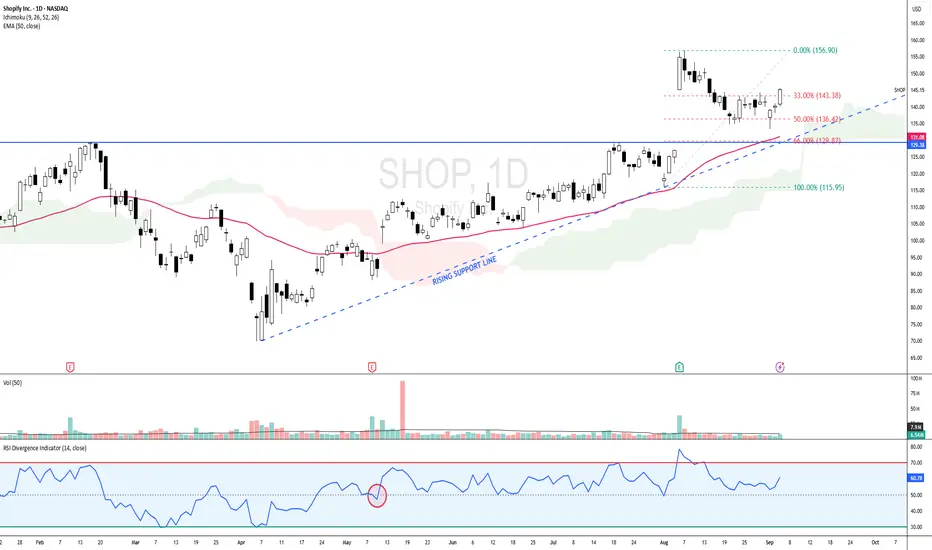
SHOP - BULLISH SCENARIO since 12 MAY 2025 SHOP - CURRENT PRICE : 145.15
SHOP is bullish as the share price is above 50-day EMA. Price action on 12 MAY 2025 is considered starting of bullish scenario because supported by several key indicators :
Share price gap up
Price broke out 50-day EMA
Price moving above ICHIMOKU CLOUD
RSI movin
SHOP - all time highs incomingSHOP - Stock is approaching recent highs at $167.69. looking strong for a possible breakout. Stock making a cup shaped reversal on the daily. Company to report earnings early next month. Looking for calls above $167.69 for a move towards $170 and $177(all time highs).

SHOP Breakout Watch – Bulls Eyeing $169 Zone!
Shopify (SHOP) is testing key resistance near $167, forming a bullish ascending structure.
A breakout above could trigger momentum toward $169–$170.
Holding above $164 keeps the short-term trend strong — below it, a retest of $160 is possible.
📊 Bias: Bullish above $164 – breakout confirmation aw

SHOP BullishContinues to trade within this ascending wedge. Both times we saw an intraday wick trade below and then close within the channel, prices ripped higher. It looks like Shopify is finally ready to break all time highs with a daily close above this wedge, looking above 170+. Targeting $200+ into earning

Keep your Eye on SHOPThere are so many Bullish patterns on this chart, I don't see how it will stay down. The weekly has an even Bigger pattern not included in this.

See all ideas
Summarizing what the indicators are suggesting.
Oscillators
Neutral
SellBuy
Strong sellStrong buy
Strong sellSellNeutralBuyStrong buy
Oscillators
Neutral
SellBuy
Strong sellStrong buy
Strong sellSellNeutralBuyStrong buy
Summary
Neutral
SellBuy
Strong sellStrong buy
Strong sellSellNeutralBuyStrong buy
Summary
Neutral
SellBuy
Strong sellStrong buy
Strong sellSellNeutralBuyStrong buy
Summary
Neutral
SellBuy
Strong sellStrong buy
Strong sellSellNeutralBuyStrong buy
Moving Averages
Neutral
SellBuy
Strong sellStrong buy
Strong sellSellNeutralBuyStrong buy
Moving Averages
Neutral
SellBuy
Strong sellStrong buy
Strong sellSellNeutralBuyStrong buy
Displays a symbol's price movements over previous years to identify recurring trends.