$T with a bullish outlook following its earnings #StocksThe PEAD projected a bullish outlook for $T after a negative over reaction following its earnings release placing the stock in drift D with an expected accuracy of 84.62%.
Key facts today
1,225 ARS
10.02 T ARS
112.02 T ARS
About AT&T Inc.
Sector
Industry
CEO
John T. Stankey
Website
Headquarters
Dallas
Founded
1983
ISIN
ARDEUT111713
FIGI
BBG000HDXSF8
AT&T, Inc. is a holding company, which engages in the provision of telecommunications and technology services. It operates through the Communications and Latin America segments. The Communications segment offers wireless, wireline telecom, and broadband services to businesses and consumers located in the US and businesses globally. The Latin America segment provides wireless services and equipment in Mexico. The company was founded in 1983 and is headquartered in Dallas, TX.
Related stocks

AT&T Long - 18 to 36 Months range. Nice swing, low risk.AT&T Long - 18 to 36 Months range. Nice swing, low risk.
T Looks like an interesting idea for the next 2 years or so.
I'm not analyst and don't listen to people from the internet! Think and analyze for yourself, just get ideas.
Zanetti.

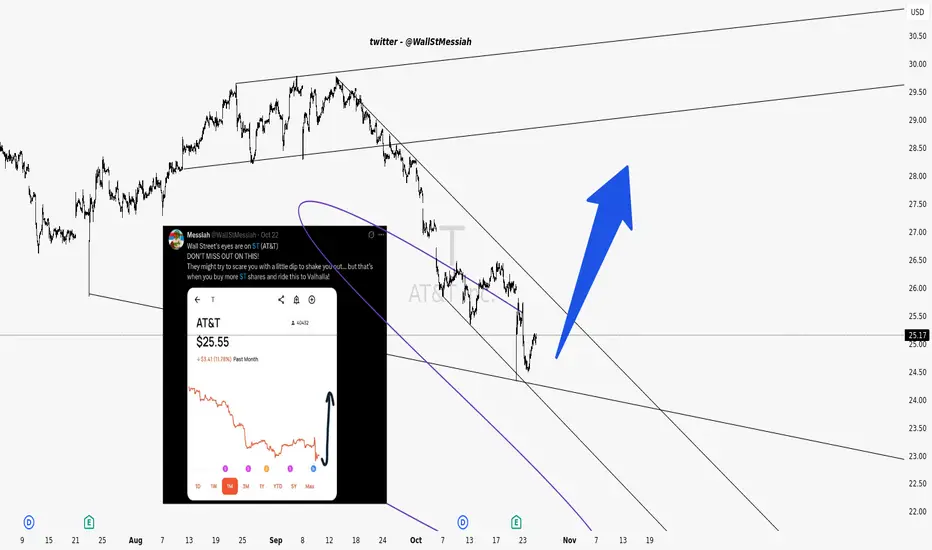
AT&T (T) — Bullish Breakout Setup Forming! Don’t Miss This MoveWall Street’s been sleeping on $T for too long…
After weeks in a clear downtrend, AT&T is showing serious signs of a **reversal setup** within this falling channel.
👀 Watch how price is bouncing off the lower trendline with strong volume support — a classic accumulation signal.
💪 Break above this d
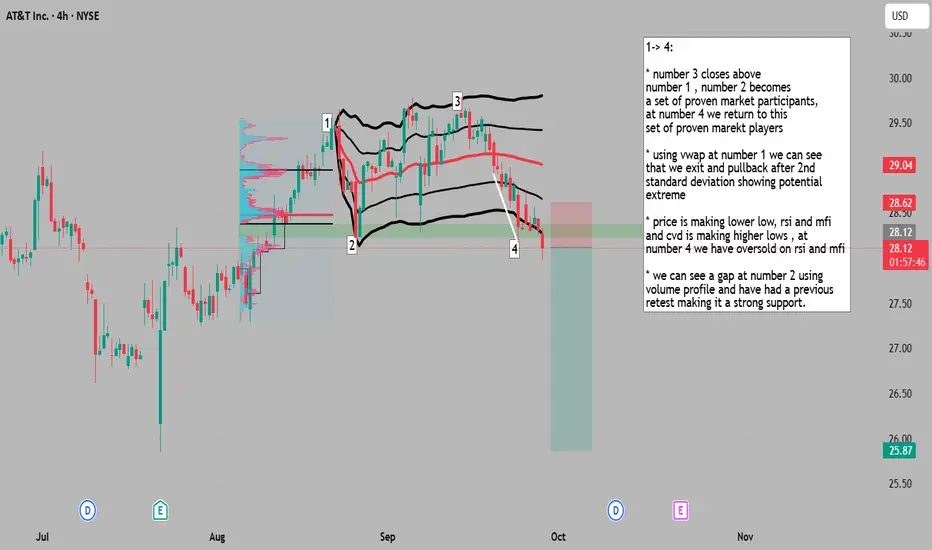
everything points up, but price going down = short the trade idea was long, but price has other ideas.
in this situation such a refusal to stick to the script means something powerful might be going on and joining which way price tells us to go then may be the best choice.
AT&T – Still Ringing?AT&T. The name alone evokes landlines, long-distance charges, and a time when phones had cords (and possibly rotary dials). But don’t let the vintage vibes fool you — this telecom titan might still have some signal left on the price chart.
Now, I’m not saying AT&T is about to moonwalk up the NASDAQ

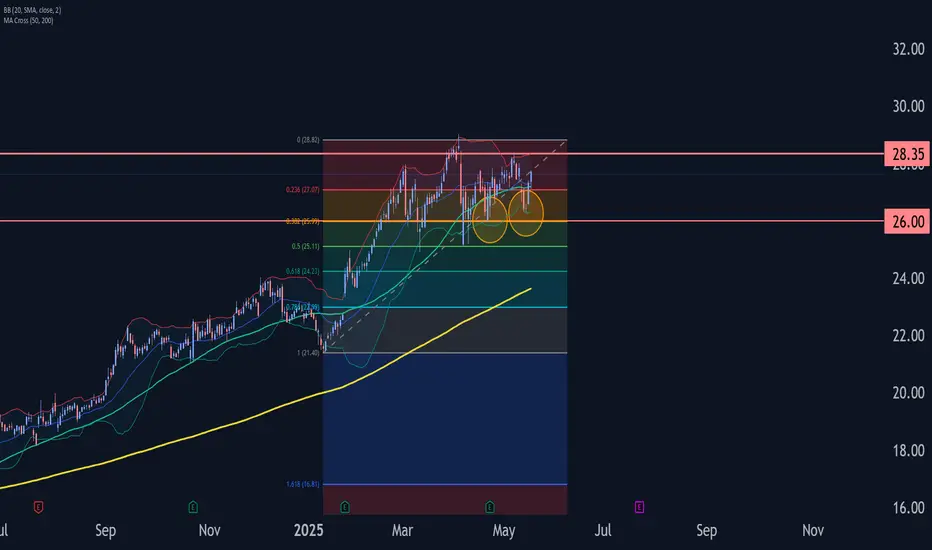
AT&T Wave Analysis – 16 May 2025- AT&T reversed from support zone
- Likely to rise to resistance level 28.35
AT&T recently reversed up with the daily Morning Star from the support zone between the key support level 26.00, 38.2% Fibonacci correction of the upward impulse from January and the lower daily Bollinger Band.
The active
AT&T I Tipping Point : Short Opportunity with Head & ShouldersHey traders after a previous trade trade on the hood hitting targets of 16.4%. Today I bring you NYSE:T
Technical + Fundamental View
Pro Tip
- Breakdown below the Entry Line will be considered at Trade Initiation. (Risky Traders)
R:R= 5.4
- Rest can follow entry at day close post breakdow

T Trading Guide 4/21/25AT&T (T) Trading Analysis for Monday, April 21, 2025
Sentiment Analysis
-Overview: Sentiment on X and StockTwits is neutral, with investors appreciating T’s 4.11% dividend yield but expressing concerns over tariff-driven cost increases. Analyst consensus remains stable, with a “Hold” rating and a

T Trade LevelsYou might notice that this is the Hourly timeframe.
For a ticker that moves 0.83 cents/day, I just needed to know the directional bias up top (ranging but leaning bullish).
I would expect day trades to move level to level.
The contracts listed will be your best options whether day or swing tradi

New Setup: TT : I have a swing trade setup signal. Looking to enter long if the stock can manage to CLOSE above the last candle high(BUY). If triggered, I will then place a stop-loss below (SL) and a price target above it(TP Zone) **Note: This setups will remain valid until the stock CLOSES BELOW my stop-loss l

See all ideas
Summarizing what the indicators are suggesting.
Oscillators
Neutral
SellBuy
Strong sellStrong buy
Strong sellSellNeutralBuyStrong buy
Oscillators
Neutral
SellBuy
Strong sellStrong buy
Strong sellSellNeutralBuyStrong buy
Summary
Neutral
SellBuy
Strong sellStrong buy
Strong sellSellNeutralBuyStrong buy
Summary
Neutral
SellBuy
Strong sellStrong buy
Strong sellSellNeutralBuyStrong buy
Summary
Neutral
SellBuy
Strong sellStrong buy
Strong sellSellNeutralBuyStrong buy
Moving Averages
Neutral
SellBuy
Strong sellStrong buy
Strong sellSellNeutralBuyStrong buy
Moving Averages
Neutral
SellBuy
Strong sellStrong buy
Strong sellSellNeutralBuyStrong buy
Displays a symbol's price movements over previous years to identify recurring trends.


