T appears to be running for now Awesome price moments over a bit of time. Volume increasing with last trading volume driving the price up almost nu-opposed at this time.
The first black line is likely to be met and is where I am going to sell half my position. That will likely make the remainder of my position free.
I had been accumulating LEAP Call options for sometime now and they are running now.
AT&T Inc Shs Cert Deposito Arg Repr 0.3333 Shs
No trades
Market insights

AT&T Big Resistance AheadYellow lines direct us to a retracement level and heavy resistance at the gap down
Likely previous channel offers some support below after that


AT&T Long for the futureAT&T Touched the support line, event that last occured in 2003 and 2009. Buy now and hold for retirement, no stop loss required.

$T | AT&T Large Monthly Pennant & 4HR Inverse Head and Shoulders$T is trading within a massive bullish pennant on the monthly chart.
Price recently found support at the bottom of the pennant structure & also at the horizontal demand zone.
On the 4 hour chart volume has increased and price is breaking out of an inverse head and shoulders pattern.
Potential Catalysts:
- Dividends Early January (>7% annual yield)
- Rumors that AT&T is closing deal to sell DirectTV
- Warner Bros announced it will send all of its movies to HBO Max the same time they are released in theaters
Targets: $30, $31, $31, $35
Let me know what you think in the comments!

$T is Positioned Nicely to Run $T is breaking through resistance at $29.15 and entering a channel it’s kept most of the year. PTs of $29.69, $30.13 and $30.65.
Today (12/3) Warner Bros. announced its 2021 movie distribution strategy which will consist of all 17 movies being in theaters and on HBO Max simultaneously. This should provide a nice spike in HBO Max subscriptions. Theater chain shares dropped double digits on the news.

ATT ideaHidden bullish divergence played out followed by a poor attempt by the bearish divergence just played into a higher low. Ascending line of support running into a flat line of resistance. If it breaks, these are my targets. If it fails, the interpretation shifts back to a rising wedge that could be argued, and consider your stop loss accordingly.


Multi Timeframe analysis and aligned setup on AT&Ta) Let's start with the Weekly chart: We have a clear bullish view, Support Zone + Ascending trendline. Those two levels combined on the same spot provide us with a solid level to think of as the beginning of a new ascending impulse
b) On the 1H scenario, we can see:
-The price is inside a range (between the Weekly support zone and the Next Resistance Zone)
-There is a broken descending trendline (that provide us with a bullish perspective)
- On the Range, we have an inner Support/Resistance zone in which the price is currently on the edge of that
- On the previously mentioned level we have a clear corrective Structure
FINAL CONCLUSION:
Based on all the previous items. IF the price breaks the current corrective Structure, we will open long setups on the shown level. With a Target on the next resistance zone. The yellow line represents the Break-Even level. We will take a 1% risk of our Capital on this setup / The expected duration of the Trade is 10 Days. The stop loss will be set below the structure.


😮🌟T bullish scenario:😮🌟T bullish scenario:
We have technical figure Channel Down in US company AT&T Inc. (T) at daily chart. AT&T Inc. is an American multinational conglomerate holding company. It is the world's largest telecommunications company, the largest provider of mobile telephone services, and the largest provider of fixed telephone services in the United States through AT&T Communications. The Channel Down has broken through the resistance line at 25/11/2020, if the price holds above this level we can have possible bullish price movement with forecast for the next 39 days towards 30.74 USD. Our stop loss order should be placed at 26.35 USD if we decide to enter this position.
🌟🌟🌟Fundamentals:
- A U.S. judge dismissed a libel lawsuit filed by President Donald Trump’s re-election campaign against CNN over a 2019 opinion piece which it said suggested the campaign would be open to Russian interference, according to a court document. The campaign sued CNN, which is owned by AT&T Inc, in March over the June 13, 2019, piece by Larry Noble, a CNN contributor and former general counsel of the Federal Election Commission.


$T - NRPicks Nov 11AT&T acaba de presentar resultados trimestrales, mostrando mejoría en algunos de sus segmentos: conectividad de banda ancha, Fiber, suscripciones HBO.
El precio actual está muy cerca de minimos de 10 años, muy atractivo para una empresa muy sólida en generación de efectivo. ($ 52 Billions)

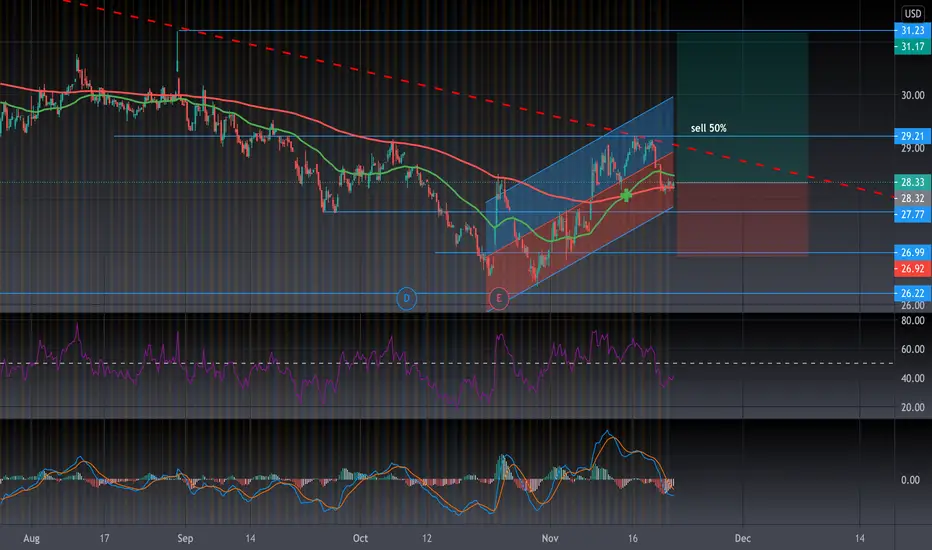
support on 200macould retrace to 27.77 (Previous Support) the plan is to go half at 28.33 and wait to see what the market does for the other. sell 50% at previous resistance. 29.75
id like to see at least 31.20 for another 75% sell off.
AT&T long term holdAT&T has been very disappointing the last decade but, being the biggest cellphone provider in America and with their investments in 5g I believe there's room for growth. This chart is on a custom 12M chart because this helps filter out a lot of the corrective waves that occurred over the past decade. I have a limit order at $24 dollars and it's not a bad hold as they pay a hefty dividend every quarter and the price is extremely low. This is a long term investment as most of the gains will be from the dividends. Good luck investors.


a couple optionseither wait for a dip buy around 22-23 or look for a break of the top trendline. you can see how in its past it has a big breakout when the downtrendlines breaks. patience is key here. gl :)


